Project 1 - Data Handling and Interpolation
project 1
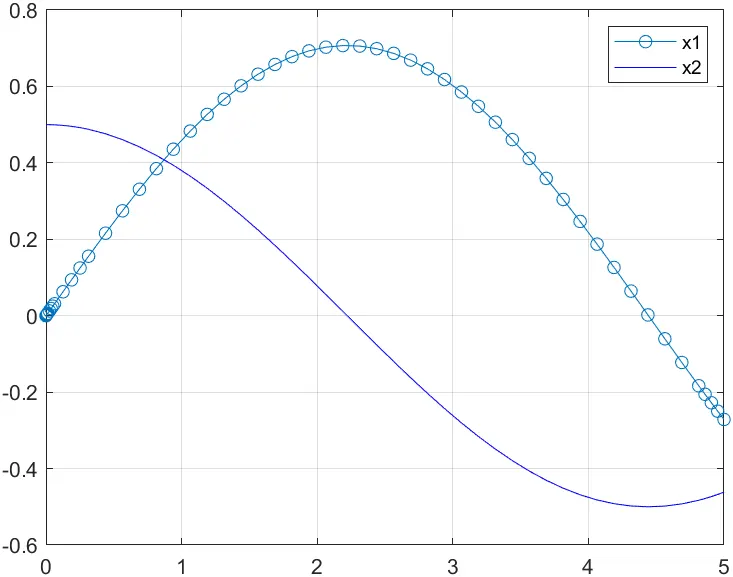
>> x0=[0 0.5]; %initial condition
>> [t,x]=ode45(@(t,x)x_dotfcn(t,x,k,m),tspan,x0);
>> x_dot(1)=x(2);
>> plot(t,x(:,1),'-o');grid;hold;
>> plot(t,x(:,2),'b-');
enter the value spring consant: 5
k =
5
enter the value mass: 10
Current plot held
>>
ode 23
>> x0=[0 0.5]; %initial condition
>> [t,x]=ode23(@(t,x)x_dotfcn(t,x,k,m),tspan,x0);
>> x_dot(1)=x(2);
>> plot(t,x(:,1),'-o');grid;hold;
>> plot(t,x(:,2),'b-');
enter the value spring consant: 5
k =
5
enter the value mass: 10
Current plot held
>>
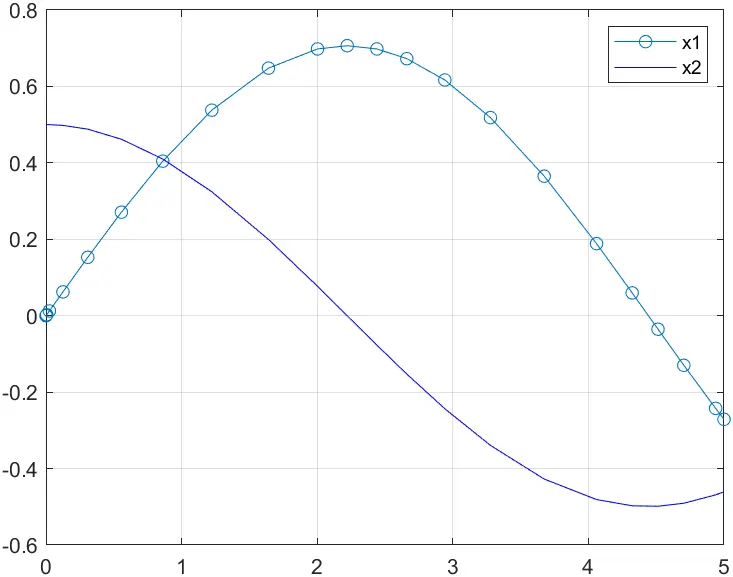
ode43 give more accuracy than ode 23 . value will be more accurate
project 2
fid= fopen('polyfit_out.txt','w') %write polyfit into text file
for i=1:100
fprintf(fid,'%d/n',polyfit);
end;
fclose(fid);
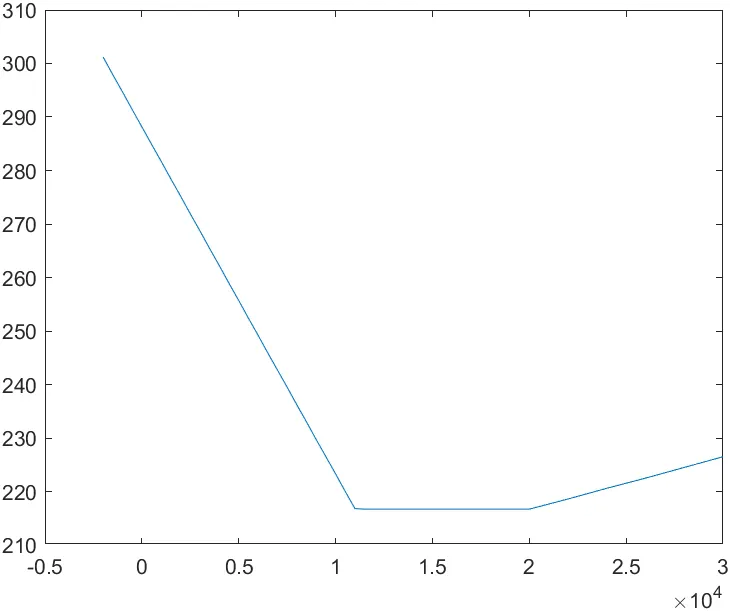
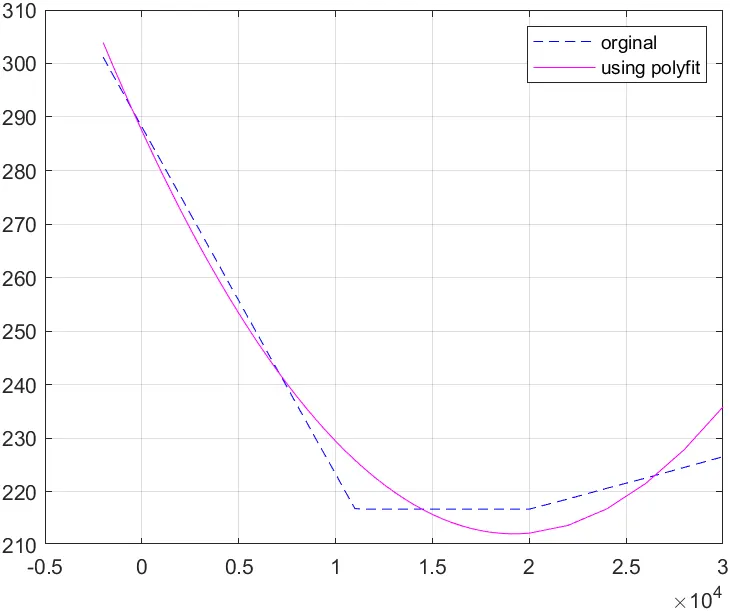
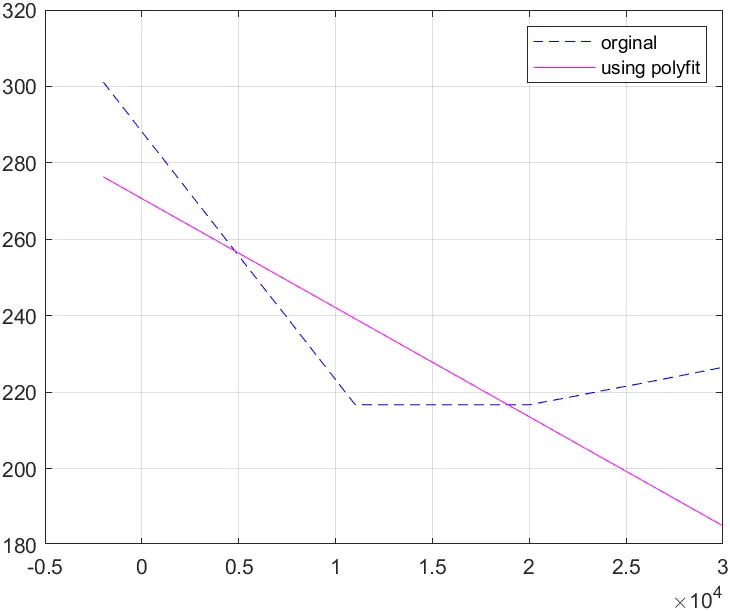
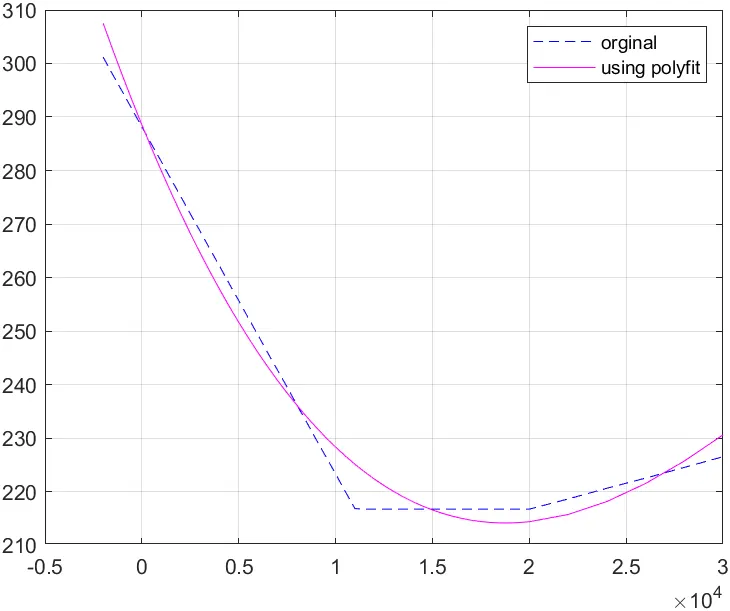
degree 3
project 3
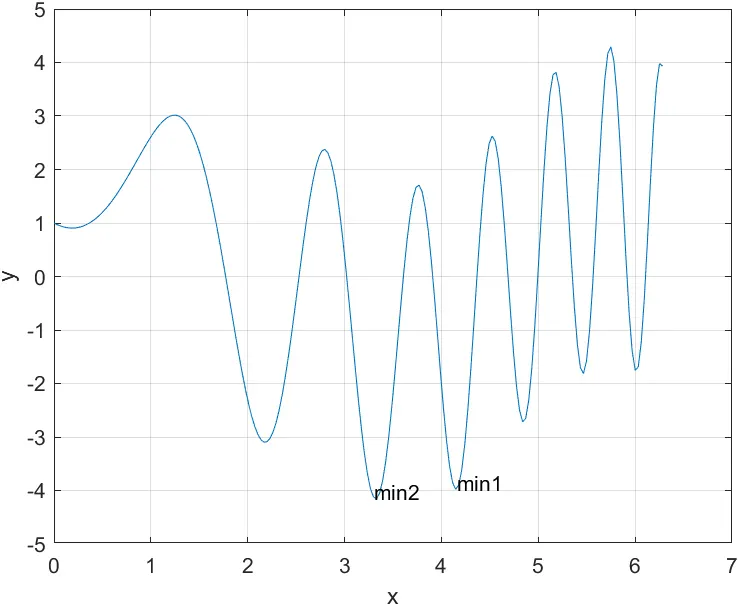
>> y=fuctionminmax(x);
>> plot(x,y);grid;xlabel('x');ylabel('y');
>> y_min1=fminsearch('fuctionminmax',4) %find min value
y_min1 =
4.1506
y_min2=fminsearch('fuctionminmax',3)
y_min2 =
3.3217
y_max=max('fuctionminmax') %find max value
y_max =
120
>> gtext('min1');gtext('min2');
project 4
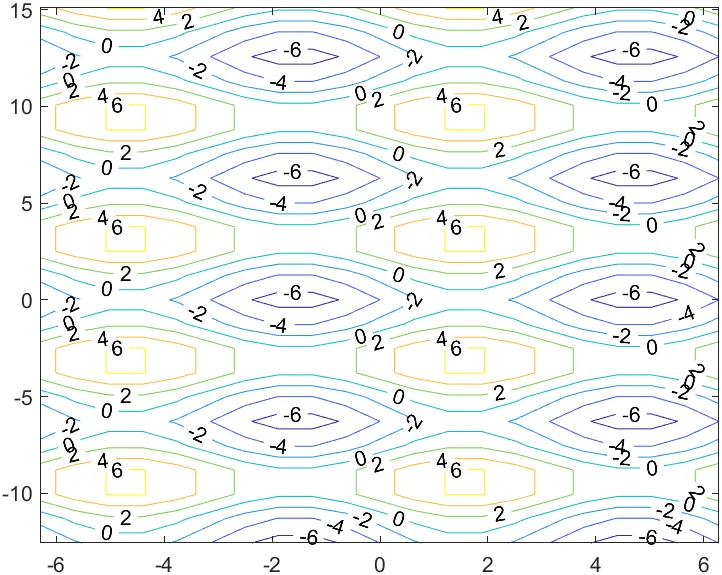
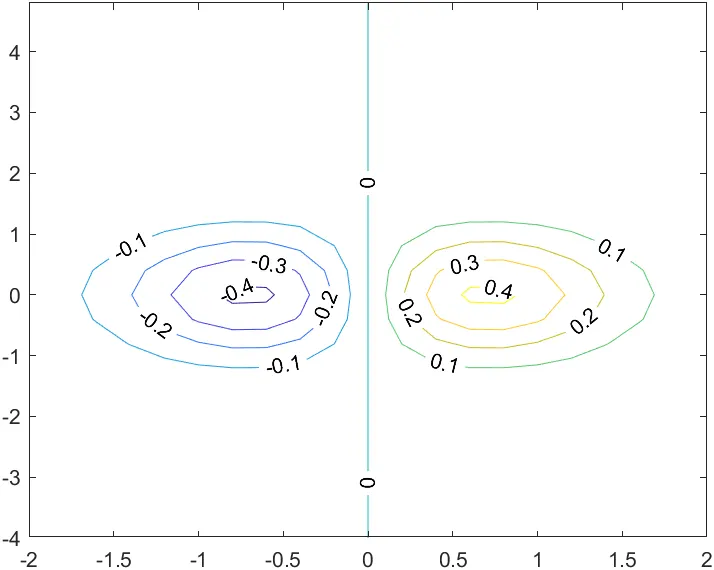
contour commend used to generate contour lines by joining points with the same elevation.it represent a 3D surface by plotting the lines that connect points with common z values along a slice.
>> [x,y]= meshgrid(-2:0.2:2.0,-4:0.4:5); %mesh grid fuction to create x and y matrices
>> z=x.*exp(-x.^2-y.^2); %fuction z
>> contour(x,y,z,'showText','on') %show text on display the values along the counter line.
> [x,y]= meshgrid(-2*pi:0.2*pi:2*pi,-4*pi:0.4*pi:5*pi);
>> z=3*sin(x)-4*cos(y);
>> contour(x,y,z,'showtext','on');