Project 1 - Data Cleaning and Transformation using Pivot table and Charts for the Report on requirement of Team Hiring
a. Done the changes of font size, alignment, and borders.
b. Make a summary of Products Sales by providing
- Total Sum of Sales
- Average of Sales
- Standard Deviation of Sales
- Variance of Sales
- Maximum Sales
- Minimum Sales
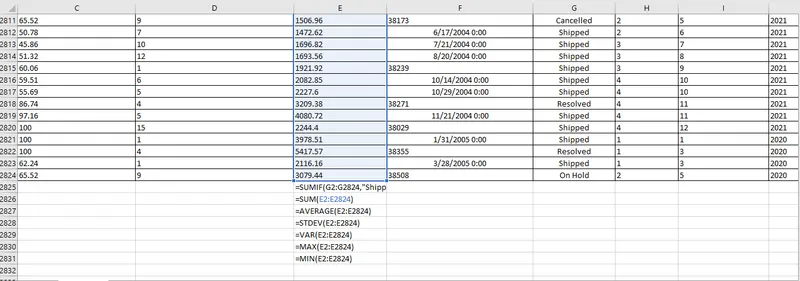
c. Submitted in excel sheet.
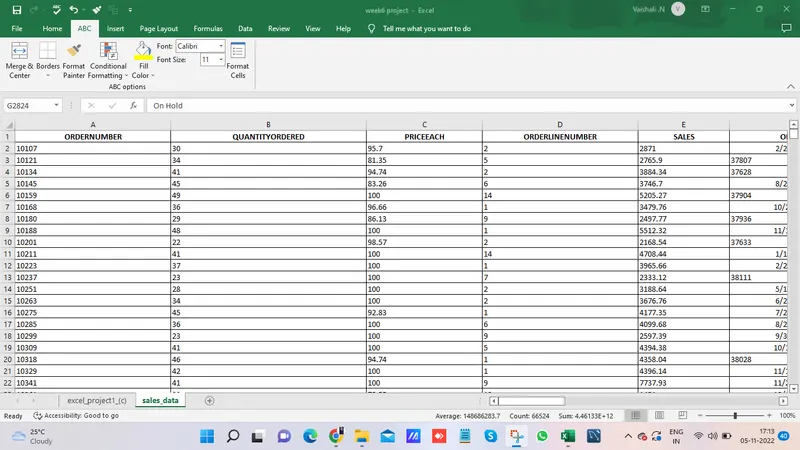
d. A new tab is created, "ABC," and a new ribbon is made, "ABC options."
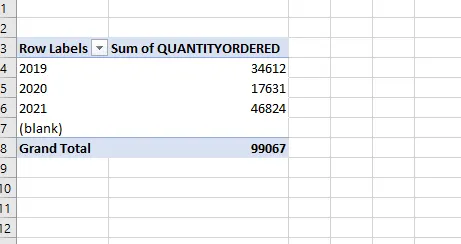
e. Quantities ordered by each Country in Year 2019,2020 and 2021.
f. Different colors for values in the field Status and ProductLine using conditional formatting.
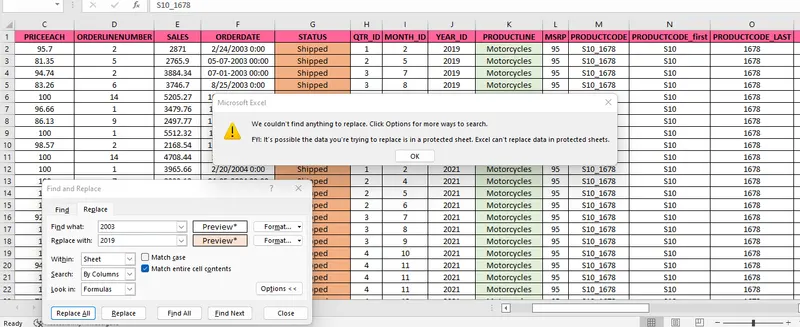
g.I'm getting a dialogue box stating it is protected.
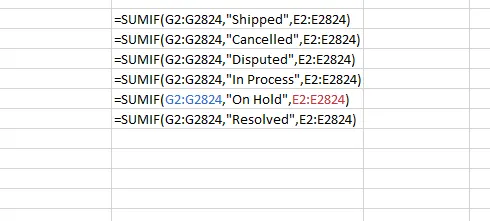
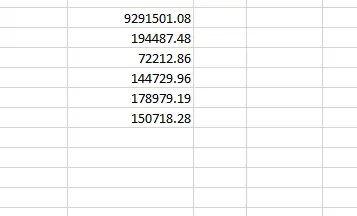
h. Calculate the total sales of all “Shipped”, “Cancelled”, “Disputed”, “In Process”, “On Hold”, and “Resolved” products.
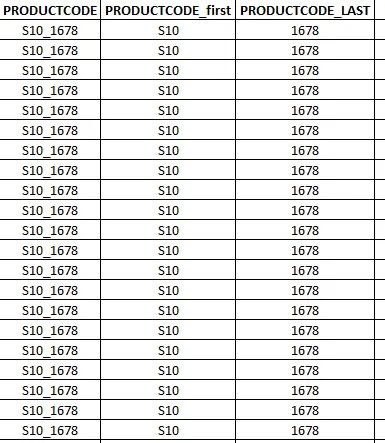
h(i). Add two new fields in the data sheet with reference to Productcode using text functions
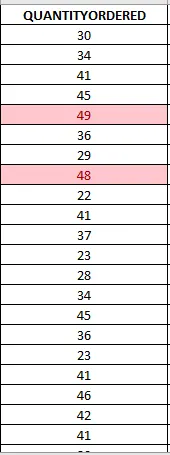
h(ii). Highlight the top 10% values of the QuantityOrdered field using Conditional Formatting.