Project 1 - COVID-19 Vaccinations Trend Analysis
COVID-19 Vaccinations and Trend Analysis
Aim- This Project mainly aims to find out the trend of the vaccinations around the world for the prevention of the Covid 19 pandemic and how much has been achieved so far.
Introduction- The COVID 19 pandemic caused due to the Corona virus devastated the world by causing several fatalities around the world. This virus originated in Wuhan, China in 2019 and was later spread throughout the world due to human contact in one way or the other. The disease showed symptoms as basic as mild fever and cold but also caused life threatening symptoms like breathing problems caused by damage to the lungs. The main objective of this project is to analysis the data on, COVID-19 Vaccinations. Through the Analysis of data, we can find out some important insights.
Problem statement-
- In this project we need to analysis the vaccinated countries.
- Analysis of top 5 vaccinated and daily vaccinating countries.
- Analysis of fully vaccinated people details.
Methodology -
1.Data importing-Open Power BI desktop, then with the help of Get Data option > Click on Text/CSV option > Click on file you want to import > click on load option
2.Data cleaning-After loading the data I understood that there are 86512 rows and 15 columns, And in the same data there were null values, which are been replace by 0.Now we can start working on the data .
3.Visualizations-In Visualization part with the help of power BI desktop software,
I have used different kinds of charts ,graphs, cards and tables to display the data in the format which will understood easily.
- Analysis-In this part I have analyse, top 10 fully vaccinated countries by using area chart and used filter option to find out the top countries .
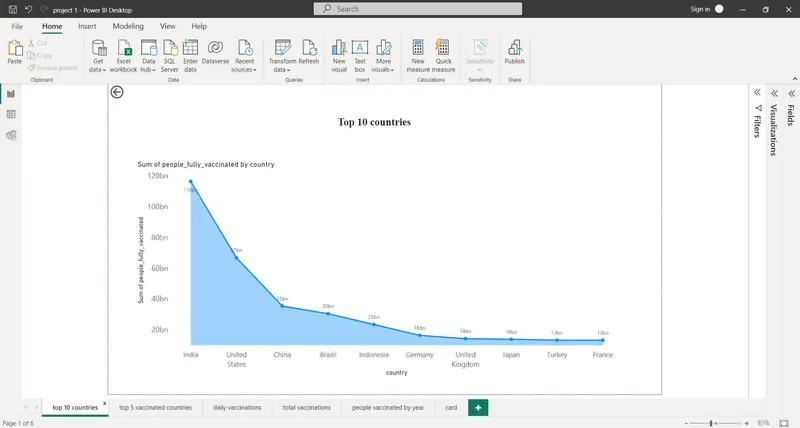
Fig 1
From the above image I got to know that India is the first country in term of fully vaccination with respect to 116 billion people ,next after comes to united state of America with 67 billion vaccines and then China with 35 billion vaccines respectively.
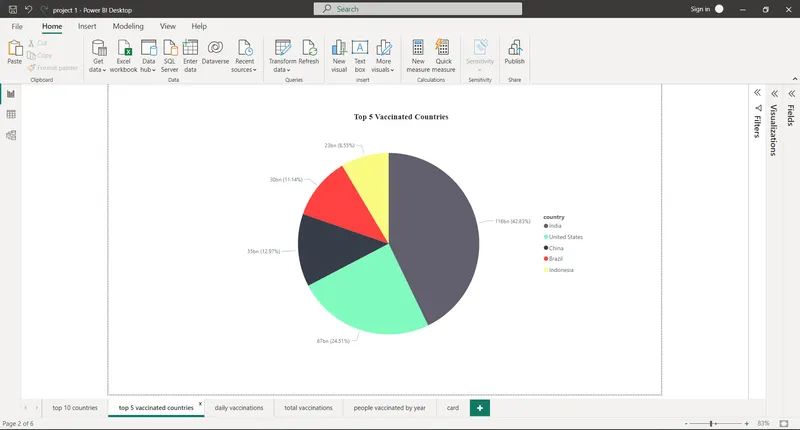
Fig 2
In the above (fig 2) analysis we have analysis the top 5 vaccinated countries with the help of pie chart and used filter option to find the top countries and with that we came to know that India is the top country with more number of vaccinated peoples followed by United States of America and Brazil.
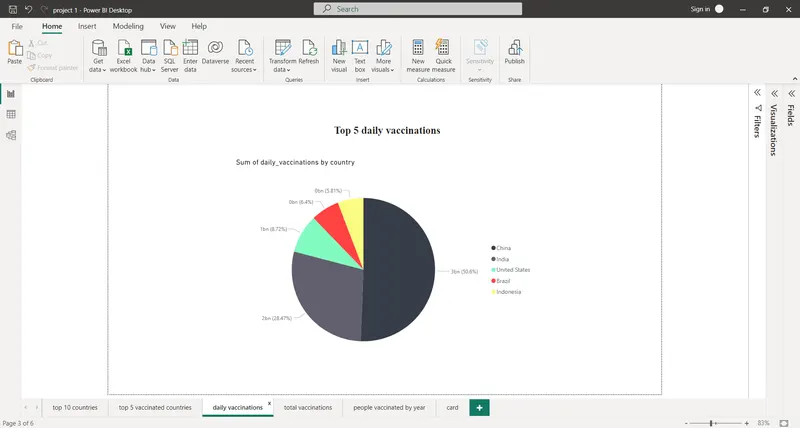
Fig 3
In the Fig 3 analysis we have analysis the top 5 country with daily vaccinations with the help of pie chart and used filter option to find the top country with daily vaccinations and with that we came to know that China is the top country with more number of vaccinations followed by India and United States of America. From the above images we have came to know about the statics of daily vaccination, people who have fully vaccinated and people who is vaccinated and I used cards for this to display the value.
Fig 4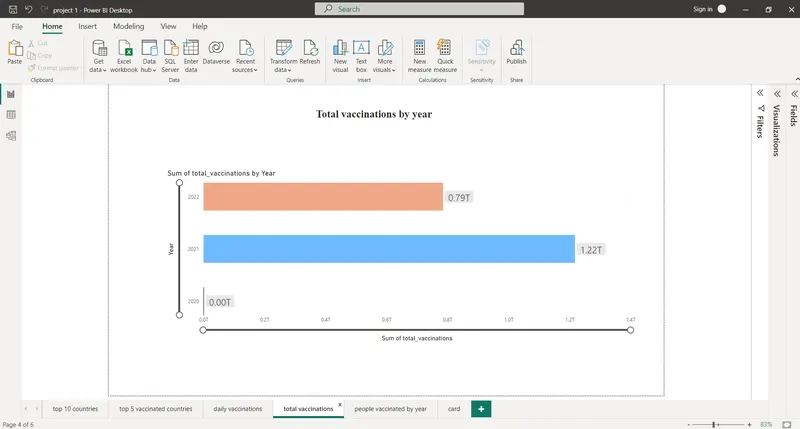
In fig 4 shows that daily vaccinating details wrt years , Since we have resulted that the maximum daily vaccination is done in 2021 year which is highest as per data provided .
Fig 5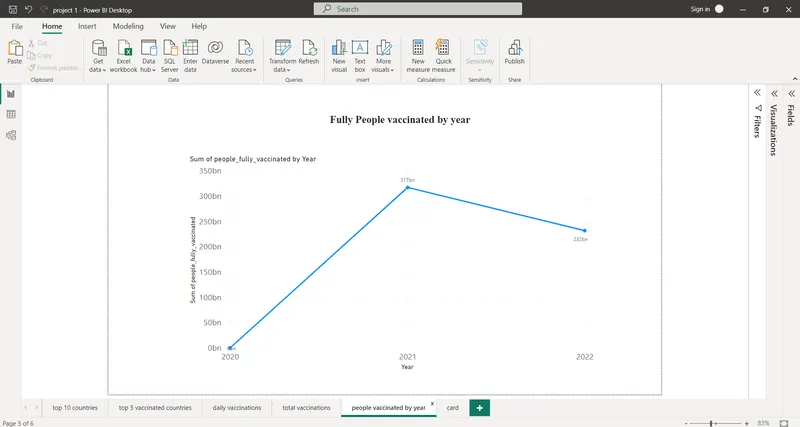
AS per fig 5 we understand that fully vaccinating details year wise and here we can conclude that 2021 is a year which is having maximum number fully vaccinated peoples and I have used Line chart.
Fig 6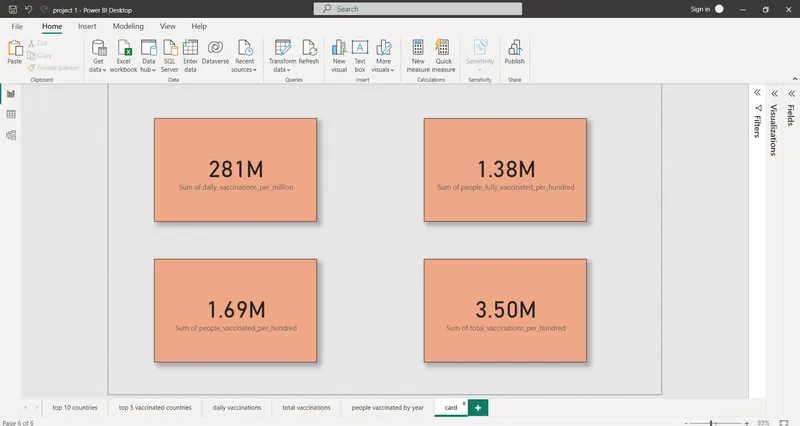
In fig 6 we have visuals of charts which display the sum of all the vaccinations done that are Sum of daily vaccination per million , sum of people fully vaccinated per hundred, sum of people vaccinated per hundred, Sum of total vaccination per hundred is show .
Fig 7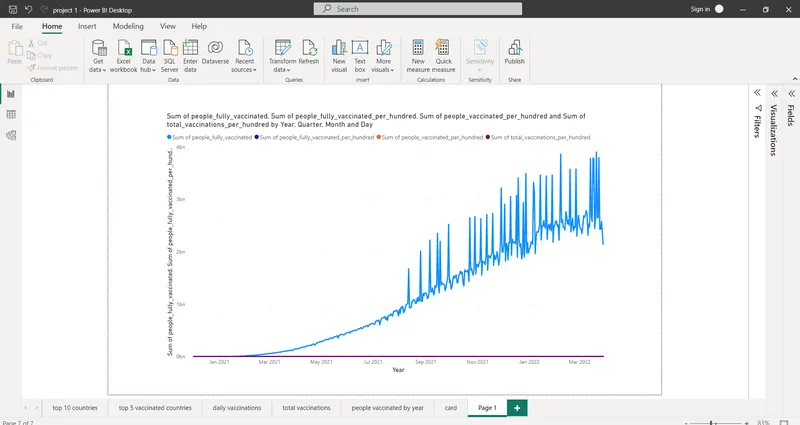
Insights-
- We analysis top 10 fully vaccinated countries in which India stand to be at top , where 116 billion people are vaccinated .
- In top 5 countries India stands out to be at top level, next comes United states.
- China is at number one position in term of daily vaccinating country, then comes India
- We collected all the data with respect of all the Total vaccinating data .
- 2021 was the highest vaccination intake year .
Recommendations-
- Day to ay report can be maintain at the same time
- Can analysis the data all over the world
- We can work on large datasets ,so that we can get the perfect counts of vaccination
Conclusion-
As per dataset we understand that the vaccination process in every countries are at the best position , with this data its seem that COVID19 is at stable state .