Project 1 - COVID-19 Vaccinations Trend Analysis
Project COVID-19 Vaccinations Trend Analysis using Power Bi
Aim:
This project focuses on a detailed analysis of vaccination and full
vaccination data, categorized by year and country.
Introduction:
The primary goal of this project is to analyze data on COVID-19
vaccinations, aiming to uncover key insights through detailed analysis.
Problem Statement:
- In order to know how many people are full vaccinated by the initial protocol.
- To know the population which has received at least one dose of the vaccine.
- The different vaccines used and their availability to different countries.
Methodology:
The dataset used in this project is publicly available and has been gathered
from the respective health departments of various countries as well as the WHO.
It includes data spanning from December 2020 to March 2022.
Step1: Data Exploration
To take any necessary actions, it's essential to first understand the data
through exploration. Based on this understanding, we can then proceed with the
appropriate data cleaning steps.
Step 2: Data Importing
To import the data into Power BI, begin by selecting the "Get Data"
option under the Home tab. Since the file is in CSV format, choose the
"Text/CSV" option from the drop-down list and then select the
appropriate file. Once selected, the data will be displayed. Click
"Load" to save the data.
Step3: Data cleaning
I used Power BI to clean and transform the data based on my understanding. I
replaced values, grouped the data, and created a new table where appropriate.
Step4: Data Visualization
I utilized Power BI to visualize the data and extract meaningful insights for a
better understanding of the dataset. I employed various visualizations, such as
bar graphs and line graphs, available within the tool.
Analysis:
The dataset contains the following columns
- Country – The name of the countries (169 Countries in total)
- ISO Code – Code initials for the countries
- Date – The date, month and year of the data collected
- Total vaccinations – The total number of vaccinations administered which is nothing but the sum of the doses given on any particular date to the total vaccinations of the previous day.
- People vaccinated – The total number of people who received at least one dose of vaccine. This is also an aggregated column meaning it is the sum of total of the previous day to the vaccinations of the present day.
- People fully vaccinated – The aggregated value of people who received the desired number of doses (min 2 doses and 1 booster dose may or may not be included).
- Daily Vaccinations Raw – gives the raw data collected on vaccinations
- Daily vaccinations – The vaccinations administered on any particular day
- Total vaccinations per 100 – The total vaccinations administered per 100 people which also an aggregated data
- People vaccinated per 100 – The number of people who received at least one dose of vaccine, taking into account for every 100 people
- People fully vaccinated per 100 – For every 100 people how many are fully vaccinated (received min 2 doses)
- Daily vaccinations per million – gives the number of vaccinations administered for every million population on any particular day.
- Vaccines – gives the different vaccines and their manufacturers separated by commas.
- Source name – gives the name of the source from which data is provided.
- Source website – gives the website link from where the data was obtained.
Now we know that what the data set contains to analysis the data.
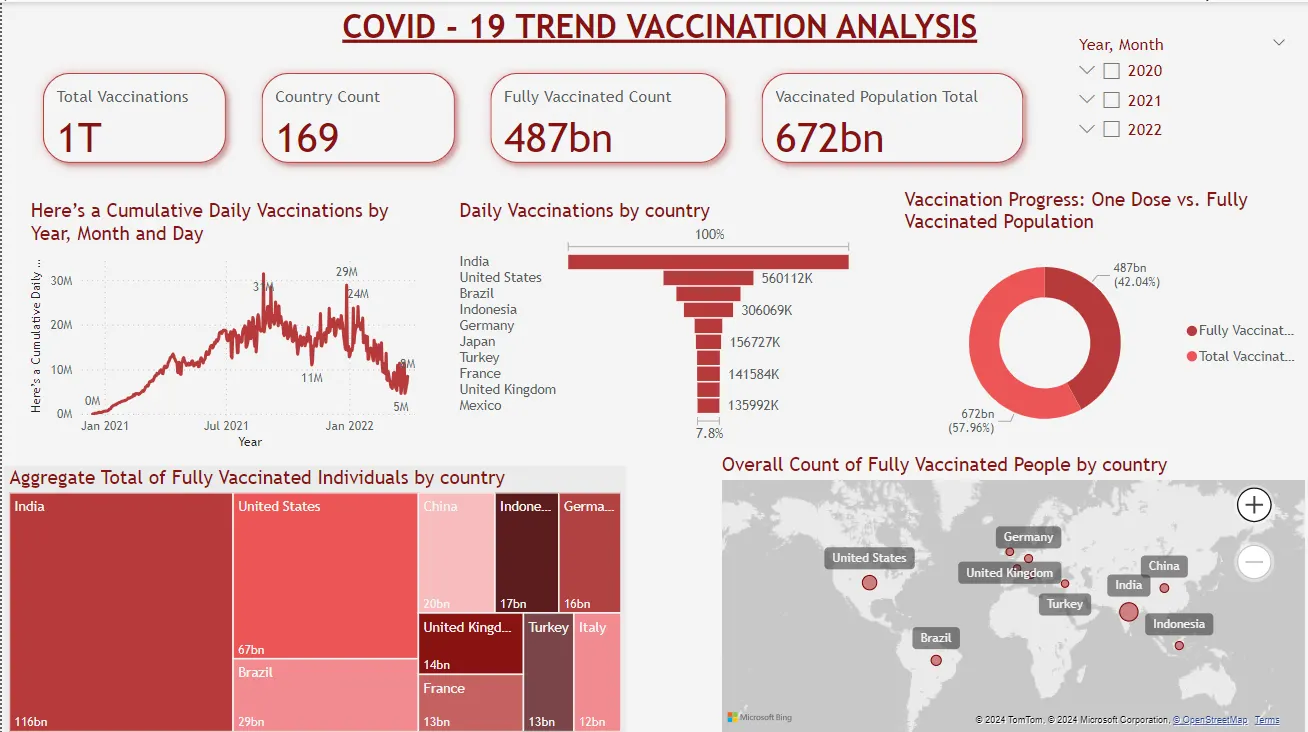
The card visualization has been used to show different numeric values like total countries, vaccination details and number of people vaccinated.
- In this we can see that there are 169 countries available in the given data set
- There are 487 billion Peoples are Fully Vaccinated all over the world.
- Total Vaccinations available is more than 1 trillion.
- There are 671 billion peoples have been Vaccinated at least 1st Dose or 2nd Dose

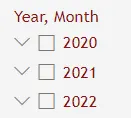
The Slicer is added with Year and the Month. It is used to know how the vaccine process is going on.
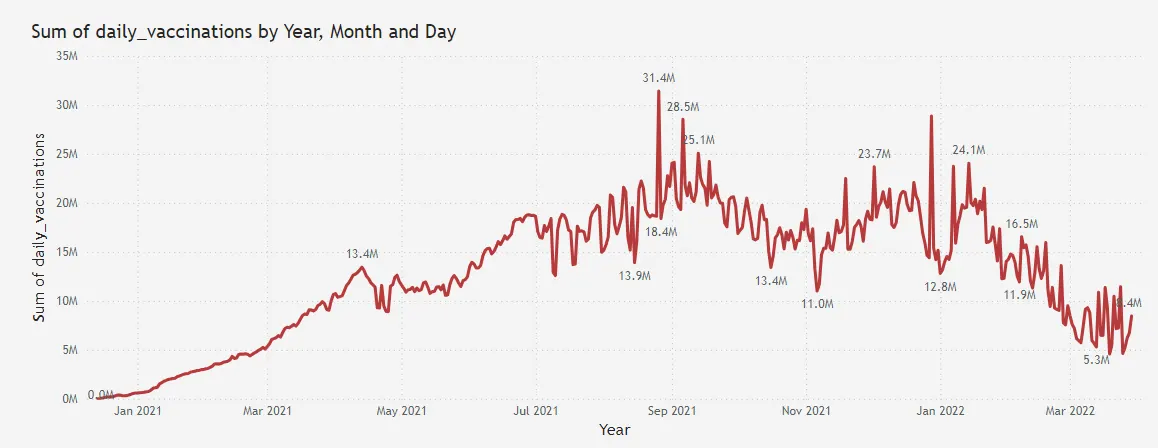
A line graph is used to represent to daily vaccinations versus the date of the record.
- In this line graph we can see the people vaccinated date based on date.
- The Vaccinated ratio is gradually increased from Jan 2021 and it reaches high of 31.4M on September 2021.
- The graph has seen variations in further months where it has dropped to 11 million doses in a day and again seen a raise of 24.1 million doses. Still around 16.1 million doses were administered at the end of Jan 2022.
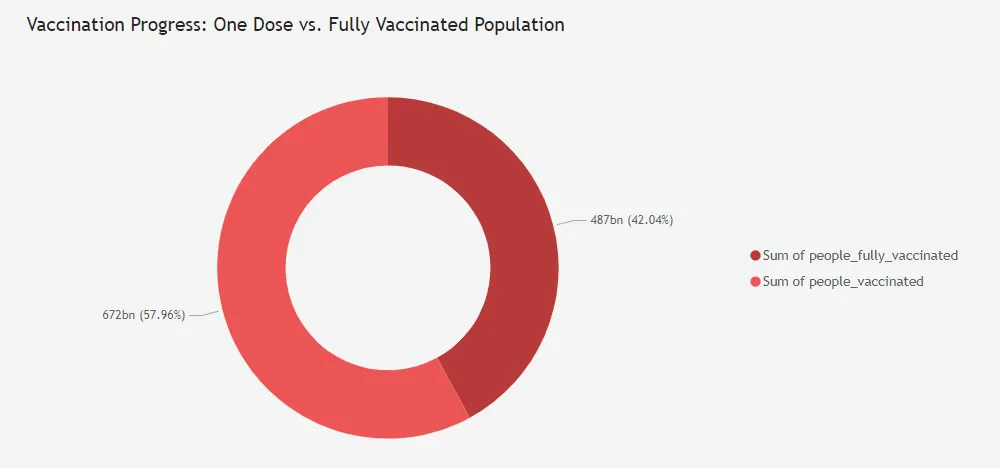
A donut chart has been plotted to represent the People Fully Vaccinated and the People Vaccinated at least one dose.
From the Donut chart we can that 57.96% of peoples are vaccinated at least one dose and 42.04% of peoples are fully vaccinated in the world
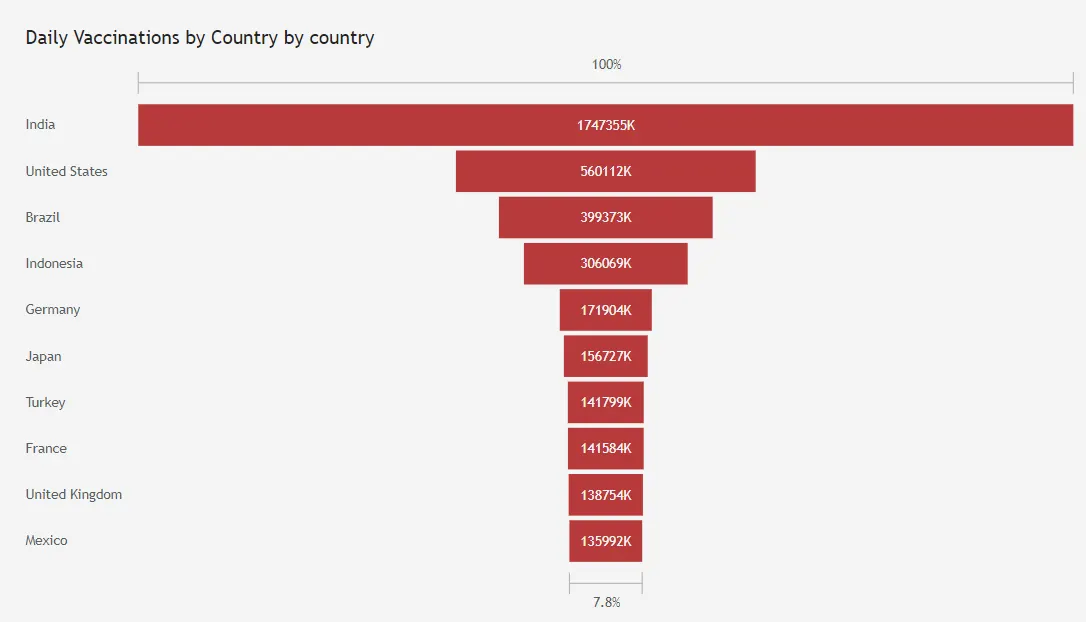
The Country at the Top level of daily vaccination is India.
Through the funnel map we have analysis the top 10 country in which peoples are fully vaccinated.
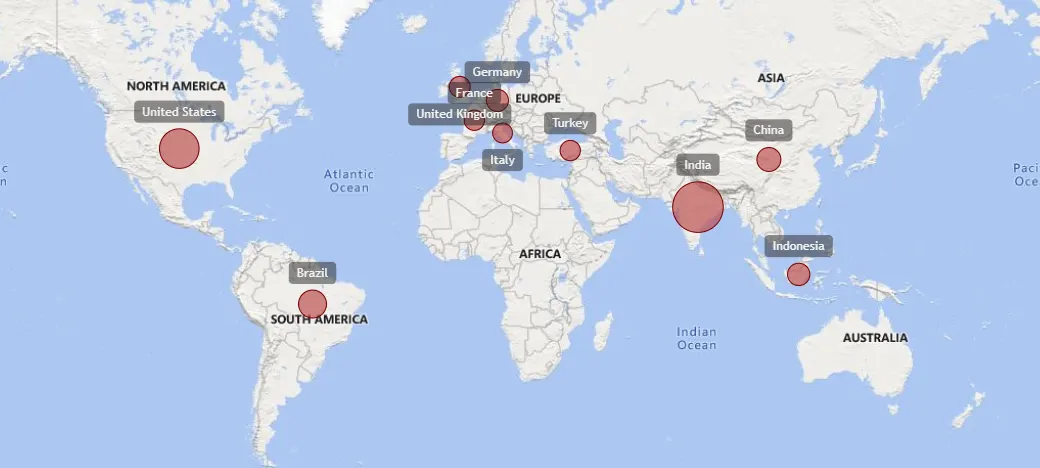
A map visualization is also shown which gives the population fully vaccinated in different countries and are differentiated based on the color gradient.
Insights:
The final report delivers essential insights into global vaccination efforts, allowing for the identification of the top 10 countries with the highest fully vaccinated rates.
The high rate of fully vaccinated individuals demonstrates a collective commitment to eradicating the deadly virus. The insights gained from this analysis support informed decision-making and targeted actions to address COVID-19 challenges. Overall, this data analysis has provided valuable information, contributing to the ongoing global efforts to combat the pandemic effectively.
Recommendations:
- We can perform operations with various categories.
- In order to improve the accuracy and usefulness of the data analysis, it is important to ensure that the datasets used are of high quality and are properly cleaned and organized.
- The developed and economically strong countries should help out the under developed and developing countries to improve the vaccination of the people.
- At least 90% of the population should be vaccinated at least once to avoid further problems
Conclusions:
The COVID-19 vaccination analysis shows over 1 trillion doses administered worldwide across 169 countries. 672 billion people have received at least one dose, while 487 billion are fully vaccinated, representing 42.04% of the vaccinated population. India leads in daily vaccinations, followed by the United States and Brazil. Vaccination rates vary across countries, but overall, the global rollout is progressing well, with more people being vaccinated every day.