Project 1 - COVID-19 Vaccinations Trend Analysis
Covid – 19 Vaccination Trend Analysis
Aim
This project aims to find out the trend of the vaccinations around the world for the prevention of the Covid 19 pandemic and how much has been achieved so far.
Introduction
The COVID 19 pandemic caused due to the Corona virus devastated the world by causing several fatalities around the world. This virus originated in Wuhan, China in 2019 and was later spread throughout the world due to human contact in one way or the other. The disease showed symptoms as basic as mild fever and cold but also caused life threatening symptoms like breathing problems caused by damage to the lungs. As this virus was new to the world and there was no vaccine or cure to it at the initial period there were several deaths around the world. The countries around the world were forced to shut themselves to others in order to avoid the further spread of the virus and people were stuck inside their houses and faced many issues with their finances, mental health etc., and felt like animals in a cage. An effort was made to find a cure or vaccine by several health organizations to bring a stop to this pandemic.
In later stages of 2020 several experimental vaccines were developed and was administered to humans. The efforts were successful as the vaccines were helpful in reducing the affects the virus and even if people were infected, they were not in any life threating situation and escaped the illness having only minor symptoms.
Many countries later developed their own vaccines and also helped other countries without the resources by providing them with vaccines developed.
Problem Statement
- In order to know how many people are full vaccinated by the initial protocol.
- To know the population which has received at least one dose of the vaccine.
- The different vaccines used and their availability to different countries.
Methodology
The dataset was provided with the project assignment which is basically the data available for the public and which is collected from the respective health departments of the countries or from the WHO.
The dataset contains information for the period December 2020 to March 2022.
Step 1: Data Exploration
In order to take any necessary steps we must understand the data we have, which is data exploration and based on our understanding we can go ahead with the appropriate data cleaning steps required.
Step 2: Data cleaning
I have used Power BI tool to clean and transform the data as per my understanding and I have replaced values, grouped the data and created a new table where it seemed fit.
Step 3: Data Visualization
I have used Power BI tool to visualize the data available to gain meaningful insights and better understand the dataset. I have used different visualizations like bar graphs, line graphs which are available in the tool.
Analysis
The dataset contains the following columns
- Country – The name of the countries (223 Countries in total)
- ISO Code – Code initials for the countries
- Date – The date, month and year of the data collected
- Total vaccinations – The total number of vaccinations administered which is nothing but the sum of the doses given on any particular date to the total vaccinations of the previous day.
- People vaccinated – The total number of people who received at least one dose of vaccine. This is also an aggregated column meaning it is the sum of total of the previous day to the vaccinations of the present day.
- People fully vaccinated – The aggregated value of people who received the desired number of doses (min 2 doses and 1 booster dose may or may not be included).
- Daily Vaccinations Raw – gives the raw data collected on vaccinations
- Daily vaccinations – The vaccinations administered on any particular day
- Total vaccinations per 100 – The total vaccinations administered per 100 people which also an aggregated data
- People vaccinated per 100 – The number of people who received at least one dose of vaccine, taking into account for every 100 people
- People fully vaccinated per 100 – For every 100 people how many are fully vaccinated (received min 2 doses)
- Daily vaccinations per million – gives the number of vaccinations administered for every million population on any particular day.
- Vaccines – gives the different vaccines and their manufacturers separated by commas.
- Source name – gives the name of the source from which data is provided.
- Source website – gives the website link from where the data was obtained.
Now we know that what the data set contains we can clean the data as required.
The dataset contains several null values in columns like total vaccinations, people vaccinated, people fully vaccinated, total vaccinations per 100, people vaccinated per 100 and people fully vaccinated per 100 which has data already aggregated with the increasing time line. So I have just filled down the values previously available till the data is updated on any particular date. Further where still null values exists I have replaced them by 0.
Then, I have created a new table as aggregations by grouping the countries and taking the maximum values for the columns having already aggregated data like total vaccinations, people vaccinated, people fully vaccinated, total vaccinations per 100, people vaccinated per 100 and people fully vaccinated per 100. By taking the maximum value we obtain the data corresponding to the last date updated since these values are to see an increase rather than the other way around.
Also, the vaccines column has more than one vaccine for each country based on its availability those countries. I have split the vaccines columns and four new columns were created. The first available vaccine is taken into consideration as column vaccine one.
Now coming to the visualizations part I have created the first report taking into account all the countries in the world, secondly I have taken only India into account and finally I have made a report of the countries which are lagging behind in the vaccination process.
World Report
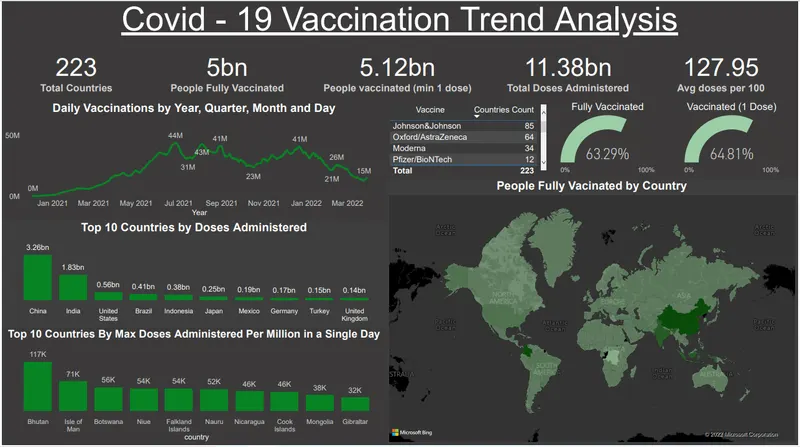
The card visualization has been used to show different numeric values like total countries, vaccination details and number of people vaccinated
- In this we can see that the dataset contains information about 223 countries in total.
- About five billion people in the world have been fully vaccinated which is around 63.29% of the world population.
- About 5.12 billion people have received at least one dose of the vaccine which around 64.81 % of the world population.
- Total of 11.4 billion doses of vaccine has been administered around the world.
- An average of 127.95 doses for every 100 people has been given which means that around 28 people have received more than one dose.
A line graph is used to represent to daily vaccinations versus the date of the record.
- We can see a gradual increase in the daily vaccinations from February 2021 and a peak of 44 million vaccinations can be seen on a particular day in Jul 2021.
- The graph has seen variations in further months where it has dropped to 23 million doses in a day and again seen a raise of 41 million doses. Still around 15 million doses were administered at the end of March 2022.
Bar graphs have been plotted to show the top 10 countries based on the number of doses administered and maximum doses administered in a single day.
- The countries with the max population i.e., China and India are at the top for having the most vaccinations of 3.26 billion and 1.83 billion respectively.
- Bhutan is the country which has achieved the benchmark of giving 117k doses of vaccine per million of its population
A table showing the different vaccines and the number of countries that they are available in is shown in the report
- Two gauge visualizations are used to show the percentage of population vaccinated either partially or fully.
- A map visualization is also shown which gives the population fully vaccinated in different countries and are differentiated based on the color gradient.
Indian Report
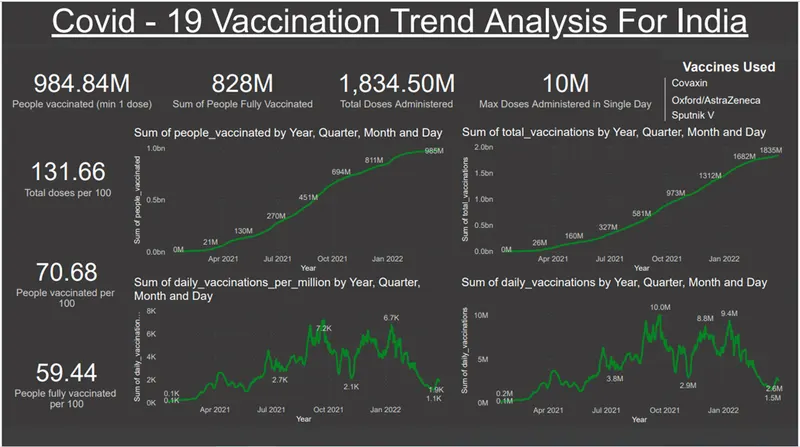
In this report line chart and card visual are used for showing various details.
- A population of 984.84 million has been vaccinated at least once, which accounts to more than 70 % and is higher than the world average.
- About 828 million people have been fully vaccinated which accounts to more than 59% of its population but falls short a few percent when compared to the world average.
- About 131.66 doses per 100 people have been provided meaning around 32 people have received the secondary dosage of the vaccine.
- Covaxin was the Indian origin vaccine used as the primary vaccination and other vaccines like Sputnik V and Oxford were also available in the later stages.
- The various line graph shows the trend of the vaccination based on the timeline and the peak vaccination was during October 2021 when India was able to administer 10 million doses in a single day.
Poorly vaccinated countries
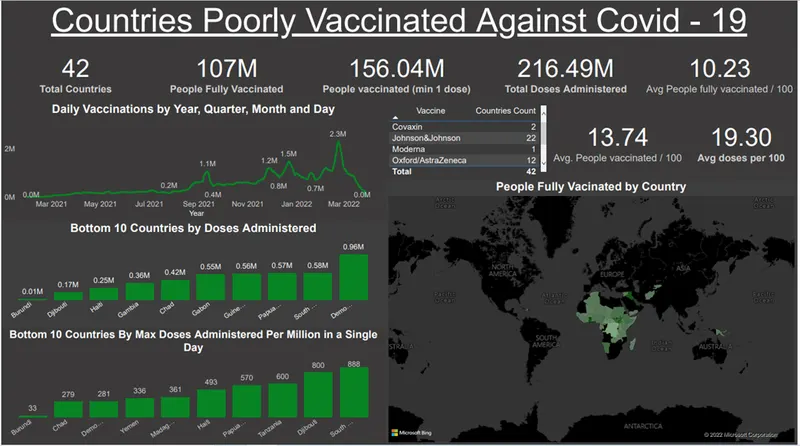
We have considered the third report by filtering out the countries where 20 out of 100 people have been fully vaccinated and 30 out of 100 people have received one dose of vaccination.
- We can see that 42 countries of the world have not been able to provide vaccination to its people in an effective manner due to various factors.
- A combine total of only 107 million people have been fully vaccinated and only 156 million people have received one dose of the vaccine.
- An average of 10 out of 100 have been fully vaccinated, 14 out of 100 have been vaccinated once and only 19 doses per 100 have been provided.
- The majority of the countries that are lagging in vaccination belong to the African continent.
- Countries like Syria, Iraq and Afghanistan which have suffered due to constant acts of terrorism are also lagging behind.
- Burundi is an African Country to have least vaccination in the world.
Insights
- More than half of the world has been successfully vaccinated against corona virus and brings a big relief.
- The most used vaccines around the world are Johnson and Johnson, Pfizer, Oxford and Moderna.
- China and India are leading in vaccinating their vast population followed by USA.
- Economically weak countries are too far behind in the vaccination trend.
Recommendations
- The developed and economically strong countries should help out the under developed and developing countries to improve the vaccination of the people.
- At least 90% of the population should be vaccinated at least once to avoid further problems.
Conclusion
- The world is out of any serious threat due to Covid 19 and is able to return to its normal state due to the proper administration of the vaccines.
- Big countries like China, India, and USA still have a role to play and help out the African countries.