Project 1 - COVID-19 Vaccinations Trend Analysis
Aim:
The aim of this project is to analyze vaccination data and derive meaningful insights to aid decision-making and public health strategies.
Introduction:
The global response to the COVID-19 pandemic has been characterized by unprecedented efforts in vaccine development and distribution. Vaccination campaigns have played a pivotal role in mitigating the impact of the virus, protecting individuals, and control the spread of the disease. This project aims to comprehensively analyze vaccination data from various countries, providing insights that can inform public health strategies, policy decisions, and future pandemic preparedness.
Problem Statement:
The vaccination landscape faces critical challenges that necessitate focused analysis and strategic solutions. Real-time monitoring and adaptive strategies are essential for responding to changing circumstances and emerging variants effectively. Extracting actionable insights from complex datasets is vital to optimizing vaccination programs. This project aims to address these issues by conducting a comprehensive analysis of vaccination data, providing valuable insights to guide informed decision-making and enhance the efficiency of global vaccination efforts.
Methodology:
The methodology involves thorough data collection from diverse sources, enclose daily and cumulative vaccination figures. Preprocessing steps include data cleaning and normalization for consistency. Advanced analytics tools are employed to extract key metrics, such as daily vaccinations, fully vaccinated individuals, and yearly trends. Power BI is utilized for dynamic visualization, to interact with and derive actionable insights from the data. This structured approach ensures a robust analysis, allowing us to uncover Complex patterns, regional dynamics, and vaccination effectiveness, ultimately contributing to evidence-based decision-making.
Analysis:
The dataset contains the following columns
1. Country – The name of the countries.
2. ISO Code – Code for the countries.
3. Date – The date, month and year of the data collected.
4. Total vaccinations – The total number of vaccinations is the sum of the doses given upto date.
5. People vaccinated – The total number of people who received at least one dose of vaccine. This is also an aggregated column meaning it is the sum of total of the previous day to the vaccinations of the present day.
6. People fully vaccinated – The aggregated value of people who received the desired number of doses.
7. Daily Vaccinations Raw – gives the raw data collected on vaccinations
8. Daily vaccinations – The vaccinations administered on any particular day
9. Total vaccinations per Hundred – The total vaccinations per Hundred people which also an aggregated data
10. People vaccinated per Hundred – The number of people who received at least one dose of vaccine, taking into account for every Hundred people.
11. People fully vaccinated per Hundred – For every Hundred people how many are fully vaccinated.
12. Daily vaccinations per million – gives the number of vaccinations administered for every million population on any particular day.
13. Vaccines – gives the different vaccines and their manufacturers separated by commas.
14. Source name – gives the name of the source from which data is provided.
15. Source website – gives the website link from where the data was obtained.
1.The card visualization has been used to show different numeric values like total countries, vaccination details and number of people vaccinated.
· In this we can see that there are 223 countries available in the given data set
· Total Vaccinations available is more than 2 trillion.
· There are 549 billion Fully vaccinated people all over the world.
· There are 731 billion vaccinated atleast once.

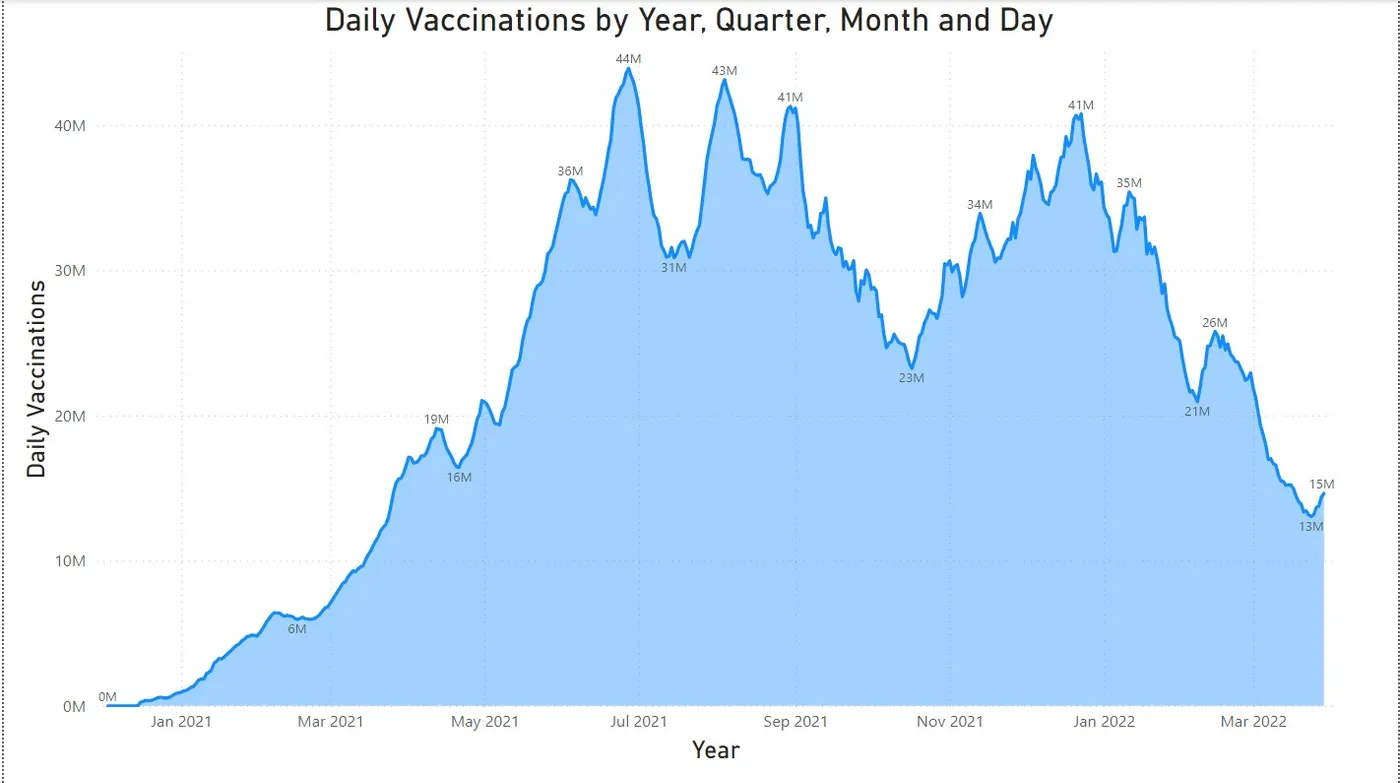
2.In this line graph we can see the daily vaccinations date based on date.
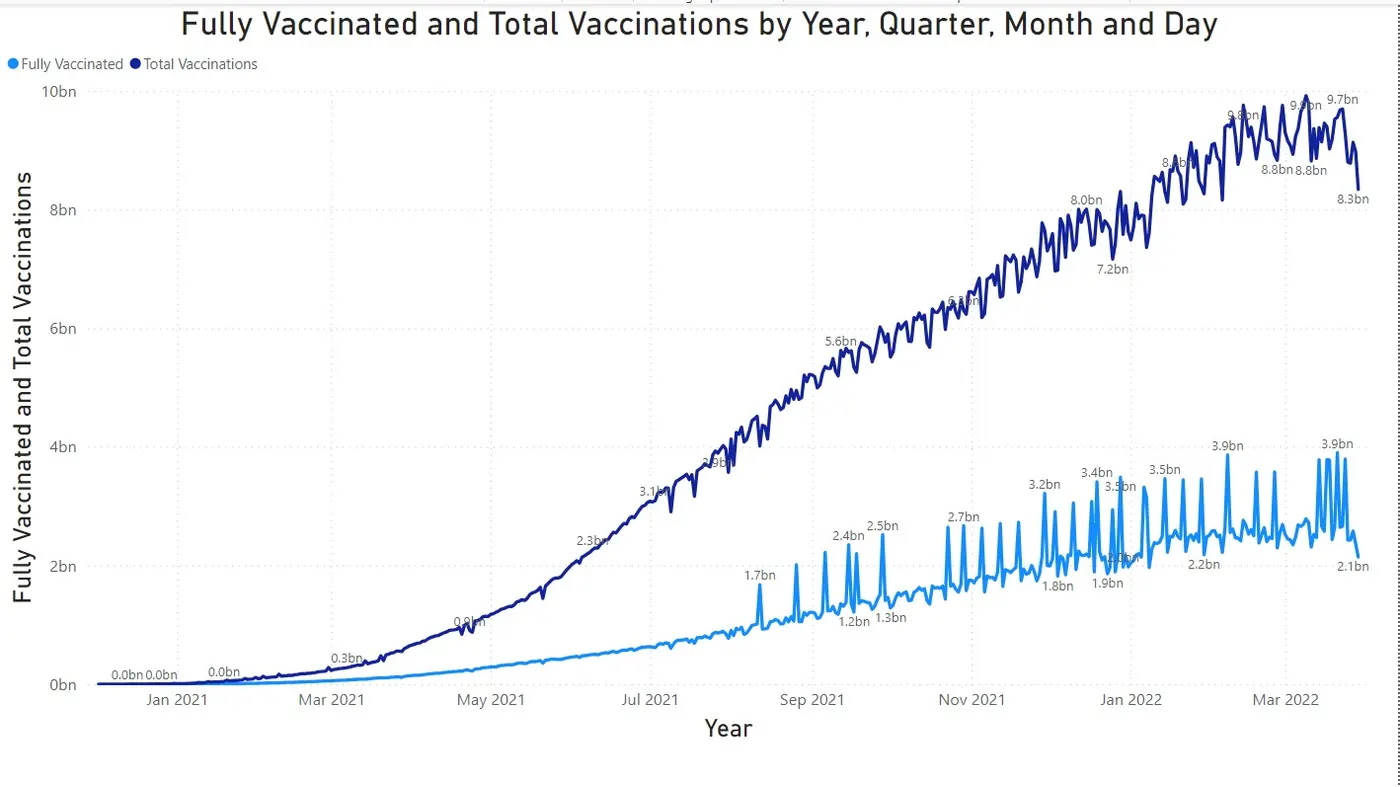
3.In this line graph we can see the Fully vaccinated and total vaccinations based on date.
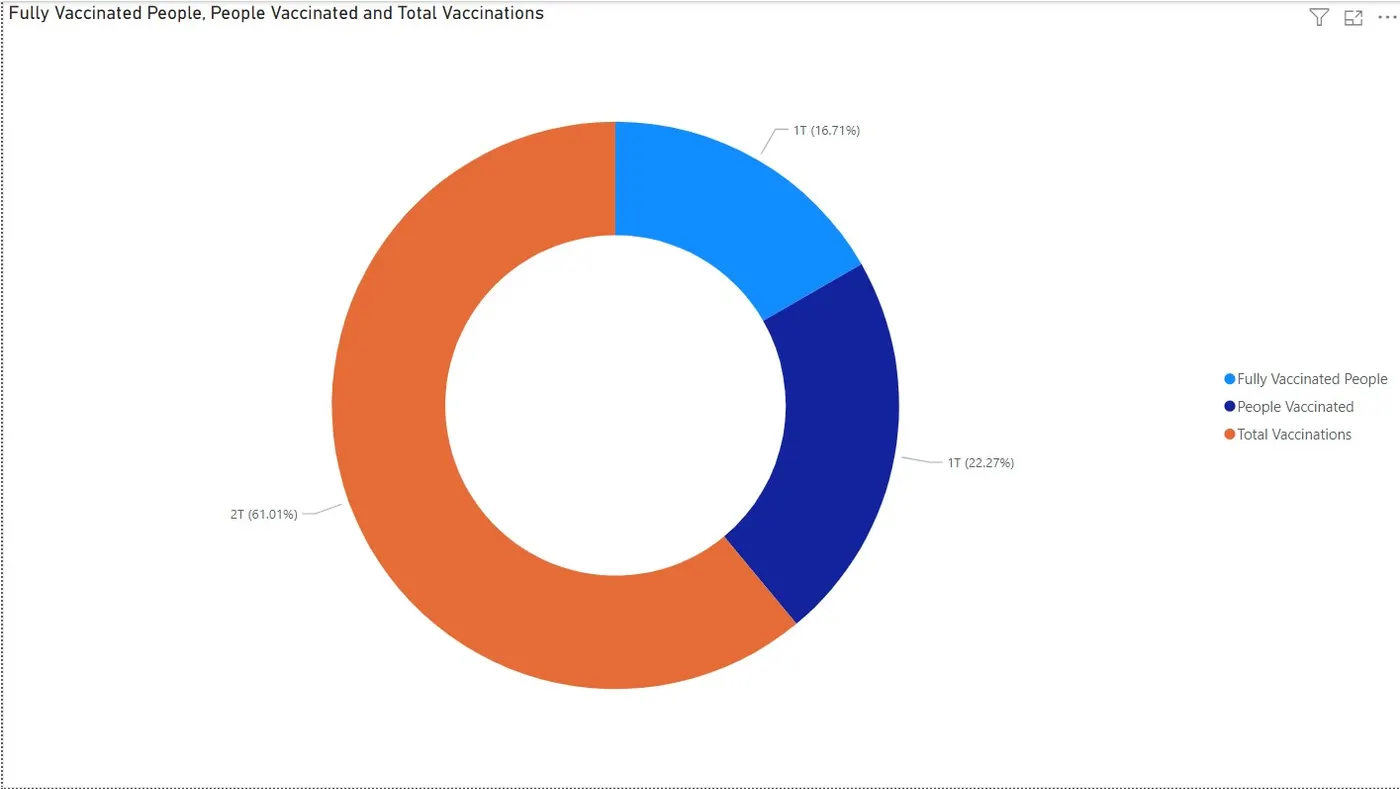
4.A donut chart has been plotted to represent the Fully Vaccinated People, People Vaccinated and Total Vaccinations
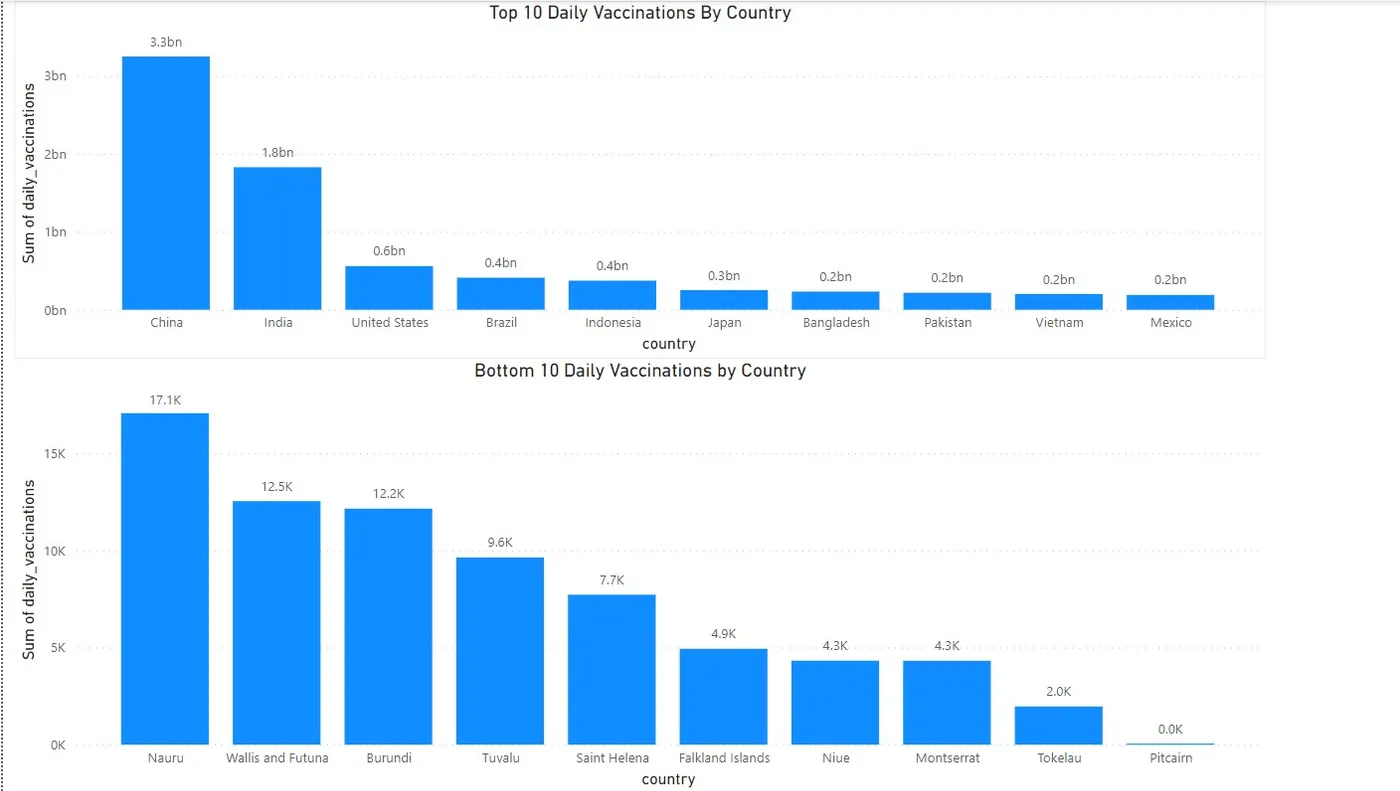
5.Through this Column charts analysis the top 10 & bottom 10 Daily vaccinations by countries
6.Through this Column charts analysis the top 10 & bottom 10 Countries with Fully Vaccinated People.
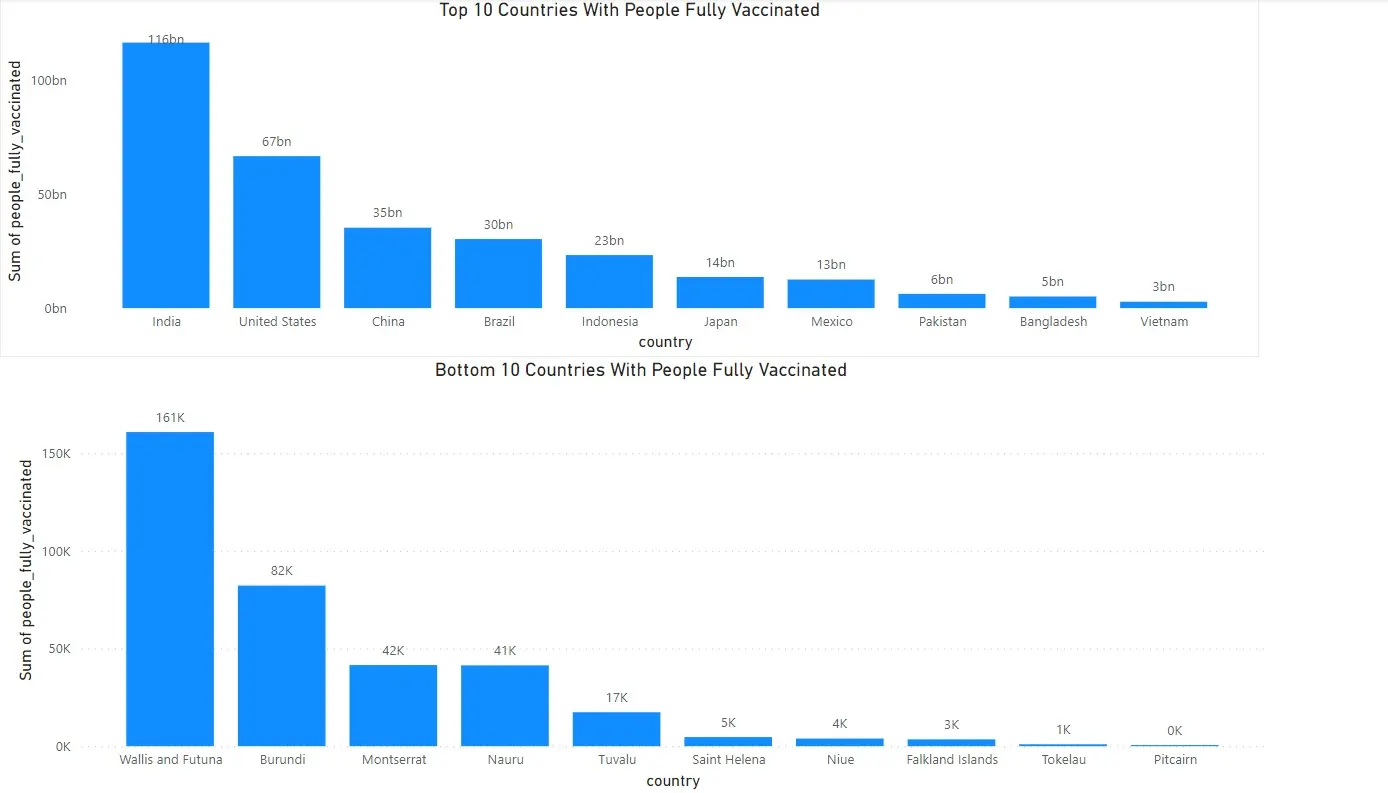
7.The Dashboard gives some of the Covid-19 Vaccination Trend Analysis
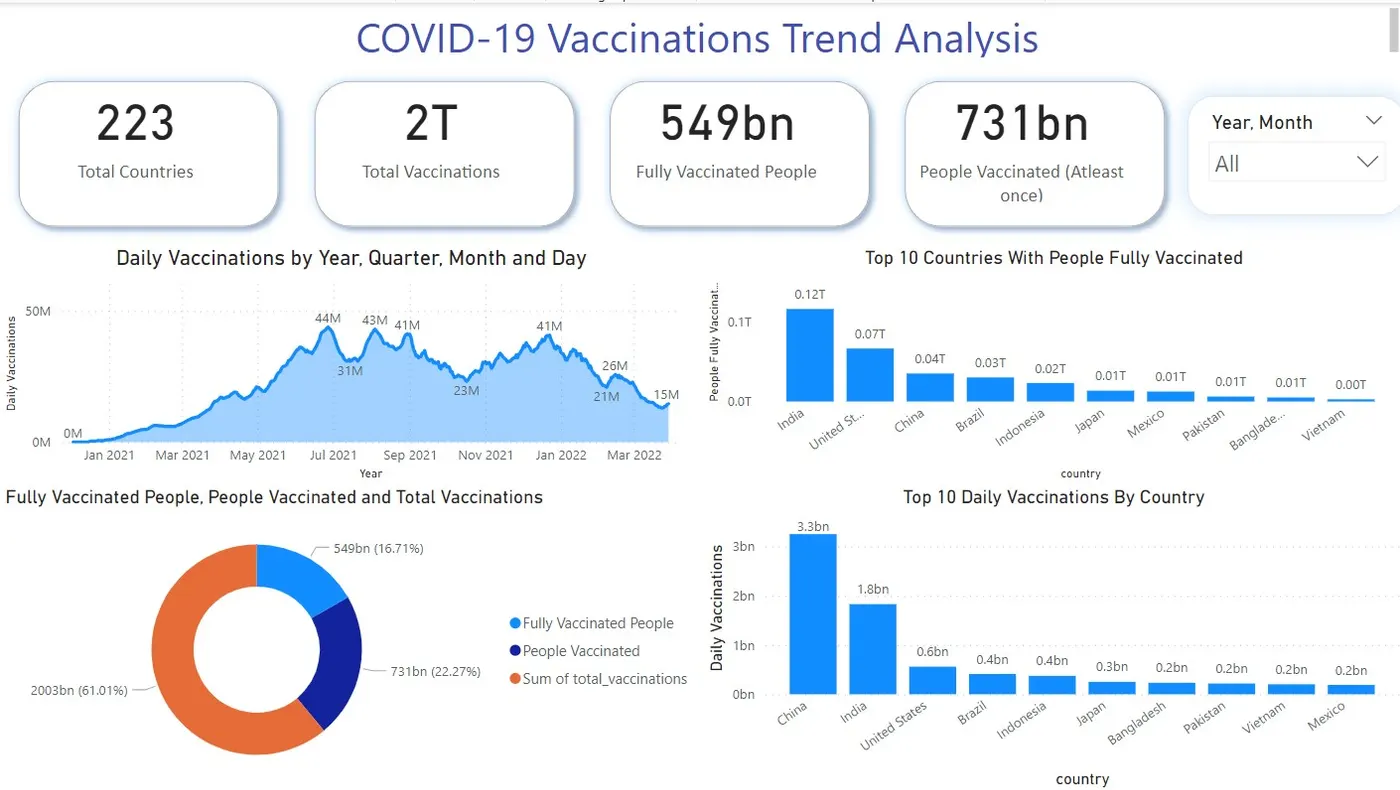
Insights:
· The significant increase in daily vaccinations from 2020 to 2021 underscores the global commitment and scale of efforts in response to the COVID-19 pandemic.
· Discrepancies in fully vaccinated numbers among different countries highlight existing regional disparities in vaccination coverage, indicating the need for targeted interventions.
· The peak in daily vaccinations in 2021 followed by a decrease in 2022 suggests a potential stabilization phase, where vaccination campaigns may have achieved specific goals or encountered challenges.
· Countries like China, the United States, and India exhibit high numbers of fully vaccinated individuals, indicating effective vaccination campaigns and significant progress in achieving widespread immunity.
· Smaller territories like Pitcairn and Tokelau show lower fully vaccinated numbers, reflecting potential challenges in reaching and vaccinating populations in these areas.
Recommendations:
· Identify regions facing challenges in vaccination coverage and implement targeted interventions to improve accessibility, address vaccine hesitancy, and ensure equitable distribution.
· Establish dynamic strategies that can adapt to evolving circumstances, including emerging variants, changes in public sentiment, and fluctuations in vaccine supply.
· Develop international collaboration to optimize resource allocation and ensure efficient distribution of vaccines, taking into account the varying needs and challenges faced by different countries.
· Develop and implement communication strategies that help public in vaccination programs.
· Support ongoing research and development initiatives to address emerging challenges, such as the development of vaccines for new variants and advancements in vaccine technology.