Project 1 - COVID-19 Vaccinations Trend Analysis
Project 1 - COVID-19 Vaccinations Trend Analysis
By Mohit Bhupendra Jambhale
Aim:
The aim of this project is to analyse the trend of COVID-19 vaccinations and to determine the effectiveness of the vaccines based on different countries and year and also the fully vaccinated people by country in 2021-2022.
Introduction:
The COVID- 19 pandemic has had a wide- reaching impact on the world, and it has been necessary for governments around the world to take steps to mitigate the spread of the virus. Vaccination is one of the most effective ways to control the virus and has been implemented in many countries. In this project, we will analyse the trends of vaccination in different countries and to determine the effectiveness of the vaccine. By examining data, it shows total vaccinated peoples, daily vaccinated people’s details and also shows a website detail. Through the analysis of data, we can find the total vaccinated details.
Problem Statement:
The COVID-19 pandemic has created an urgent need for a comprehensive analysis of vaccination trends to aid in the effective management of the vaccination campaigns. However, there is a lack of readily accessible and user-friendly tools to analyse and visualize COVID-19 vaccination data. This poses a significant challenge for policymakers, public health agencies, and researchers who require actionable insights to monitor the progress, identify bottlenecks, and make informed decisions regarding vaccination strategies.
To address this problem, the project aims to leverage Power BI, a powerful data visualization and analysis tool, to develop an interactive and intuitive platform for COVID-19 Vaccinations Trend Analysis. This platform will provide a centralized hub for collecting, analysing, and visualizing vaccination data, allowing stakeholders to gain valuable insights into the vaccination campaign's progress and impact.
We need to find the answers for
- What are the 10 countries in terms of total vaccinations?
- What are the 10 countries with lowest total vaccinations rates?
- What are the most commonly used vaccines across countries?
- What are the top 10 countries in terms of daily vaccinations?
Methodology:
We will Use Power BI Tool For Data Visualizations in which we will going to use a data provided by Skill Lync name “Country_vaccinations.csv” and will generate meaningful insights.
Import Data
- Let’s start with the Get Data option under the Home As this is a CSV file, select the Text/CSV option from the drop-down list
- Select the file named csv
- After selecting the file, data will be displayed in the below format.
- Click on Load and save data.
Data Cleaning
After importing, it is obvious to go for the data cleaning process.
- Click on Transform Data under the Home tab and go to Power Query Editor.
- In Power Query Editor,go to the View tab, enable Column Distribution, Column Quality and Column Profile.
- It will help you to find out missing values, any data errors, any data type mismatch, any outliers
- Based on the above findings, you can take appropriate actions.
- For example, in this data, we have daily vaccinations rawwhich has 90% empty rows that means it has missing Whereas daily vaccinations has less than 1% empty rows. Both columns have the same purpose. So, we can remove daily vaccinations raw.
- Now click on the Close & Apply button and return to the main Power BI Desktop pane.
Create Date Table
- First, create one Date table before proceeding to any calculation.
- Here you will use the DAX function and this date table will help you to do Time Intelligence
- Go to the Modelling tab → Click on the New table
- Write “Date Table = CALENDARAUTO ()” and the automatic date table is now in place.
Create Relationship
Now you have two tables and it’s time to create a relationship between them.
- Click on “Model” from the left side navigation bar.
- Click on the date columnof the country vaccinations table, then drag & drop to the date column of the Date Table.
- A many to one relationship is created.
- Now you are ready to create visualizations. But one thing to remember, based on our visualization requirements, we will create different calculated measures or calculated columns.
Select Theme
- Before proceeding to report, you can select one theme for your project. It will help you choose the proper colour combination. For each theme, there have some suggested colours, however, you can very well select any other colour also.
- Go to View tab -> Under Themes Select Executive ( you can select based on your choice)
- Click on Card visual → Added to the canvas area.
- Select field People Fully Vaccinated
- Click on Format → Go to Data label and Category Label. Change Color, Font family and Text size. Add some background color to it.
- Follow the same process for Total Vaccinations, People Vaccinated and Total Country.
- To derive Total Country → Select the Country column and change to Count (Distinct) from the drop-down.
- Using Format painter, copy the same format for all the Card visuals.
Add Year, Month Slicer
- Add Slicer visual beside the card visuals.
- Add Date Hierarchy → Keep only Year and Month.
- Normally people are interested to know how the vaccine process is going month on month.
Create Line Graph “People Vaccinated by Date”
- Add Line Chart to the canvas area.
- Add Date in Axis and People Vaccinated in Values. As it is a trend analysis (based on date, that’s why it is called trend), it is preferable to use a line graph to show how data varies over time.
Create Clustered Column Chart “Top 10 Country by People Fully Vaccinated”
- Add Bar Chart to the canvas area.
- Add Country in Axis andPeople Fully Vaccinated in Values.
- To display anycomparison analysis, it is preferable to use a clustered column chart.
- In the Filters section, select Top N filter type from Country, add show items 10 and By value People Fully Vaccinated.
Create Clustered Bar Chart “Top 10 Country by Daily Vaccinations”
- Add Bar Chart to the canvas area.
- Add Country in Axis and Daily Vaccinations in Values.
- As it is also a comparison analysis, so you can use a bar This time I am using Clustered Bar Chart.
- In the Filters section, select Top N filter type from Country, add show items 10and by value Daily Vaccinations.
Create Map Visual “Total Vaccinations by Country”
- Add Map visual to the canvas area.
- Add Country in Location and Total Vaccinations in Size.
- In this analysis, you want to get some idea overall vaccinations process across all countries.
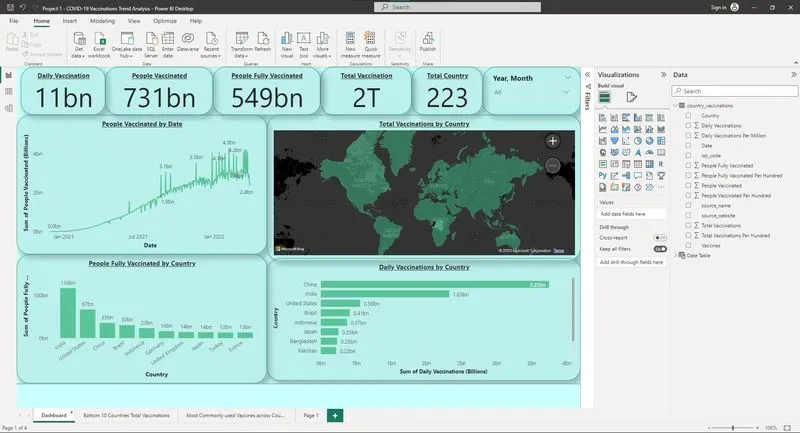
Analysis (Data sheets pertaining to it):
In observation found some interesting points that are mentioned below.
- All Report Page Created
- According to data on people fully vaccinated in the year.
- The dataset available is from 2020,2021,2022.
- Total vaccination by the country in map visualization.
- Total Highest Top 10 Country Daily vaccination
- Total Highest Top 10 Country People Fully Vaccinated
- Total Highest Daily vaccination is 3.25Bn in China.
- Sum Of Total Vaccinations is 2T
- Sum Of People Fully Vaccinated is 549Bn
Insights:
- Country Rankings for Fully Vaccinated Population:
Based on the bar chart analysis, India emerges as the leading country with the highest number of fully vaccinated individuals. The United States follows in the second position, while China secures the third position. These rankings indicate the relative success of these countries in achieving full vaccination coverage.
- Comparative Performance of Countries:
The bar chart visually demonstrates the comparative performance of countries in terms of fully vaccinated population. India's significant progress in administering vaccinations is evident, positioning it as the frontrunner. The United States also exhibits commendable efforts in vaccinating its population, securing a strong second position. China's vaccination campaign places it among the top three countries for fully vaccinated individuals.
- Daily Vaccination Rankings:
The analysis of daily vaccinations reveals that China currently dominates the first position, followed by India in second place, and the USA in third place. These rankings are derived from the data presented in the bar chart, which visually represents the daily vaccination numbers for these countries. China's consistent high daily vaccination rate has contributed to its leading position, while India and the USA have also made notable progress in their vaccination efforts.
- Bottom-ranking Countries for Fully Vaccinated Population:
The bar chart indicates the ranking of countries based on their fully vaccinated population. Pitcairn is positioned at the bottom, followed by Tokelau in second-to-last place, and Falkland Islands in third-to-last place. These countries have the lowest percentage of their population fully vaccinated among the countries analysed, indicating lower vaccination rates.
- Most Commonly Used Vaccines:
The donut chart provides an overview of the vaccines used in the countries. Johnson & Johnson, Moderna, Oxford/AstraZeneca, and Pfizer/BioNTech are the vaccines most commonly used. This information gives an idea of the vaccine preferences and usage patterns among the analysed countries.
- Vaccination Rate Trends:
The line graph shows the number of people vaccinated on a daily basis. The highest rate of vaccination occurred in February 2022, indicating a peak in vaccination efforts during that period. This information helps identify the time frame when vaccination campaigns were most intensive.
Recommendations:
- Further investigate the reasons behind India's success:
Explore the factors contributing to India's leading position in terms of fully vaccinated individuals. Analyze their vaccination strategies, distribution network, and public awareness campaigns to identify best practices that can be implemented in other countries.
- Study the vaccination efforts of the United States:
Examine the successful vaccination campaign of the United States, which secured the second position in terms of fully vaccinated individuals. Understand their vaccination rollout plan, public-private partnerships, and communication strategies to identify key learnings applicable in other regions.
- Assess China's daily vaccination dominance:
Investigate China's consistent top position in daily vaccinations. Understand their vaccination infrastructure, distribution efficiency, and any unique approaches that have contributed to their success. Analyze the feasibility of implementing similar strategies in other countries.
- Focus on countries with low vaccination rates:
Pay attention to countries at the bottom of the ranking in terms of fully vaccinated population, such as Pitcairn, Tokelau, and Falkland Islands. Identify the challenges they face, including supply constraints, hesitancy issues, or logistical difficulties, and provide targeted support and resources to help increase vaccination rates in these regions.
- Explore vaccine distribution patterns:
Analyze the donut chart showcasing the distribution of vaccine types used in different countries. Investigate the reasons behind the dominance of vaccines from Johnson & Johnson, Moderna, Oxford/AstraZeneca, and Pfizer/BioNTech. Assess the availability, effectiveness, and accessibility of these vaccines to determine their impact on vaccination trends.
- Investigate the spike in February 2022:
Analyze the line graph depicting the daily vaccinations and explore the reasons behind the peak in February 2022. Examine any specific events, campaigns, or policy changes during that period that may have influenced the surge in vaccination rates. Identify successful strategies employed during that time and assess their potential for replication in future vaccination drives.
- Monitor and update the analysis regularly:
Keep the analysis up-to-date by collecting the latest data on vaccination rates, new vaccines, and any significant developments in different countries. Continuously refine the analysis methodology to capture relevant insights and ensure the findings remain accurate and relevant.
Conclusions:
- Vaccination Coverage: The analysis reveals that a total of 2,003 billion vaccinations have been administered across 223 countries. Out of these, 731 billion individuals have received at least one dose, while 549 billion individuals have been fully vaccinated.
- Leading Countries: India emerges as the leading country in terms of fully vaccinated individuals, followed by the United States and China. India's significant progress in administering vaccinations is notable, with the United States also demonstrating commendable efforts.
- Daily Vaccinations: China currently holds the first position in terms of daily vaccination numbers, followed by India and the United States. The bar chart visually represents this data, highlighting China's consistent high daily vaccination rate.
- Lowest Vaccination Rates: Pitcairn ranks at the bottom in terms of the percentage of its population that is fully vaccinated. Tokelau and Falkland Islands also exhibit lower vaccination rates compared to other countries.
- Commonly Used Vaccines: The donut chart provides an overview of the vaccines predominantly used in the analysed countries, including Johnson & Johnson, Moderna, Oxford/AstraZeneca, and Pfizer/BioNTech.
- Vaccination Rate by Time: The line graph indicates the daily vaccinations over time. In February 2022, the highest rate of vaccination was recorded, demonstrating a peak in the vaccination efforts during that period.