Project 1 - COVID-19 Vaccinations Trend Analysis
Project 1 - COVID-19 Vaccinations Trend Analysis
AIM: We are going to explore COVID vaccine data and try to find out the inference of how the immunization process is going on worldwide.
Introduction: The global battle against COVID 19 pandemic can be won only if a large part of the world gets vaccinated against the SARS-CoV-2 virus. A considerably low vaccination rate has been observed in low-income countries of the world. We will study the COVID 19 vaccination trends across the world using power bi, and we aim to derive key insights from the data which can help policymakers modify their policies.
Problem Statement:
1.What is the count of total vaccination?
2.What is the count of people fully vaccinated?
3.What is daily vaccination count in each country?
4.What is the count of people vaccinated by date?
5.What are the Bottom 10 Country by People Fully Vaccinated?
Objective/Methodology:
- Data Understanding
*Analysing the data set. This data is mixed type of data that is it includes qualitative and quantitative values. The dataset contains 86486 rows and 15 columns.
- Data Import and Cleaning process
*Import the dataset called country_vaccinations in power bi using Get data option.
*Here , in this dataset we will check for null values, outliers ,duplicate values ,irrelevant values
3.Choose recommended graphs for visualization and know the purpose of those graphs
*For visualization, I used Power Bi tool which is business intelligence and data visualization tool helps in make more data driven decisions. Using various graphs and charts in power bi helps to take insights from data.
Analysis:
1,What is the count of total vaccination?
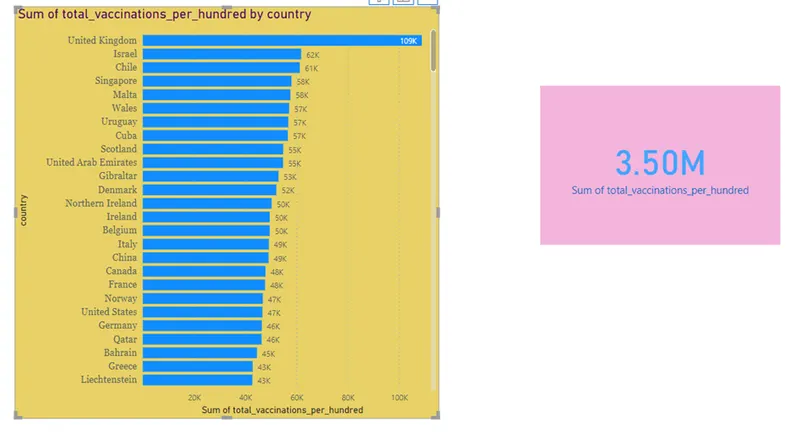
From the above visualization, sum of the total vaccination done in the whole world is 3.50M. Out of which 109k is done in united kingdom, 62k in Israel ,61k in Chile .
2.What is the count of people fully vaccinated?
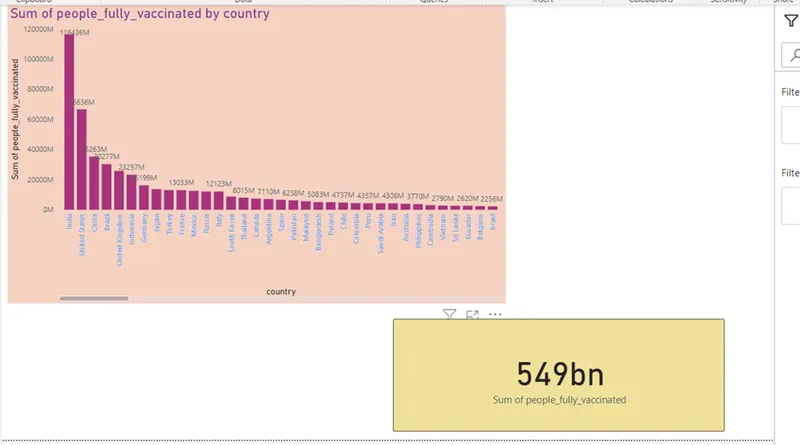
Total 549 bn people fully vaccinated in world out of which India is the highest country having 116 bn fully vaccinated people. United States is on second with 67bn and China on third with 35bn
3.What is daily vaccination count in each country?
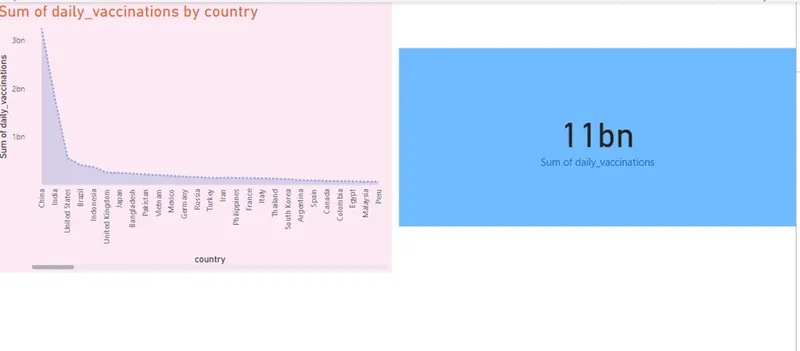
China has 3bn daily vaccinations totally highest among each countries. India has 3bn daily vaccinations totally which is on second and United States on third.
4.What is the count of people vaccinated by date?
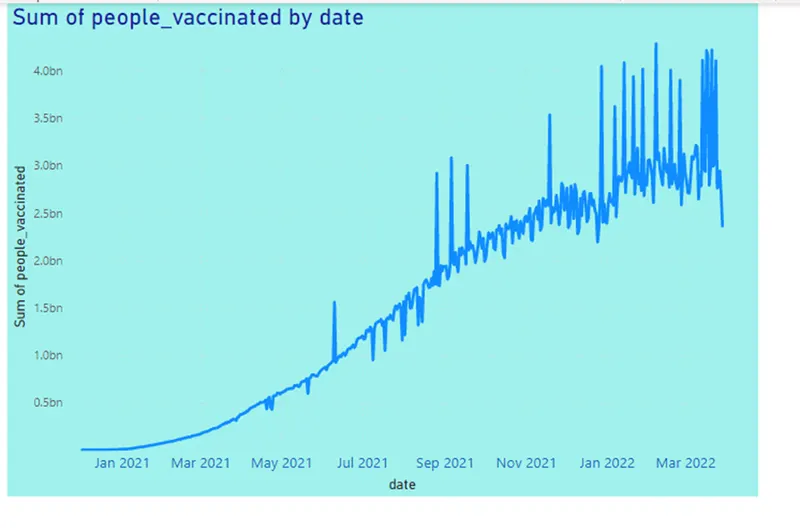
The above visualization shows sum of people vaccinated by date.The range is between Jan 2021 to march 2022. In march 2022 is where the highest count of vaccination happened.
5.What are the Bottom 10 Country by People Fully Vaccinated?
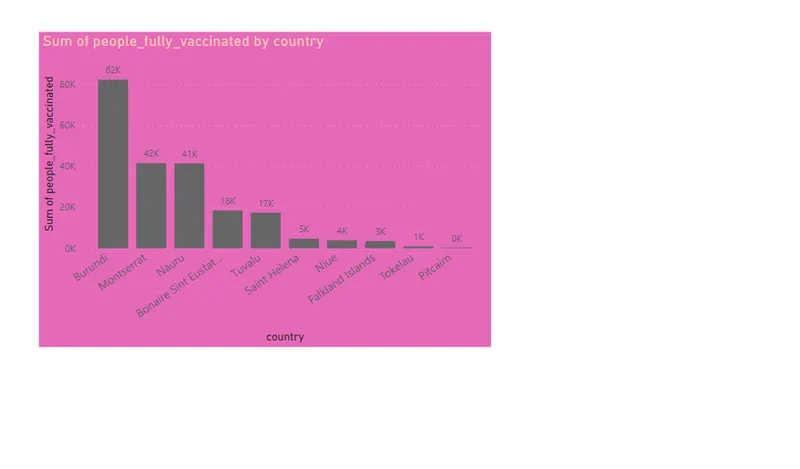
The above visualizations shows the bottom 10 countries where people got fully vaccinated.
Burundi has 82k people fully vaccinated followed by Montserrat 42k
Insights:
- Sum of the total vaccination done in the whole world is 3.50M. Out of which 109k is done in united kingdom, 62k in Israel ,61k in Chile .
- Total 549 bn people fully vaccinated in world out of which India is the highest country having 116 bn fully vaccinated people. United States is on second with 67bn and China on third with 35bn
- China has 3bn daily vaccinations totally highest among each countries. India has 3bn daily vaccinations totally which is on second and United States on third.
- Sum of people vaccinated by date the range is between Jan 2021 to march 2022. In march 2022 is where the highest count of vaccination happened.
- The bottom 10 countries where people got fully vaccinated.
Burundi has 82k people fully vaccinated followed by Montserrat 42k
Conclusions:
- China is no. 1 in terms of total vaccination given.
- Whereas India has done well compare to other countries in terms of fully vaccination