Project 1 - COVID-19 Vaccinations Trend Analysis
COVID -19 ANALYSIS
AIM:
To analyse the data on Covid-19 and about the vaccination by year and the different country.
Introduction:
The data given is about the covid-19 vaccine, in the csv file format. In that to analyse the people in different countries how they have taken their vaccination and which type of vaccine they are used.
Problem Statement:
- We have out analyse the data about how many people are vaccinated by which year.
- Then what type of vaccine have been used by people and which month the most vaccinations are occurred.
Methodology:
- Data Cleaning:
In data cleaning I cleaned the data with the transform data option present in Power BI because the dataset was not cleaned and included some missing values, so with the help of the duplicates function in Power BI, I cleaned the data and replace the null values with 0 and then started working on it.
- Data Interpretation:
In this data interpretation step, I found out some important information about the data set.
- The data set was almost clear and completed.
- I replaced the null values with 0.
- Data Visualising:
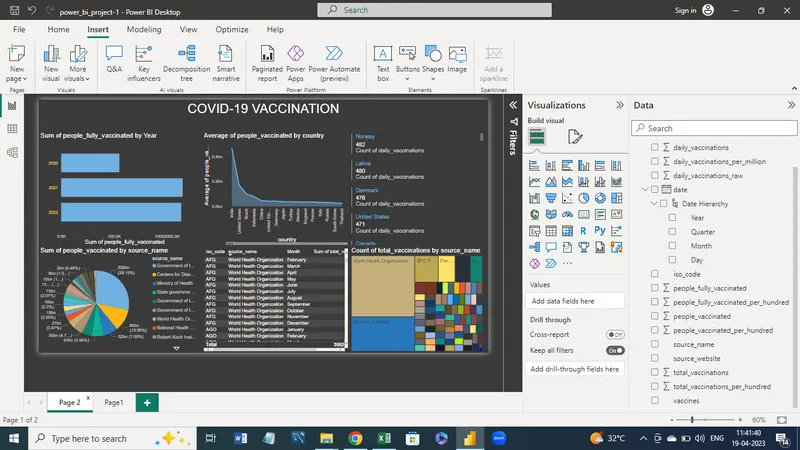
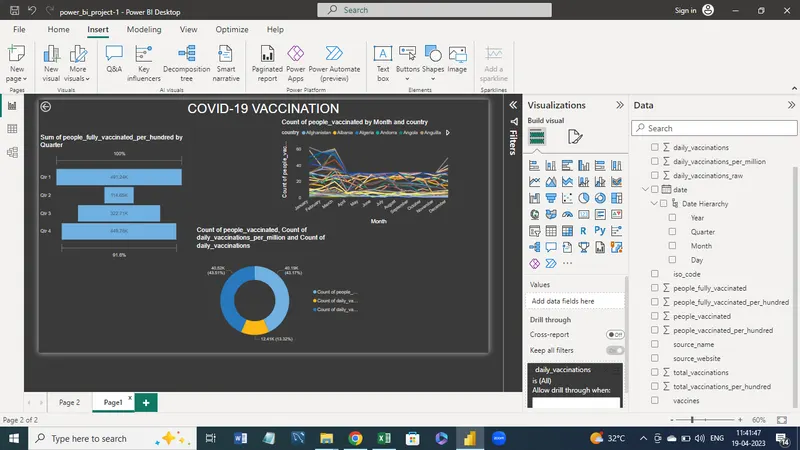
In visualization, I took the help of Power BI Desktop software to make graphs and charts here some relevant graphs and charts are attached in the view.
Analysing:
- People fully vaccinated by year wise and counted the people fully vaccinated.
- Average People vaccinated by every country
- The Count of the Daily vaccinations in each country
- People vaccinated and the type of vaccination they used.
- Month wise how the vaccine and source name of vaccine iso_code used & the total calculation
- Count of vaccine used from different source has been vaccinated
- Quarter year how many people vaccinated among the 100 peoples
- Count of people vaccinated and count of daily vaccinated
- The country maintaining the proper vaccination by every month’s in a year.
Insights:
- The insights of the dataset, that the year 2021 has more vaccination that any other year
- Then the people who are using the different types of vaccination in different countries.
- The India has done more vaccinations than any other country given in the dataset.
Recommendations:
- We can collect good datasets for analysis.
- We can analyse the data of the overall world COVID vaccinations by people.
- Like this dataset we can perform operations with various categories, country-wise
- We can work on large datasets and analyse them with the proper format of the chart.
Conclusion:
In conclusion we can see that, India has completed the vaccinating to the people than any other country. As we can also see that which type of dosage is most used by the people to vaccinate.