Project 1 - COVID-19 Vaccinations Trend Analysis
Drive link: https://drive.google.com/drive/folders/13j6ibbrsr6Befi5jzudsuJvbnNcSrN0k?usp=drive_link
COVID – 19 Vaccinations Trend Analysis
Aim:
This Project mainly aims to find out the trend of the vaccinations around the world for the prevention of the Covid 19 pandemic and how much has been achieved so far.
Introduction:
The COVID 19 pandemic caused due to the Corona virus devastated the world by causing several fatalities around the world. This virus originated in Wuhan, China in 2019 and was later spread throughout the world due to human contact in one way or the other.
Many countries developed their own vaccines and also helped other countries without the resources by providing them with vaccines developed.
The main objective of this project is to analyse the data on, COVID-19 Vaccinations. Through the Analysis of data, we can find out some important insights.
Problem Statement:
We have to analyse the data as the data is very large and they are not cleaned properly so we have do data cleaning and analyse the data and find the vaccination trends and other details.
Methodology:
Data Importing:
In power BI desktop with the help of the get data option import the CSV data which is named as country_vaccinations and clicked load option.
Data Cleaning:
After loading the data and after analysing the data, I understood that there are 86512 rows and 15 columns and in that some of the columns contained null values so I have replaced the null values by 0 with the use of replace functions and started working on the data.
Visualizations:
In visualization part with the help of power BI desktop software, I have used different kinds of charts, graphs, cards and table to display the data in the format which will be easy to understand.
Analysis:
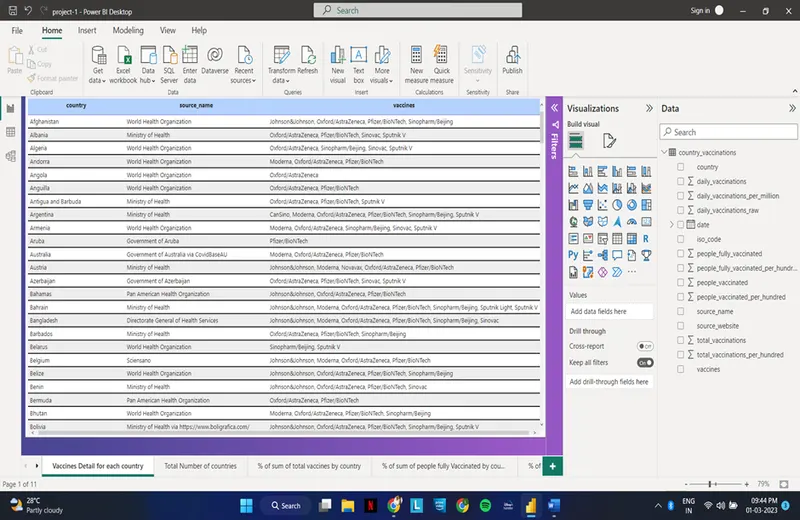
I have first created a table with the Vaccine details for each country with the source name.
In this table we can find the vaccine used by an specific country and also the details of the source.
Then I created a card which shows the total number of countries in the dataset along with the country names displayed in a table.

Then I have created an clustered column chart to find the highest percentage of the total vaccination in a country.
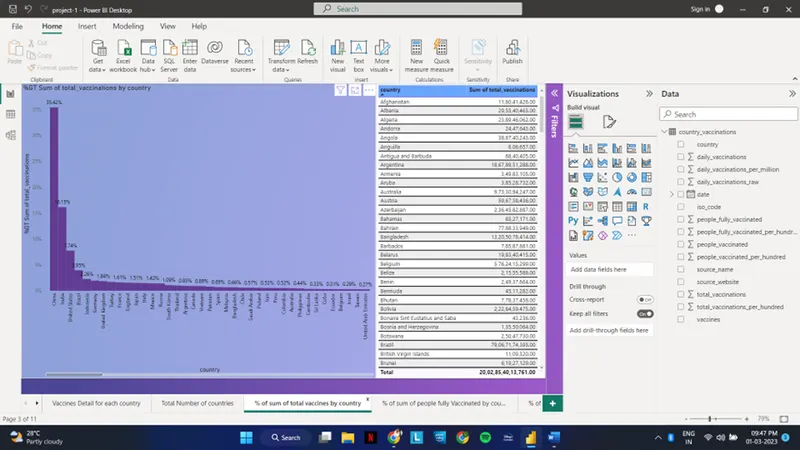
With reference to the chart in the above image we can see that China is the highest in total vaccination with 35.42% and India in second highest with 16.15%
Then I created another clustered column chart to find the people who are fully vaccinated.
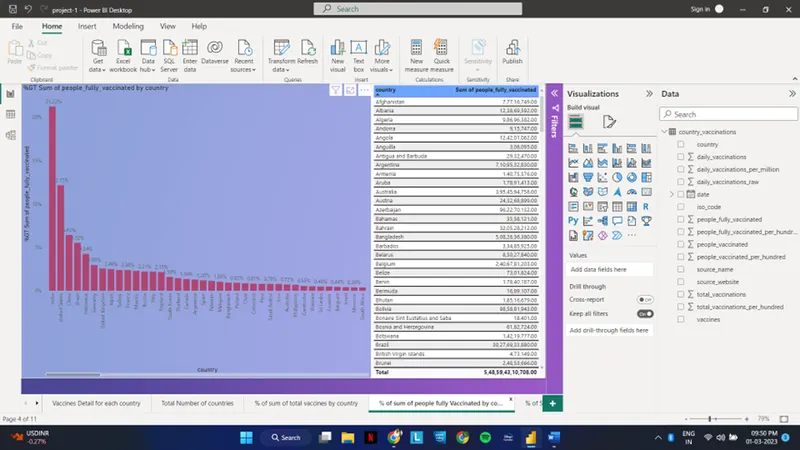
With reference to the chart in the above image we see that India is in highest with 21.22% with people who have been fully vaccinated.
Then created another clustered column chart with the data in people vaccinated column with respect to each country.
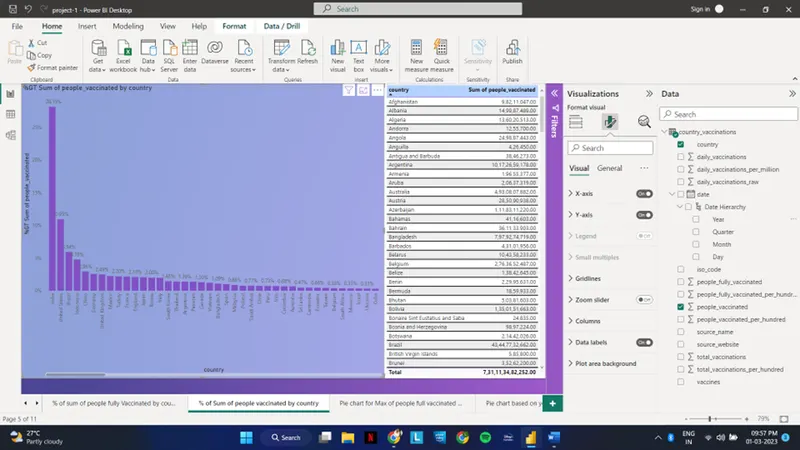
With reference to the chart in the above image India hold the highest in people who are vaccinated and United states holds the second highest.
Then I have created the pie chart to find the highest country with maximum daily vaccinations, maximum of people fully vaccinated and also created an report with pie chart for both maximum of daily vaccination and people fully vaccinated based on the year.
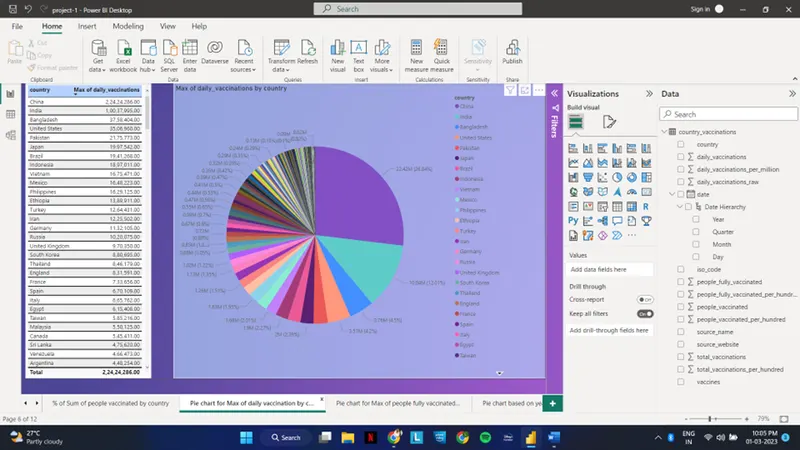
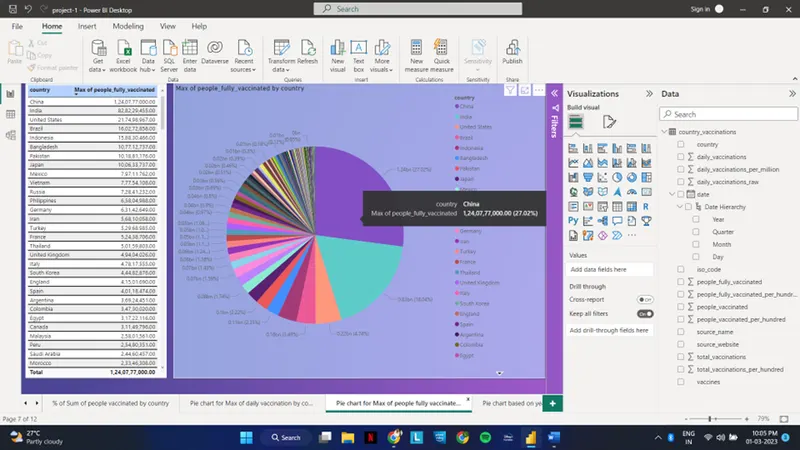
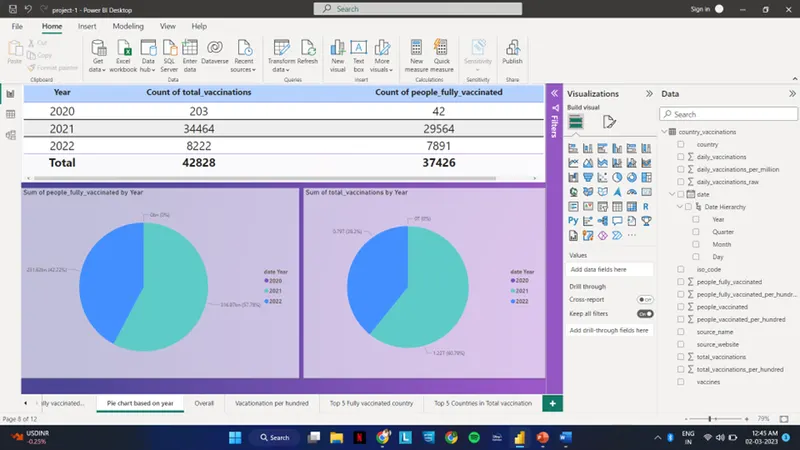
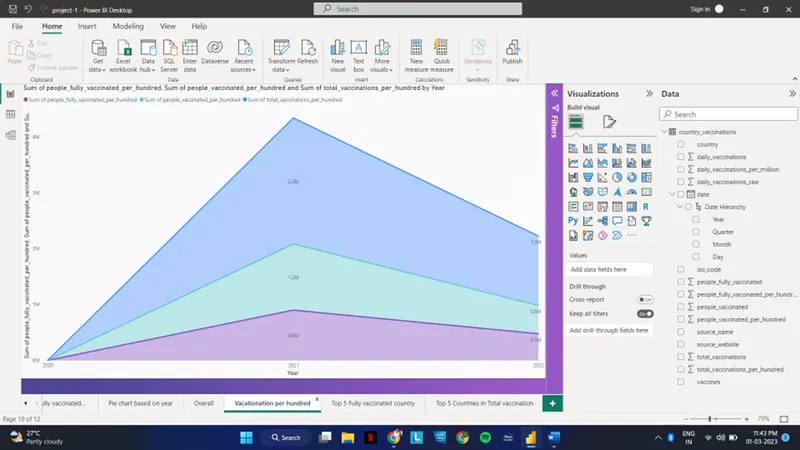
From the below images we have analysed the daily vaccinations per million, people who have fully vaccinated per hundred, total vaccinations per hundred, people who have vaccinated per hundred.

From the below image we came to know about people who have vaccinated per hundred, people who have fully vaccinated per hundred, total vaccinated per hundred and we came. to know about that 2021 was the peak year in all the 3 cases.
I have created a chart to display the top 5 countries where people are fully vaccinated.

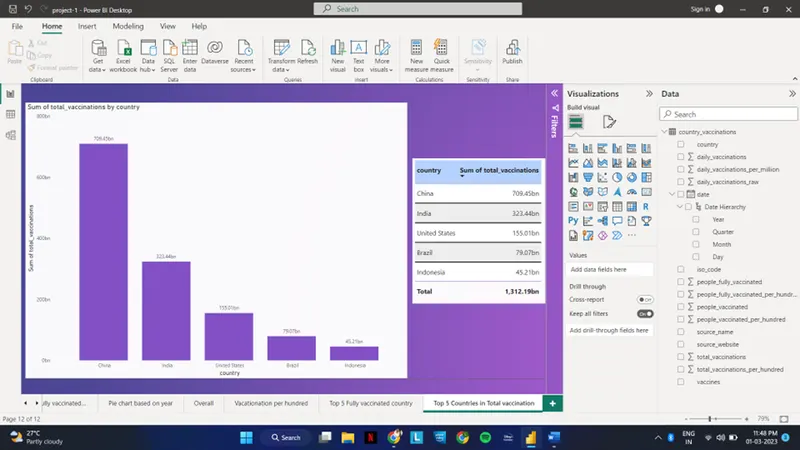
Also created a chart to display the top 5 countries which had the total vaccination.
Insights:
From the above Visualizations we got the insights mentioned below:
- China is the no : 1 in Total vaccination at present
- There are 223 Countries participated in Vaccination.
- IN 2021 Total Vaccination is 60.79% completed.
- In 2022 Total Vaccination is 39.2% is completed.
- India, United States, China, Brazil, Indonesia are the top 5 countries respectively which has people who have completed the full vaccination process.
- China, India, United States, Brazil, Indonesia are the top 5 countries respectively which has the total vaccination.
Recommendations:
We should collect day to day reports and we should update our records daily to get more accurate details.
So that we can move forward with more vaccination to the right country which needs the most. Like this dataset, we can perform operations with various categories, city-wise, or Region wise.
Conclusion:
With the dataset, we have analysed and came to an conclusion that China and India in these two countries where most of the people are Vaccinated.
In this dataset we came to know that the vaccination process in every country was going in good pace that indicates we can have control of this disease very soon all over the world.