Project 1 - COVID-19 Vaccinations Trend Analysis
COVID-19 Vaccination Trend Analysis
Submitted by – Shubham Sharma
TABLE OF CONTENT
- AIM
- INTRODUCTION
- PROBLEM STATEMENT
- METHODOLOGY
- ANALYSIS (PREPARING SHEETS)
- INSIGHT
- RECOMMENDATION
- CONCLUSION
- AIM
Aim of this project is to analyse the trend of vaccinations for Covid-19 in the world. Main aim of our report is to analyse the different vaccinations scenario like daily vaccinations, fully vaccinations, total people who vaccinated at least one dose. The project aims to convey the analysis of different ongoing vaccination programs around the globe.
- INTRODUCTION
The Covid-19 pandemic is the most crucial health disaster that has surrounded the world for the past year. As this virus was new to the world and there was no vaccine or cure to it at the initial period there were several deaths around the world. The countries around the world were forced to shut themselves to others in order to avoid the further spread of the virus and people were stuck inside their houses and faced many issues with their finances, mental health etc., and felt like animals in a cage. An effort was made to find a cure or vaccine by several health organizations to bring a stop to this pandemic.
Predicting the COVID-19 vaccination trend has become a challenging issue. Many health professionals, statisticians, researchers, and programmers have been tracking the spread of the virus in different regions of the world using various approaches. The rise in various vaccines developed by talented scientists spurred curiosity about learning more about vaccine programs.
In later stages of 2020 several experimental vaccines were developed and administered to humans. The efforts were successful as the vaccines were helpful in reducing the affects the virus and even if people were infected, they were not in any life threatening situation and escaped the illness having only minor symptoms.
Many countries later developed their own vaccines and also helped other countries without the resources by providing them with vaccines developed.
- PROBLEM STATEMENT
In the project, we are going to analyze the trend of vaccination in the globe with the help of some visualization tools like line graph, tree map, bar graph donut chart etc. which help us to make the proper analysis. The project will analyze the data related to the number of vaccinations given to people’s daily, total vaccinations by each year, how many people are fully vaccinated based on country, the population which has received at least one dose of the vaccine and the different vaccines used and their availability to different countries.
- METHODOLOGY
Before Analysis we need to prepare the dataset so we can analyse the data and can make some useful insights from the data. Here are some steps
Data Exploration:
Data exploration is the first step of data analysis and it is used to explore and visualized data to take any necessary actions.
Data Cleaning:
After importing the date we need to clean the data for better results. To open the Power Query Editor by clicking on Transform Data under the Home tab.
In Power Query Editor, go to the View tab, enable Column Distribution, Column Quality and Column Profile. It will help you to find out missing values, any data errors, any data type mismatch, any outliers.
Data Visualization:
For visualization we use Power BI, It is a powerful as well as a flexible tool for connecting with and analyzing a wide variety of data.
- ANALYSIS (PREPARING SHEETS)-
The dataset contains the following columns
- Country – The name of the countries (223 Countries in total)
- ISO Code – Code initials for the countries
- Date – The date, month and year of the data collected
- Total vaccinations – The total number of vaccinations administered which is nothing but the sum of the doses given on any particular date to the total vaccinations of the previous day.
- People vaccinated – The total number of people who received at least one dose of vaccine. This is also an aggregated column meaning it is the sum of total of the previous day to the vaccinations of the present day.
- People fully vaccinated – The aggregated value of people who received the desired number of doses (min 2 doses and 1 booster dose may or may not be included).
- Daily Vaccinations Raw – gives the raw data collected on vaccinations
- Daily vaccinations – The vaccinations administered on any particular day
- Total vaccinations per 100 – The total vaccinations administered per 100 people which also an aggregated data
- People vaccinated per 100 – The number of people who received at least one dose of vaccine, taking into account for every 100 people
- People fully vaccinated per 100 – For every 100 people how many are fully vaccinated (received min 2 doses)
- Daily vaccinations per million – gives the number of vaccinations administered for every million population on any particular day.
- Vaccines – gives the different vaccines and their manufacturers separated by commas.
- Source name – gives the name of the source from which data is provided.
- Source website – gives the website link from where the data was obtained.
Now we know that what the data set contains to analysis the data.
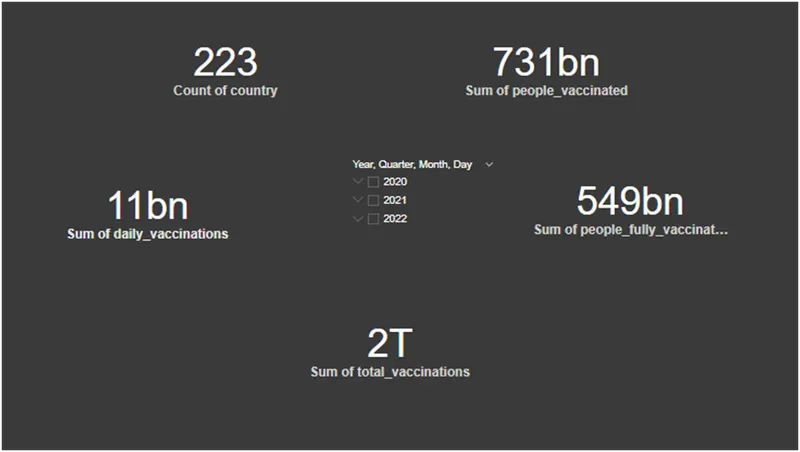
Card visualization is used for showing different numeric data. Here we add slicer also to measure the data by years.
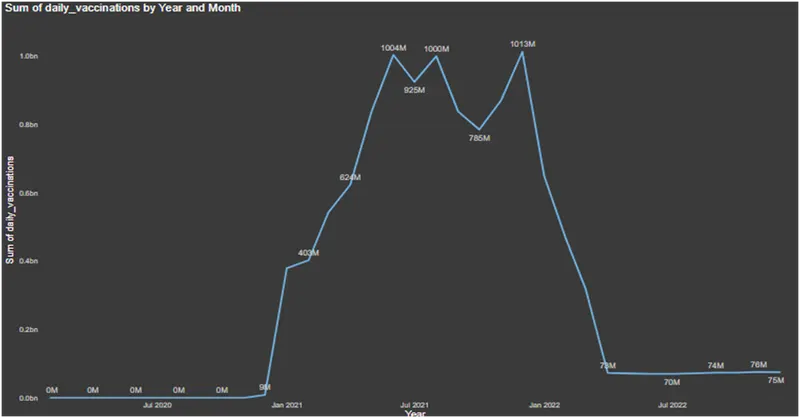
It is a line graph which shows the sum of daily vaccination by year and month. It clearly shows that vaccinations start at the end of 2020. And it increases in 2021 and 2022.
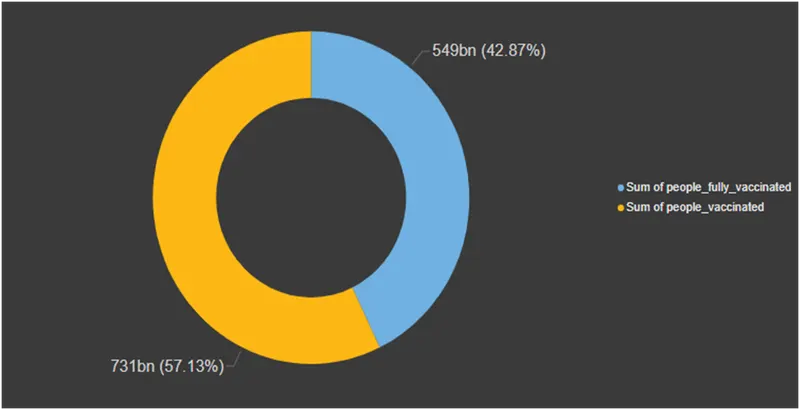
Donut chart shows sum of people fully vaccinated and sum of people at least one time vaccinated
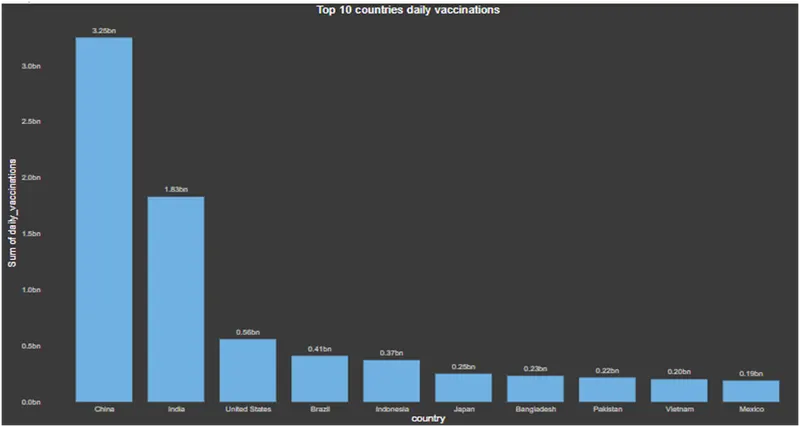
Above bar graph shows top 10 countries which have highest daily vaccinations
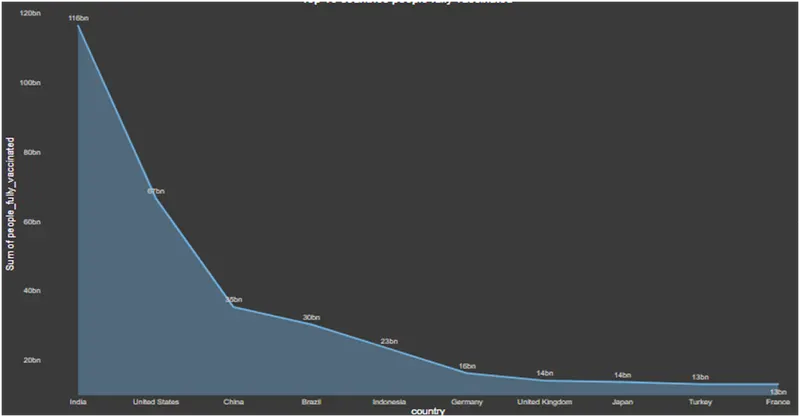
In above area chart there are top 10 countries which have highest fully vaccinated people. In this chart India ranks first.
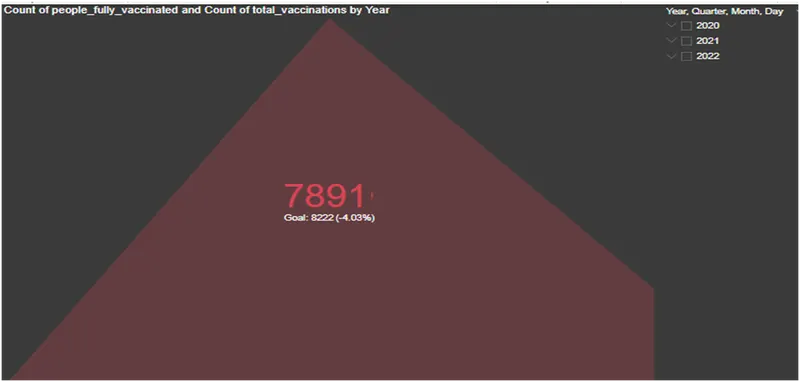
KPI: key performance indicator shows less vaccination from the target. Here we add slicer also so we can compare the kpi by years
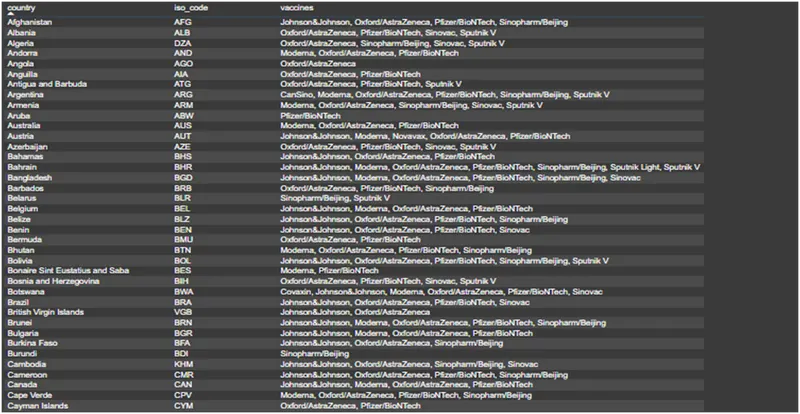
Above table shows the countries and their vaccines with iso code.
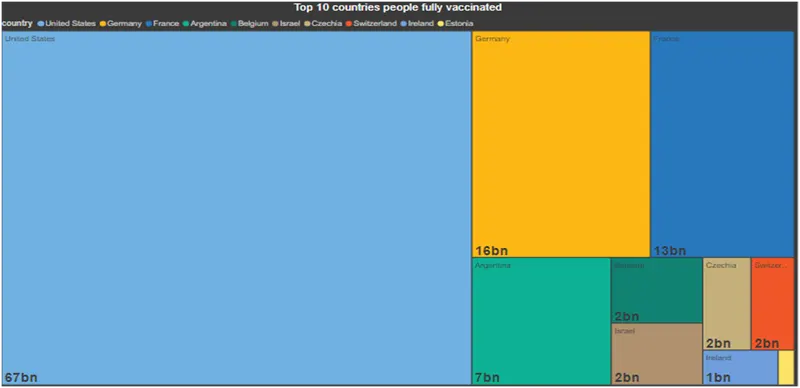
Above tree map clearly shows top 10 countries with full vaccination over population.
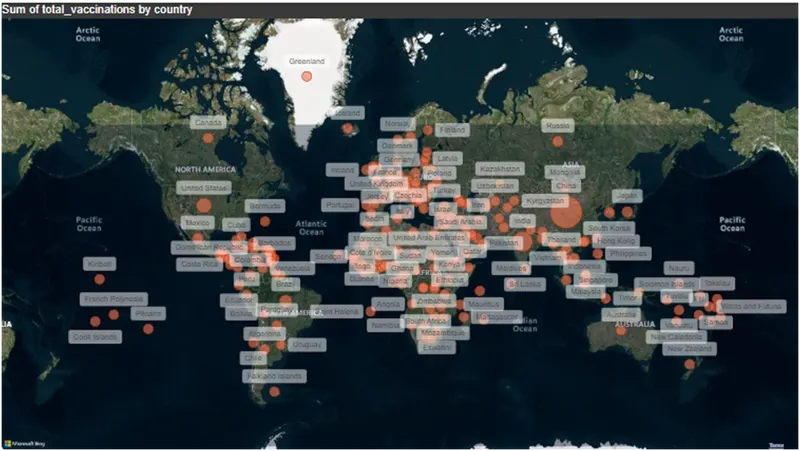
Above map shows the total vaccination of countries by geographical map.
Insights:
The final report provides valuable insights into the vaccination efforts around the world. By analyse the data, it is possible to identify the countries with low rate of vaccination, as well as the countries with the highest rates of fully vaccinated individuals.
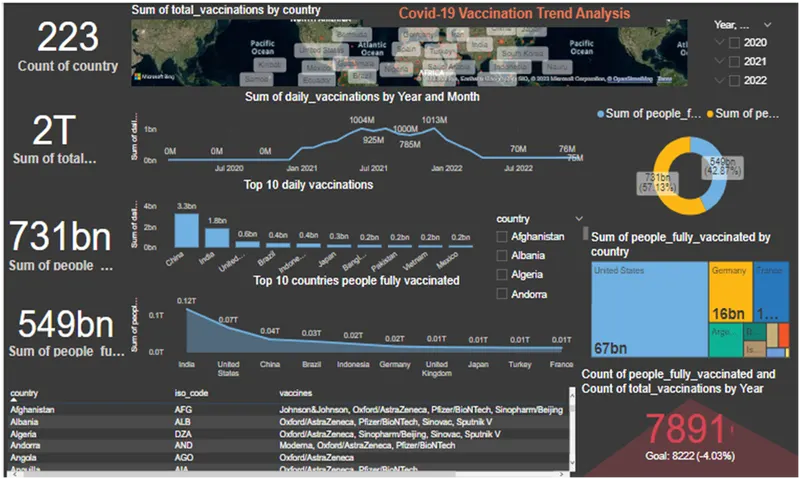
- In this we can see that there are 223 countries available in the given data set
- There are 549 billion Peoples are Fully Vaccinated all over the world.
- Total Vaccinations available is more than 2 trillion.
- There are 731 billion peoples have been Vaccinated at least 1st Dose or 2nd Dose.
Recommendations:
- We can perform operations with various categories.
- In order to improve the accuracy and usefulness of the data analysis, it is important to ensure that the datasets used are of high quality and are properly cleaned and organized.
- The developed and economically strong countries should help out the under developed and developing countries to improve the vaccination of the people.
- At least 90% of the population should be vaccinated at least once to avoid further problems.
Conclusion:
The report shows that the Covid-19 pandemic was very threatening for the world. Millions of people affected from this disease. So it was necessary to make vaccines. At the end of Dec. 2020 vaccines came into the market and people started taking dose of vaccines.
Additionally, the data shows that the rate of vaccination varies across countries, with some countries having higher rates than others. In general, it appears that the rollout of the vaccine is progressing well, and that more people are becoming vaccinated on a daily basis. Finally we can conclude that world is out of any threat due to Covid-19 and we can also say that people return to the normal routine after vaccination done.