Project 1 - Analyzing the Education trends in Tamilnadu
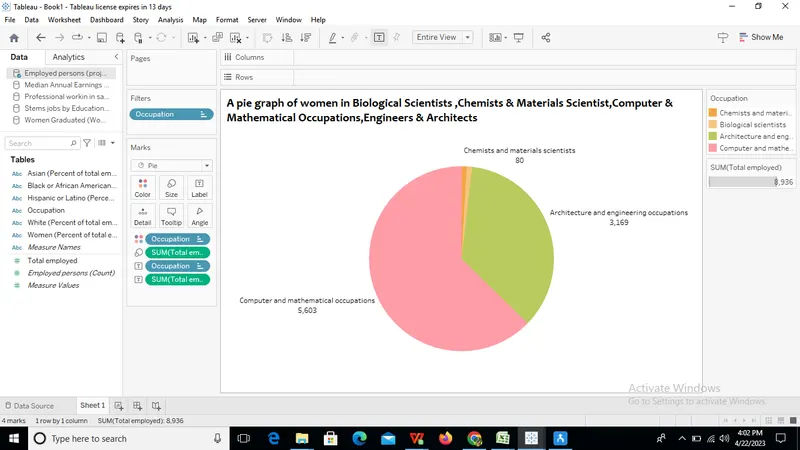
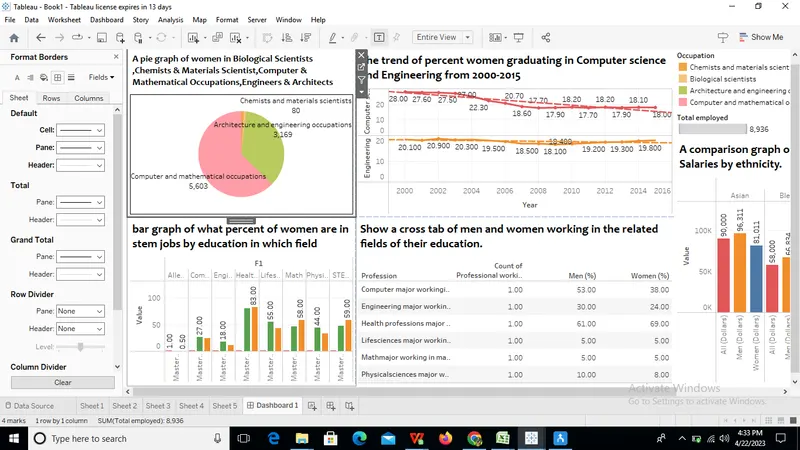
a). A pie graph of women in Biological Scientists ,Chemists & Materials Scientist,Computer & Mathematical Occupations,Engineers & Architects
b).The trend of percent women graduating in Computer science and Engineering from 2000-2015
Should be in text after the graph. Frame a sentence.
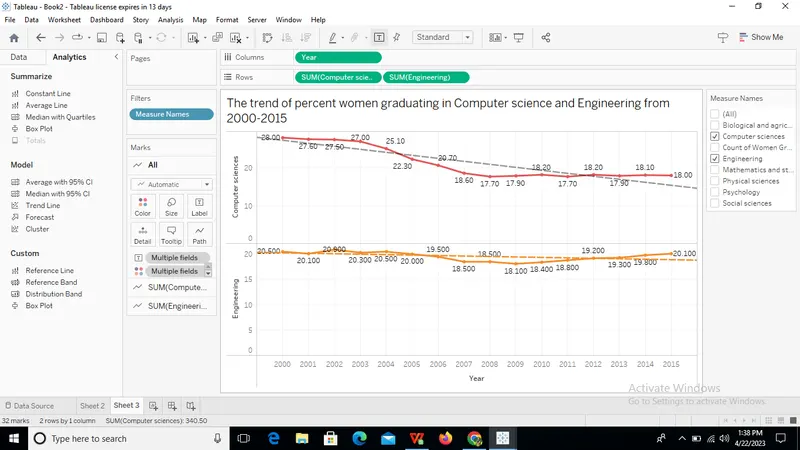
ii).What percent of women are graduating from stem majors (Computer science and Engineering) by 2015
Computer Science:5.28
Engineering:6.43
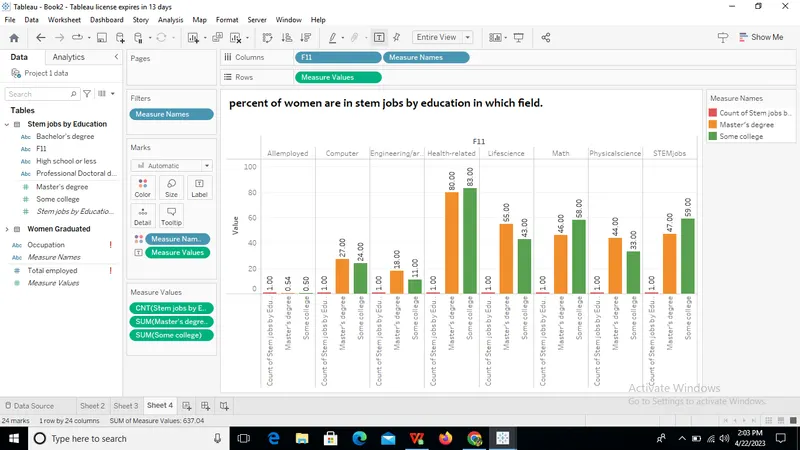
c).A bar graph of what percent of women are in stem jobs by education in which field.
Should be in text after the graph. Frame a sentence.
What percent of women are in health-related jobs with their master’s education and Professional/Doctoral Degree?
d).Show a cross tab of men and women working in the related fields of their education.
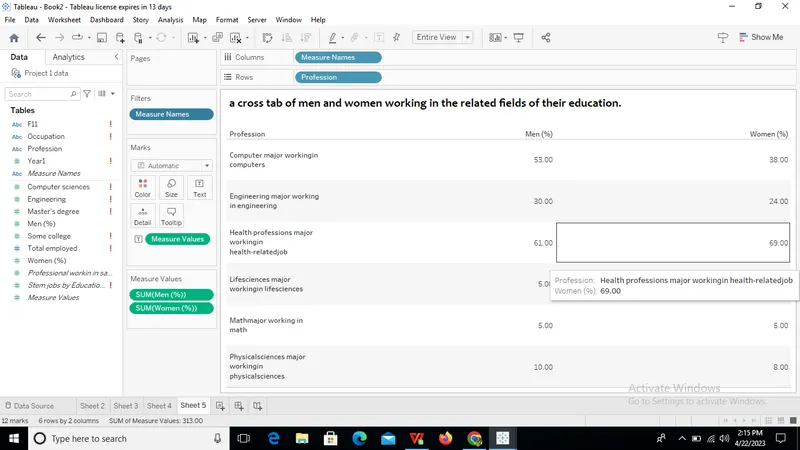
percent of women are working in computers who majored in Computers?38.0
percent of women are working in Engineering jobs who majored in Engineering?24.0
e).A comparison graph of All/Men/Women Salaries by ethnicity.
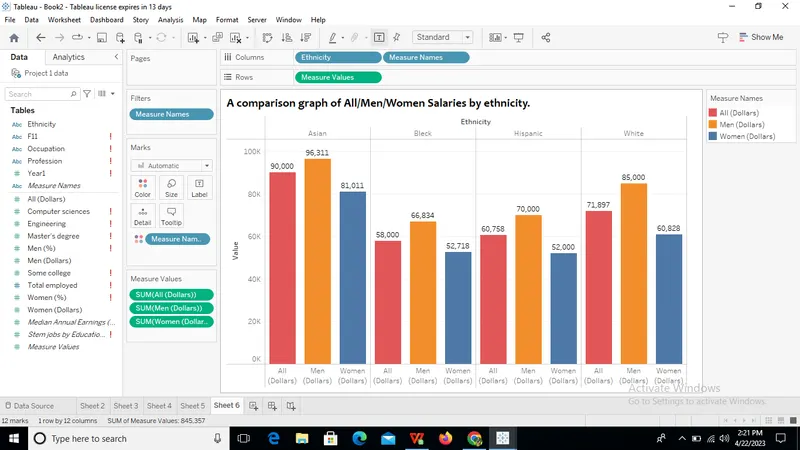
What is the difference in salary in Asian women and men?15300
Women are deprived of the opportunities that men get mainly because of the mindset of the people that the particular roles are more suited to men than women.
Women have to take the responsibilites of the household chores inspite of going to a job where as men are free from that and are encouraged to focus on their career.
The factors like the people's opinion and safety of the women also play a major role in hindering the growth of a woman in several parts of the world