Project 1 - Analyzing the Education trends in Tamilnadu
This dashboard empowers mission driven organizations to harness the power of data visualization for social change. Women are tracked away from science and mathematics throughout their education, limiting their training and options to go into these fields as adults. The data set contains the data of women graduated by years, employed persons, Stem Jobs by Education add Salary comparison. This dashboard addresses some major gaps between Men and Women in STEM (Science, Technology, Engineering & Mathematics) fields.
General Requirements
The dashboard should look like an article predicting the basic issues.
Business Requirements
Title: Women in STEM Fields.
-A pie graph of women in
Biological Scientists
Chemists & Materials Scientists
Computer & Mathematical Occupations
Engineers & Architects
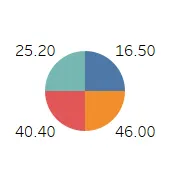

Above pie graph shows Women (Percent of total employed) in Biological Scientists, Chemists & Materials Scientists, Computer & Mathematical Occupations, Engineers & Architects. Most of womens are graduating in Biological scientist as compare to other occupation in this graph.
-The trend of percent women graduating in Computer science and Engineering from 2000-2015
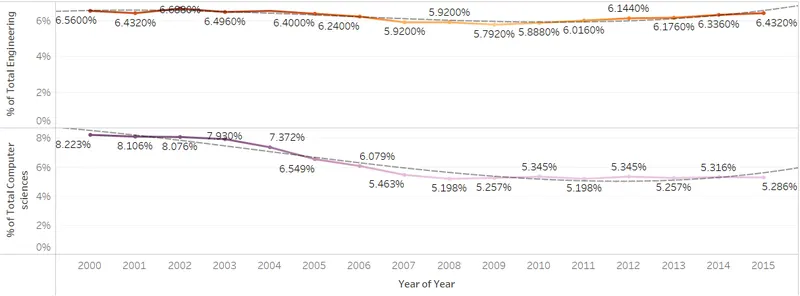
We created trend of percent women graduating in Computer science & Engineering from 2000 to 2015.
Should be in text after the graph. Frame a sentence.
What percent of women are graduating from stem majors (Computer science and Engineering) by 2015
There are 6.4% of total engineers and 5.2 % of total computer science womens graduated from stem majors by 2015.
-A bar graph of what percent of women are in stem jobs by education in which field.
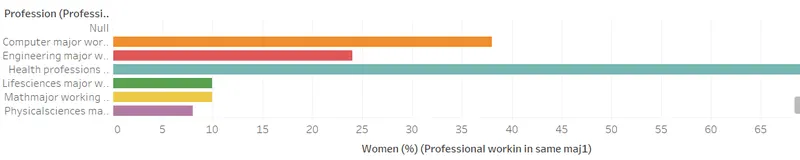


Should be in text after the graph. Frame a sentence.
What percent of women are in health-related jobs with their master’s education and Professional/Doctoral Degree?
25.19% and 19.45% respectively
Show a cross tab of men and women working in the related fields of their education.
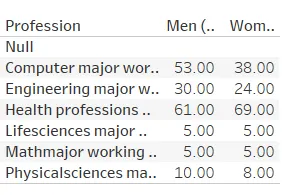
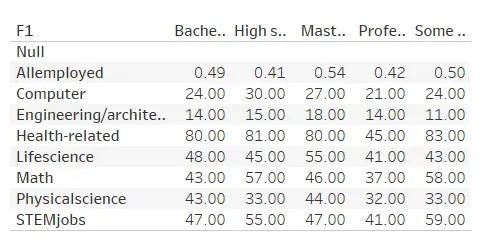
What percent of women are working in computers who majored in Computers?
53
What percent of women are working in Engineering jobs who majored in Engineering?
30
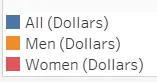
A comparison graph of All/Men/Women Salaries by ethnicity.
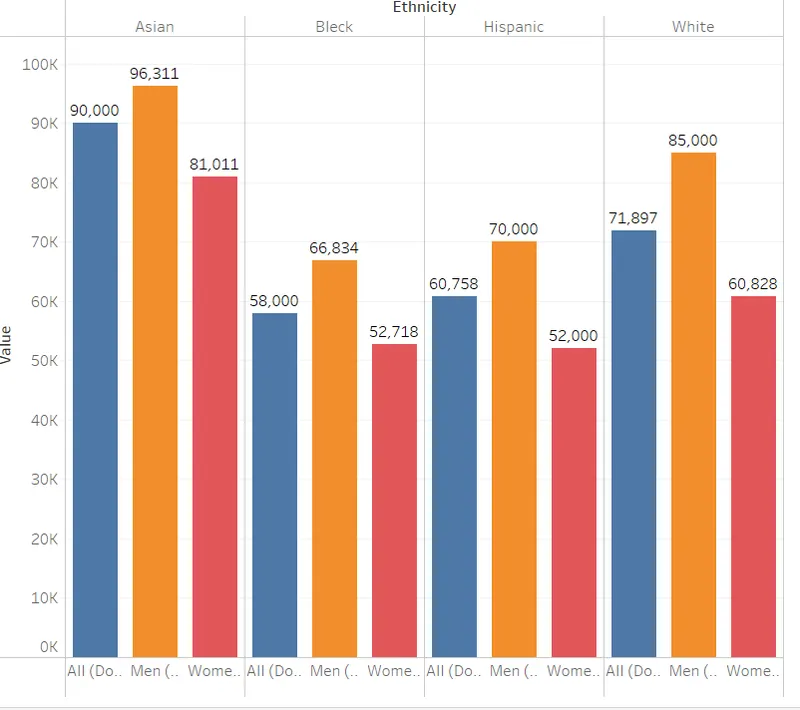
What is the difference in salary in Asian women and men?
15,300
what can be the possible issues on gender gap in STEM Jobs.
STEM fields are often viewed as masculine, and teachers and parents often underestimate girls’ math abilities starting as early as preschool.Male-Dominated Cultures: Because fewer women study and work in STEM, these fields tend to perpetuate inflexible, exclusionary, male-dominated cultures that are not supportive of or attractive to women and minorities.