Project 1
Objective:
the development of a forward energy-based fuel consumption model of a conventional vehicle.
- modeling process
- writing scripts in Matlab
- modeling in Simulink
- analyzing data
- generating plots.
In this project, a typical midsize car with a 1.9L engine and a 4-speed automatic transmission is considered
The model developed has the capability to simulate the vehicle on different drive cycles like
- UDDS
- HWFET
- FTP
- NEDC
Conventional powertrain efficiency:-
The engine generates power by converting chemical energy stored into the mechanical energy by the process of combustion. This process of energy conversion also has an efficiency and the energy input is in the form of fuel consumption.
- Instantaneous fuel consumption is given as
Where,
mf= Pe /ηe*ηt*QLHV
mf = mass flow rate in [kg]
pe = Power of engine
pt = power of transmission
nt = efficiency of transmission
ne = efficiency of engine
QLHV = it is the calorific value/ lower heating value of fuel.
In this system of IC engine if the power at the wheels is zero the engine is idling and still consumes some fuel to overcome the engine drag loss and keep it spinning this is the idling fuel consumption and know as idling process. Above mentioned formula is applicable only when the wheel power is strictly power. When the wheel power is negative either the engine is disengaged and idling or the engine is engaged and providing some engine braking due to the engine drag losses.
The engine is consuming fuel when it is idling but even for engine braking the engine might be consuming some fuel.
The fuel consumption not only depend on the power requirement at the wheels but also is required to generate power to run the various engine and vehicle accessory loads.
SIMULINK MODELLING
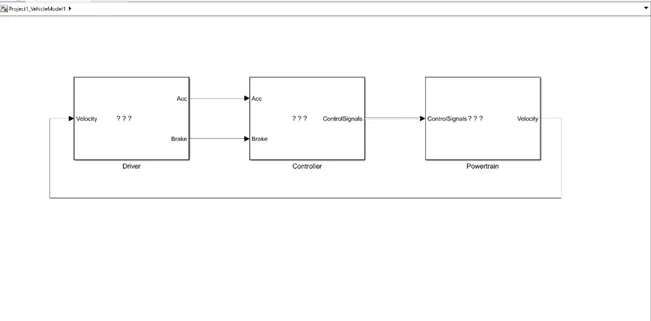
The Simulink model for the convection model is created using 3 main subblocks for the driver model, control model and powertrain block.
The actual vehicle speed is given as feedback to the driver block, and the driver block gives the controller block the required acceleration or brake output, while the controller block provides control signals for engine torque, gear shifting and brake torque to the Powertrain model.
Driver Model
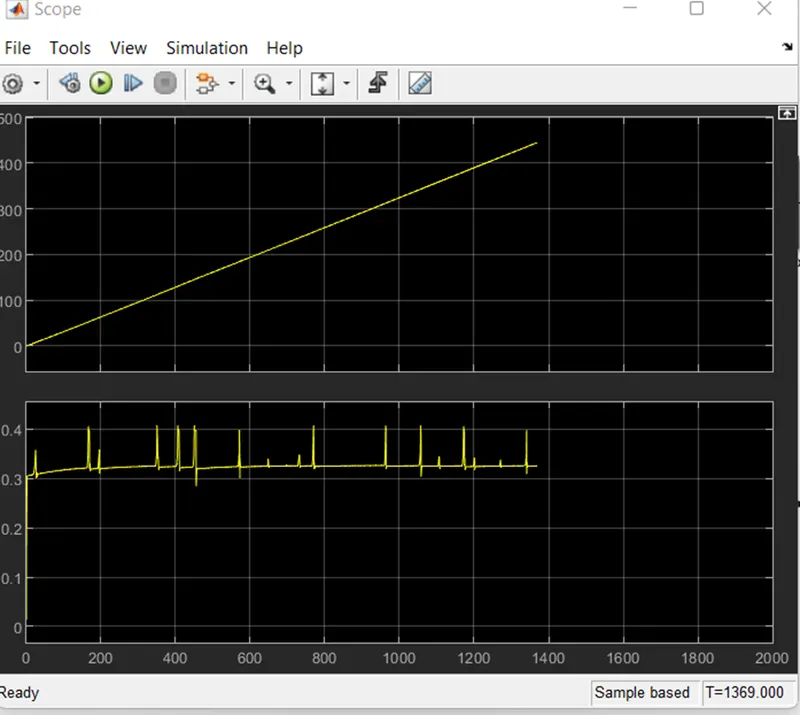
Driver Model is a basic PI controller that generates accelerator and brake pedal outputs to match the desired and actual vehicle speeds.
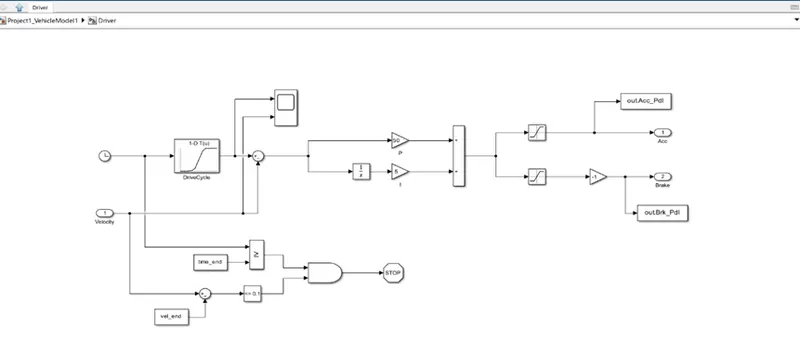
The PI controller controls the error between the required drive cycle and actual vehicle speed by providing acceleration and brake pedal output to the controller.
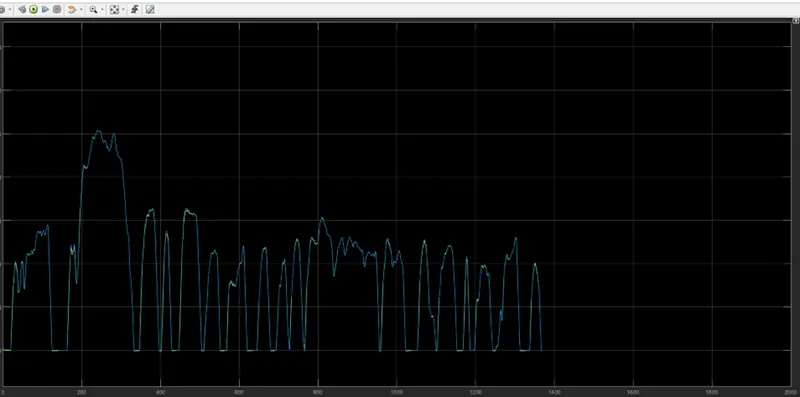
Graph created from Scope in Driver Model:-
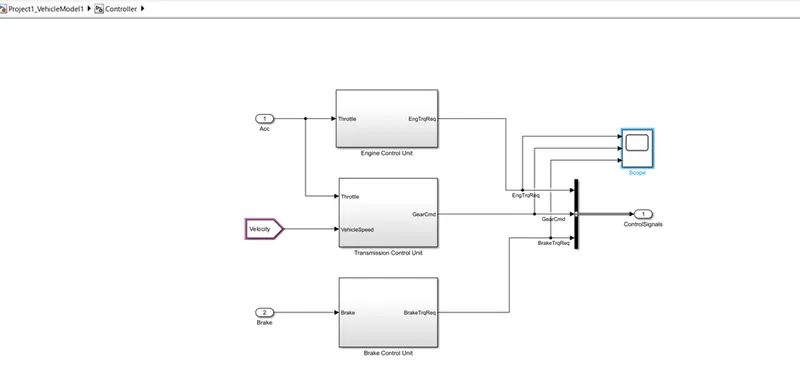
Controller Model
The ‘Controller’ block is the brains of the vehicle, representing the electronic controls units. Based on the driver inputs, it generates desired engine torque, desired transmission gear and desired brake torque. These inputs are fed to the ‘Powertrain’ block which represents the drivetrain of the vehicle
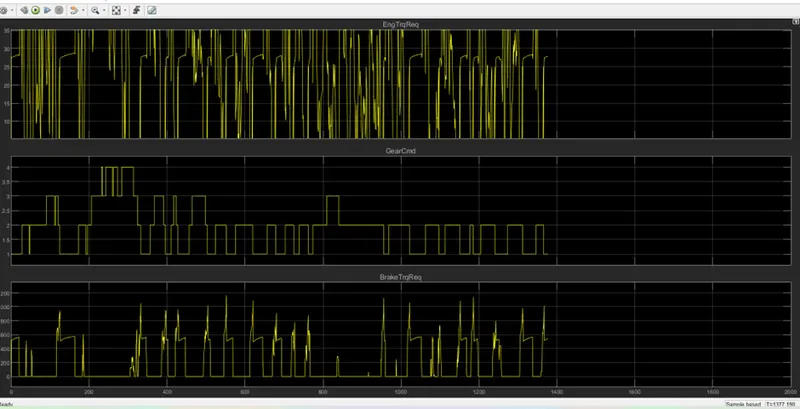
Graph created from Scope in contoller Model
Powertrain Model
The powertrain model includes all the components that convert the power of the engine into vehicle motion.
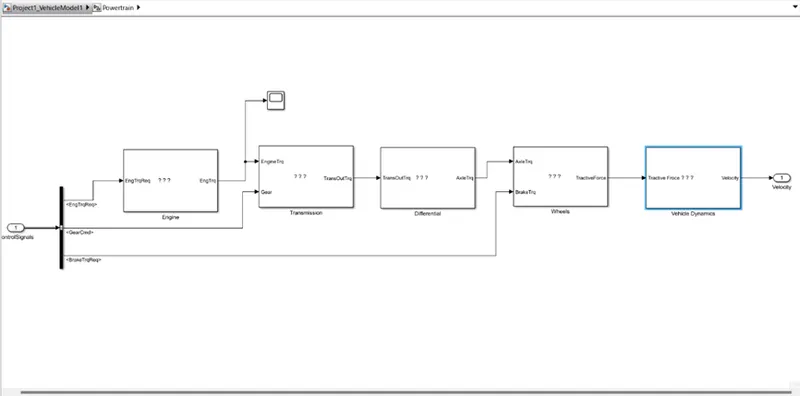
This includes subsystem
- Engine
- Transmission
- Differential
- Wheels
- Vehicle dynamics
Engine Model :
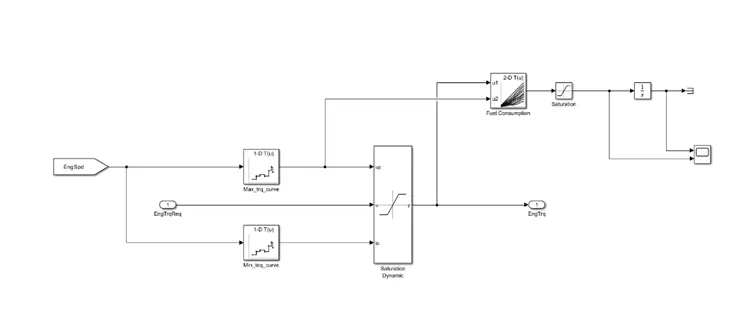
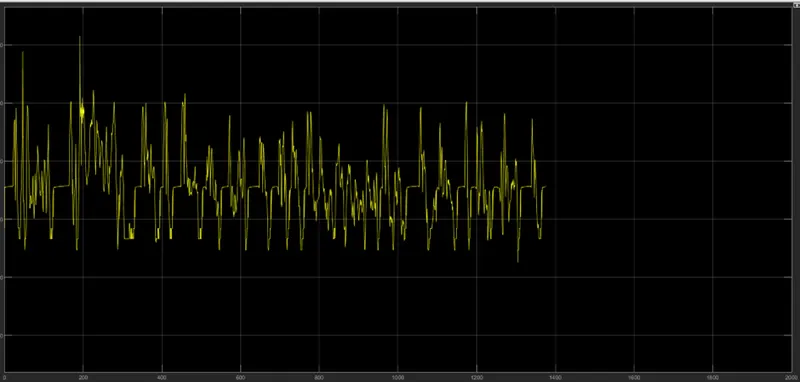
Based on the Engine speed The required torque from the controller is saturated between Max torque curve and min torque curve and passes the Engine torque to the Transmission block
Graph created from Scope - Engine Torque
- Transmission
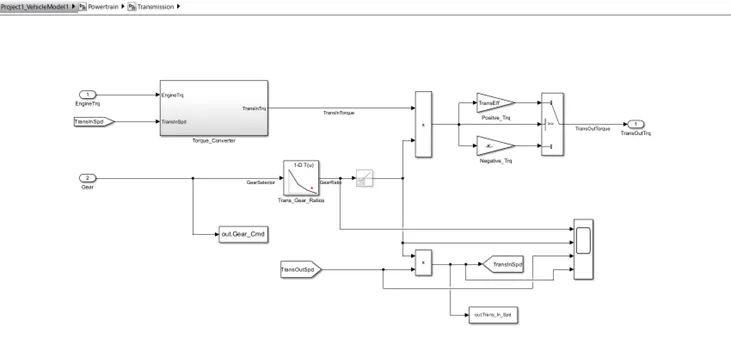
The engine block is connected to the automatic transmission via a torque converter. The output of the transmission is connected to the differential.
Torque Converter Block:
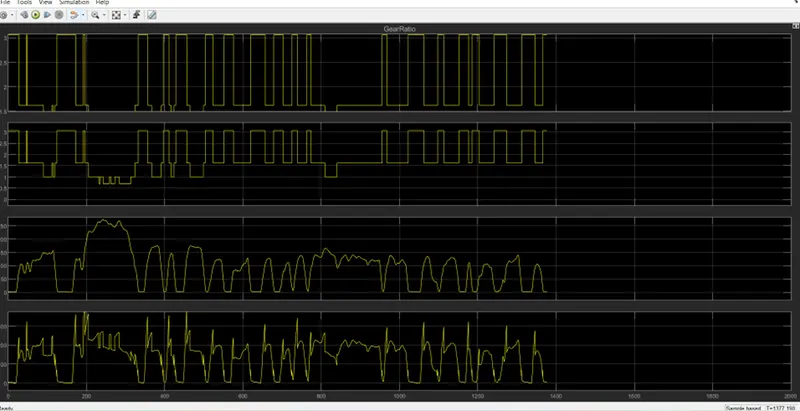
Graph created from Scope in Transmission Model
- Differential
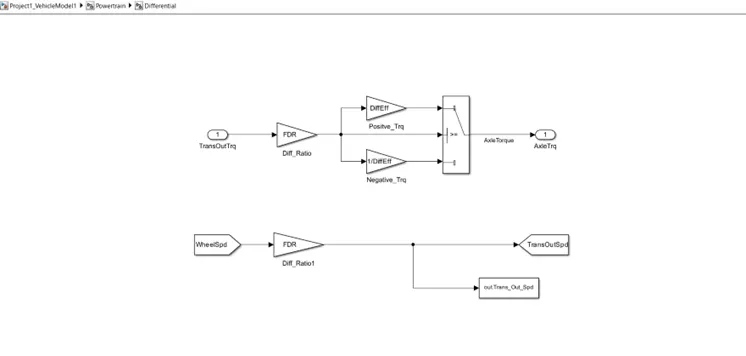
The transmission output torque is multiplied by the differential ratio and differential efficiency in this block and the torque is transmitted to the wheel as the axle torque.
- Wheels
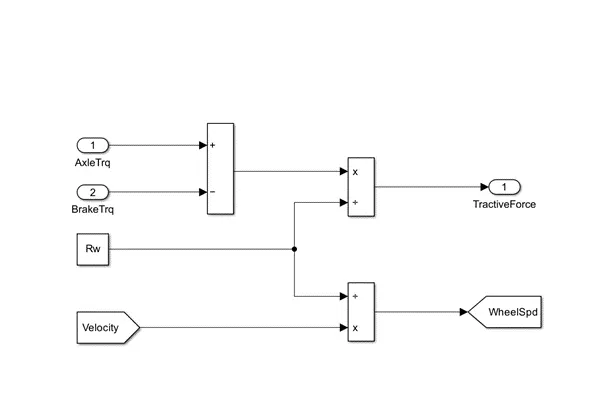
The brake torque from the control model is subtracted from the Axle torque and divides from the rolling radius to determine the Tractive force.
The Wheel speed is calculated from the vehicle velocity and saved in the workspace.
- Vehicle dynamics
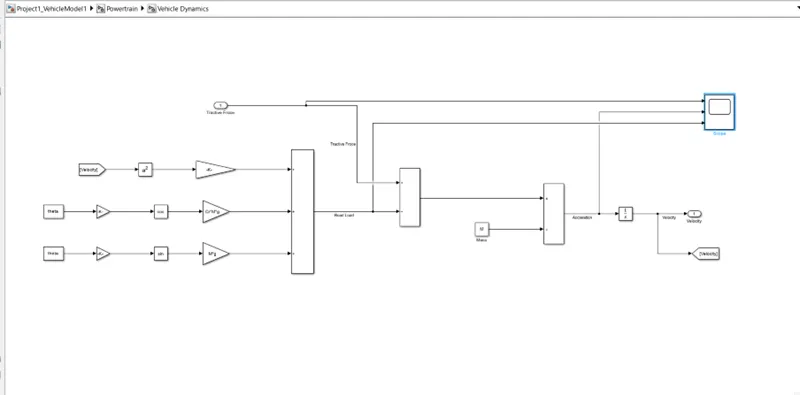
The longitudinal dynamics of the vehicle along with the road load is represented in the ‘Vehicle Dynamics’ block
- Froce Load F(load) = Fr(rolling Froce) + Fw(Acceleration Froce) + Fg(Hill Climbing Froce)
- Rolling Force : Fr= Cr*M*g*cosθ
- Acceleration Force : Fω= 1/2* rho * Af * Cd*(Vveh+Vw)^2
- Hill Climbing Force : Fg=M* g* sinθ
- Power : P=F * V_Veh
- Energy : E=P* T
In this takes tractive force and road load. It is dictates vehicle speed based on tractive force and road load.
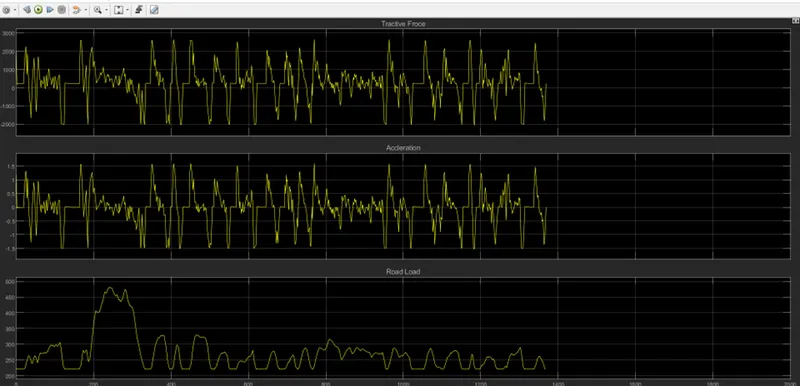
Tabulate the fuel economy numbers (kmpl) for UDDS and HWFET cycle. This forms the baseline numbers for comparing with the future hybrid version.
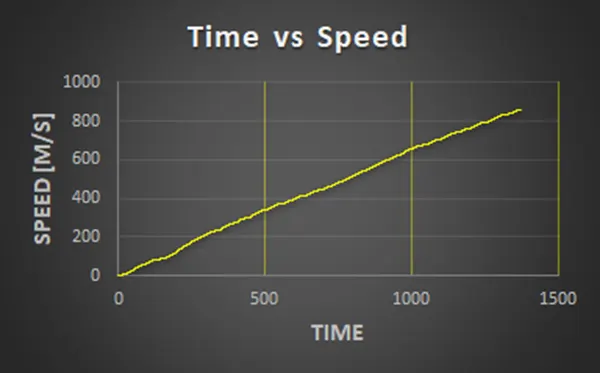
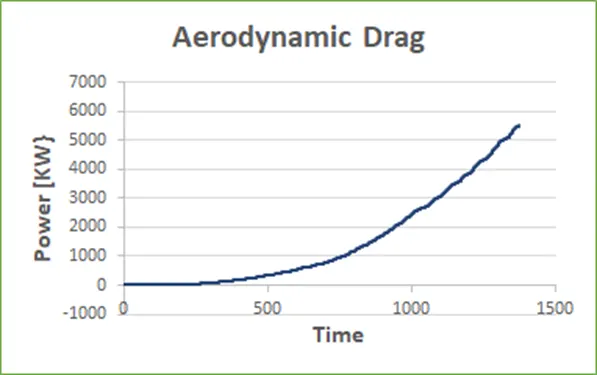
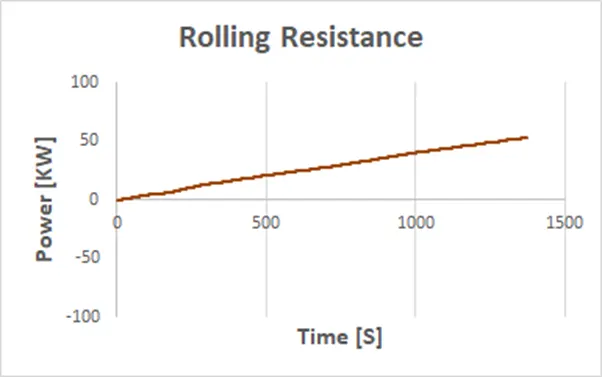
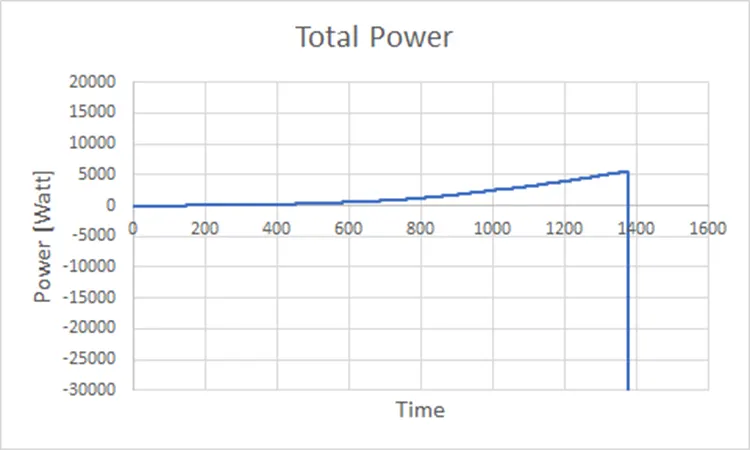
1] UDDS Drive cycle
1] Time VS Speed:- In this the speed is increasing continuously.
2] Aerodynamic drag:- Drag as increase when the power increase.
3] Rolling Resistance :- Its also increase when power is increase wrt time.
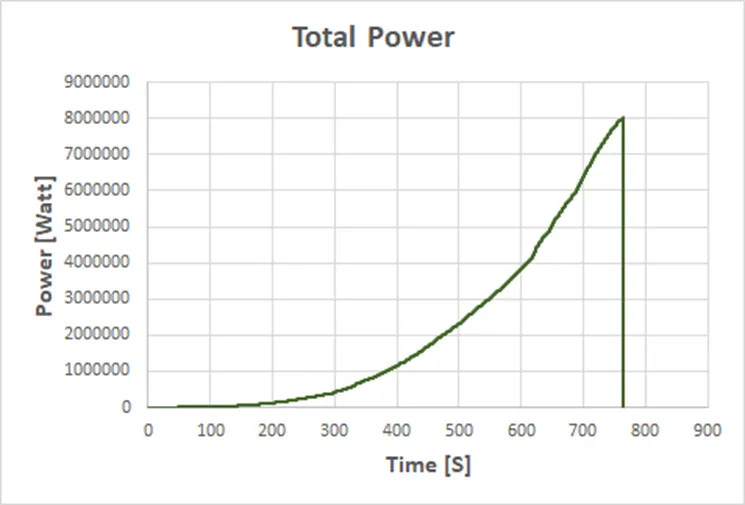
4] Total power = aerodynamic drag +rolling resistance +inertial resistance
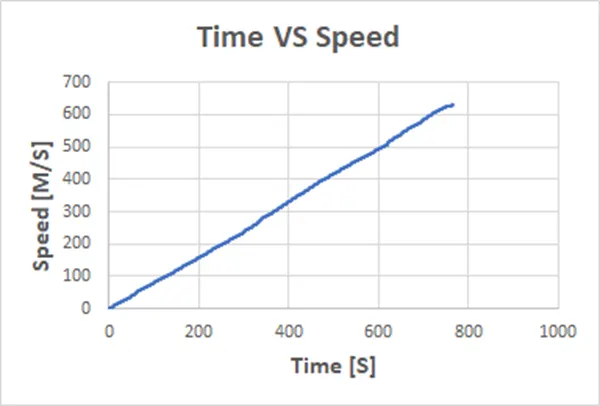
2] HWFET Drive Cycle:-
1] Time VS Speed:- Speed is continuosly increase wrt time.
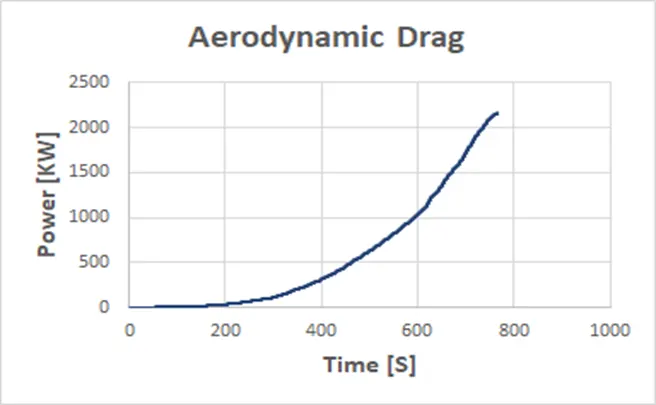
2] Aerodynamic Drag:- Drag as increase when the power increase.
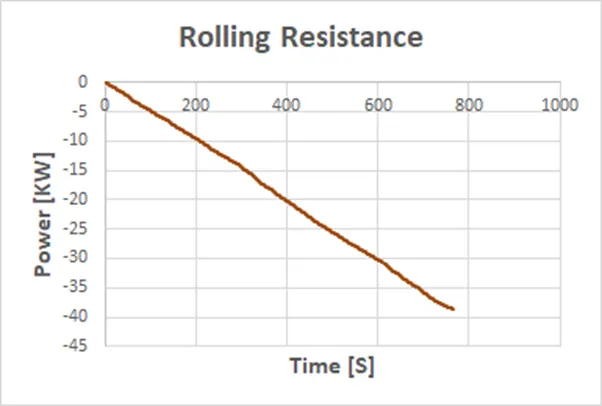
3] Rolling Resistance:- In this resistance is decrease wrt time.
4] Total Power:- aerodynamic drag +rolling resistance + inertial resistance