Project 1
Here in the given model in the question is a complete vehicle simulink model.
The qestion can be briefed as follows
Project initialization file
In this project initialization file few road load parameters, powertrain parameters, vehicle parameters end driver parameters are defined vehicle engine data and transmission data are loaded from separate files. Various Dr cycles are also set in separate files and it is programmed in such a way that by changing a single parameter different Dr cycles can be selected.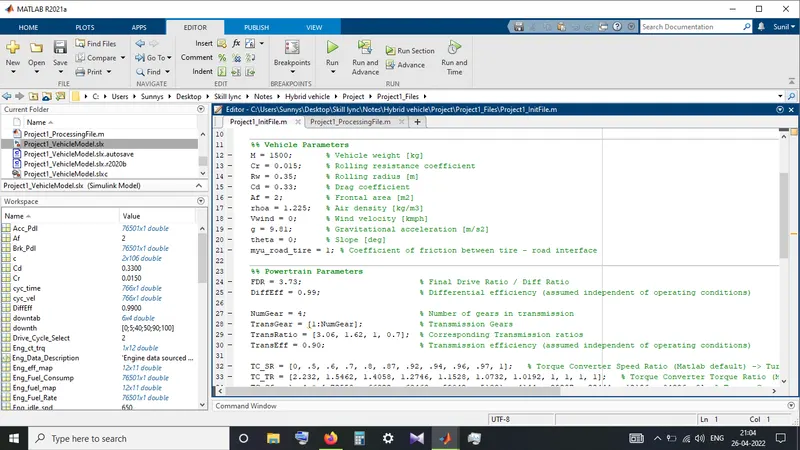
Simulink file:
it mainly has 3 subsystems, they are driver, controller and the powertrain.
Driver block
The main purpose of the driver block is to generate the vehicle acceleration and brake commands.the main input of this driver block is a drain cycle. Here it is asked in the question to focus on two major drive cycles, they are UDDS, HWFET. The actual input for acceleration and brake he’s generated by using a PI controller. The output velocity feedback and the drive cycle velocity are differentiated and fed as a gain to PI controller. We have fixed the gains of P&I controllers as 50 and 5 respectively based on trial and error method.
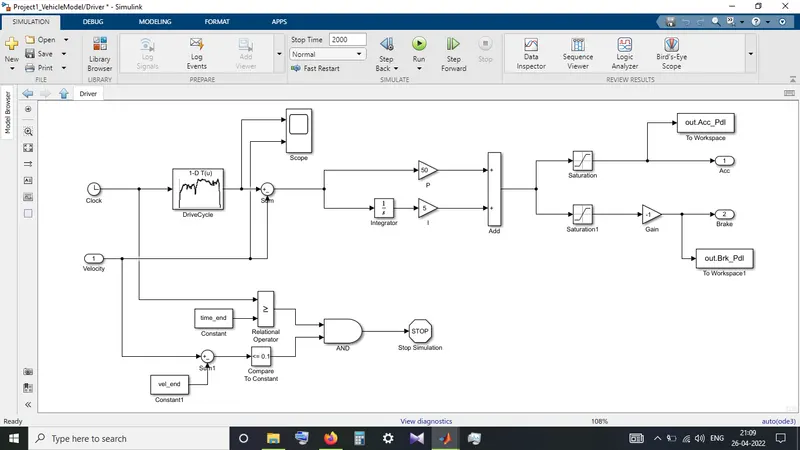
This block here also generating a signal to stop the simulation when the drive cycle duration ends along with vehicle speed drops nearly to 0. We generated acceleration and break demands are also send to workspace.
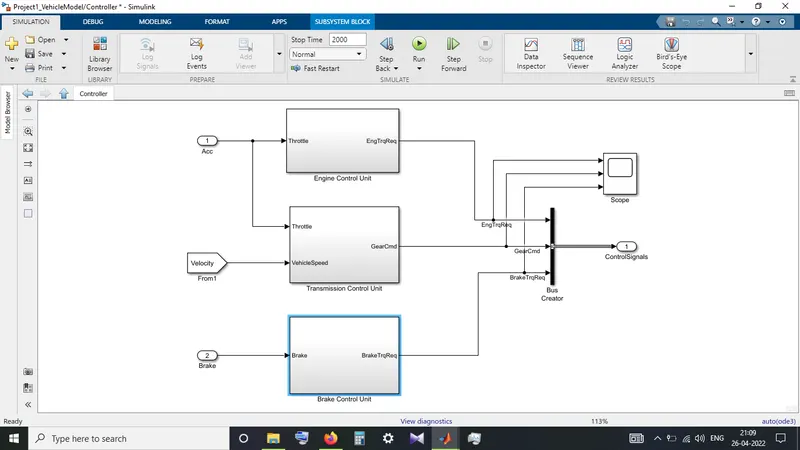
Controller block:
Controller block takes acceleration command and break command as the inputs and generates engine torque brake torque end gear command as an output. This block is internally divided into 3 subblocks they are engine control unit, transmission control unit, brake control unit. It also takes the velocity feedback from the next block to process the give commands.
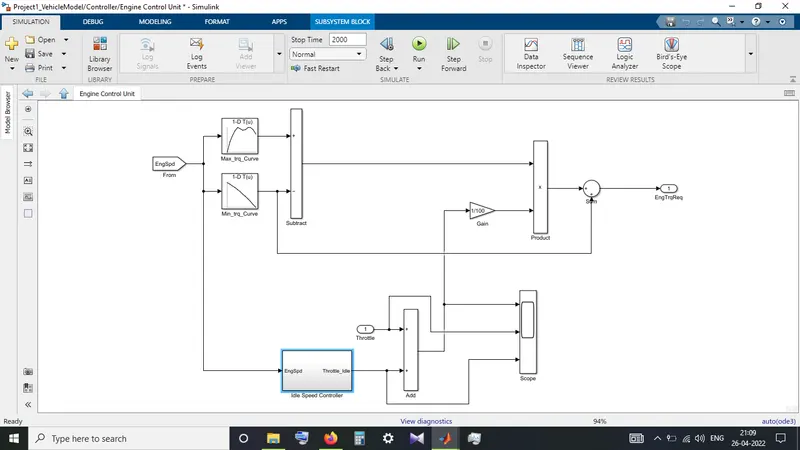
Engine control unit
Inside engine control unit we can see that the acceleration is taken as an input along with engine speed, and required engine output torque is derived. Done by using look up tables for maximum and minimum torques based on the engine speed the respective power is selected .As engine also to be run at idle an idle speed throttle is also considered. The idle throttle is calculated by using a constant value along with engine speed.
Transmission control unit
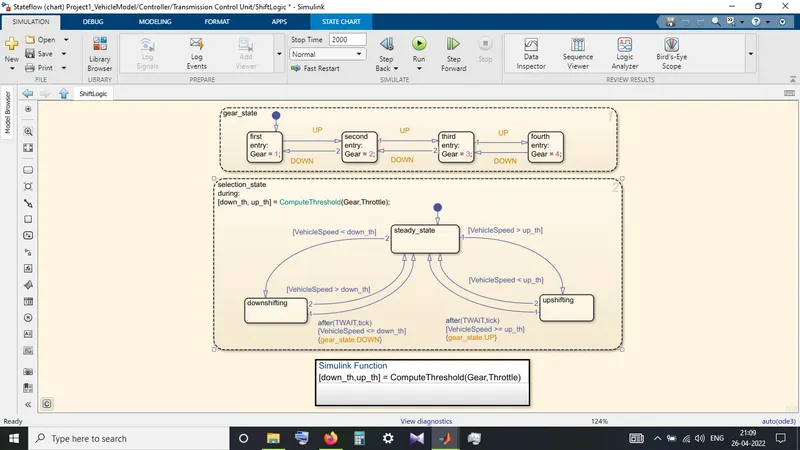
The respective gear command is generated by using state space Chart block. In this chart it is clearly defined depending upon the velocity or speed required the gears are shifted from one state to another the logic can be seen below.
Brake control unit
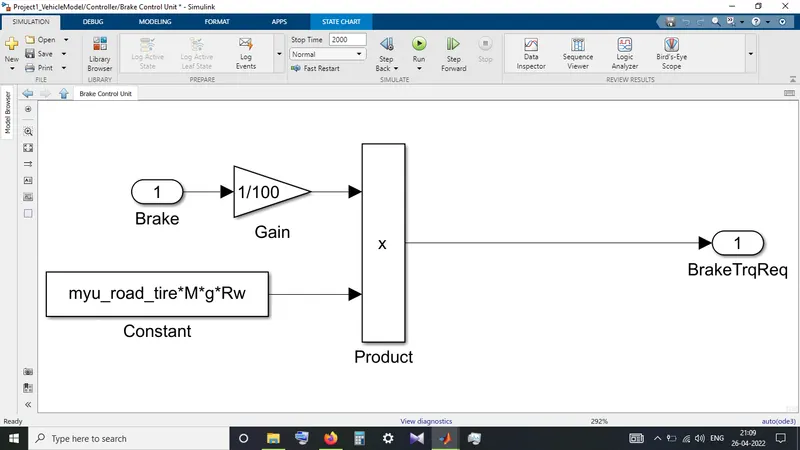
In this break control unit the given break command is multiplied with the road load to get the required brake torque.
Powertrain
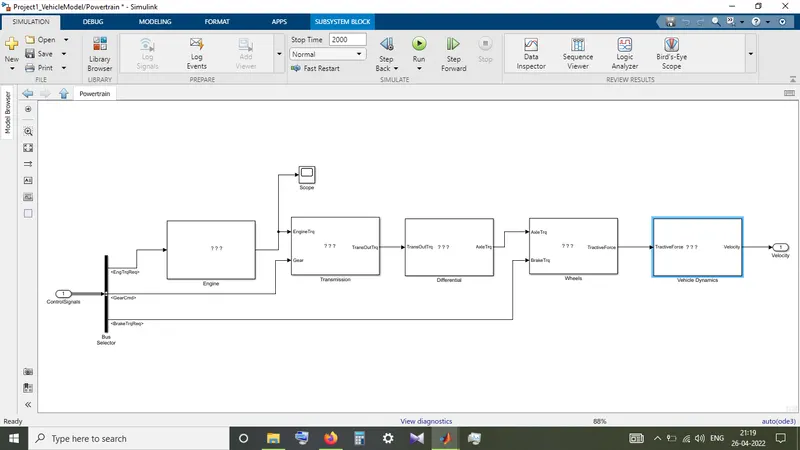
Powertrain consists of five different Blocks, they are Indian, transmission, differential, wheels, vehicle dynamics. Now let us dive in detail of these blocks.
Engine block
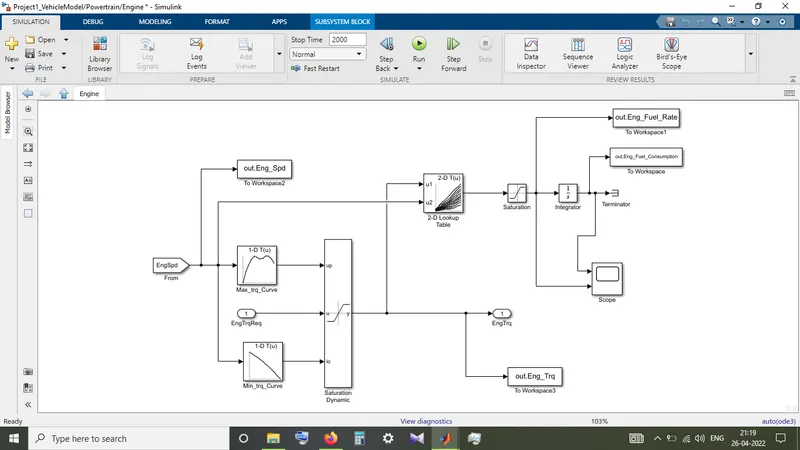
This engine block takes engine speed and engine torque requirement as inputs and generates the engine torque has an output. Here also we used the torque curves from acceleration and deceleration and based on this the engine torque output is generated using a dynamic saturation block. Moreover in this engine block we also calculate the fuel consumption off the vehicle based on engine speed and engine torque. A 2D look up table will generate the fuel consumption based on these values.
Transmission
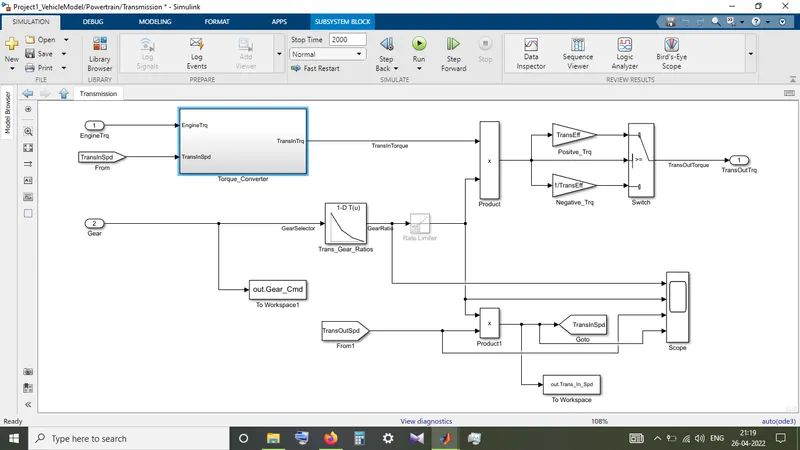
For transmission block engine torque transmission input speed end gear commands are taken as inputs. Firstly the engine torque and transmission input speed are connected to a torque converter To generate a transmission input torque. Now based on the gear selected by using a vlookup table we generate the gear ratio. This gear ratio is multiplied with transmission input torque to get transmission output torque.
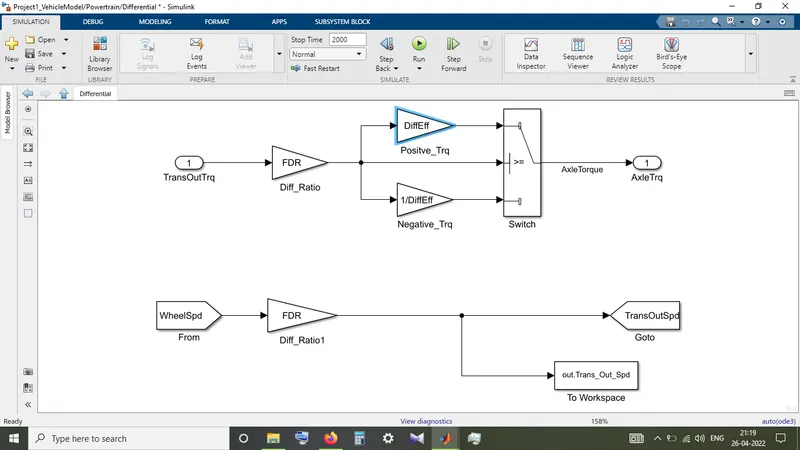
Differential
Inside differential we are converting the transmission output torque to the axle torque. This is done by multiplying the differential ratio to transmission output torque In this block we also calculate the transmission output speed from wheel speed using differential ratio.
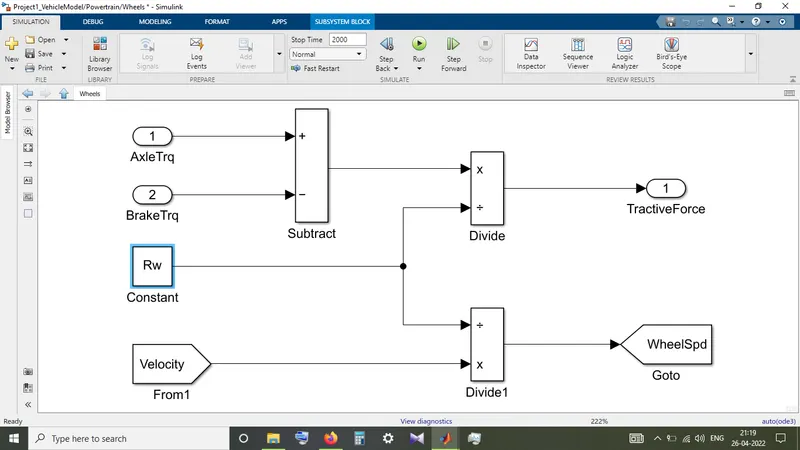
Wheels block
In wheels block we are taking the axial torque and brake torque and generating the Net traction force. In this block we also generate wheel speed from velocity.
Vehicle dynamics
In this vehicle dynamics block we calculate the road loa that is the amount of force required to put the vehicle into acceleration, they are rolling resistance force, aerodynamic drag force,gradient force. These forces are summed up and subtracted from the net tractive force that is generated by previous block.
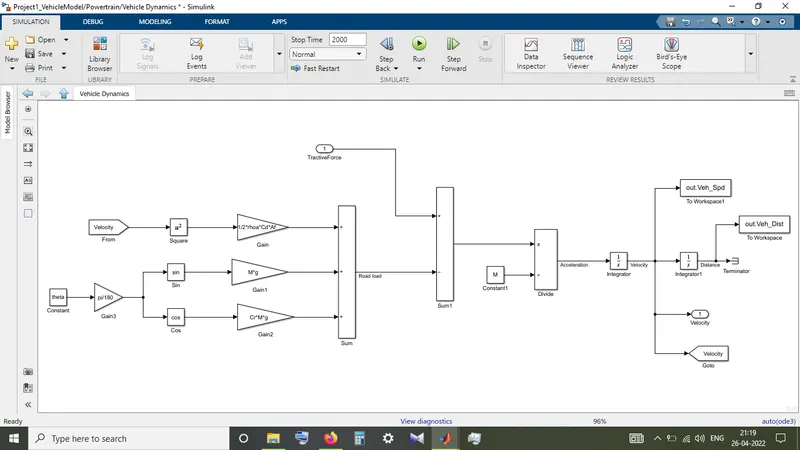
Now based on this net fours we will generate acceleration end velocity, by integrating this velocity we get the distance traveled.
Project processing file:
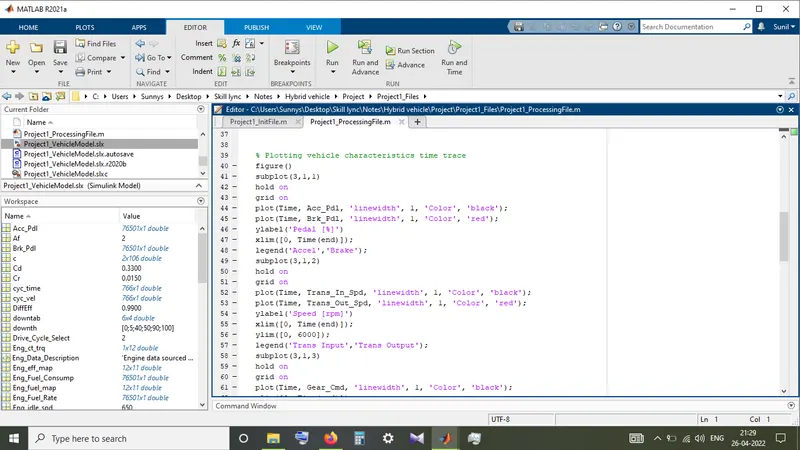
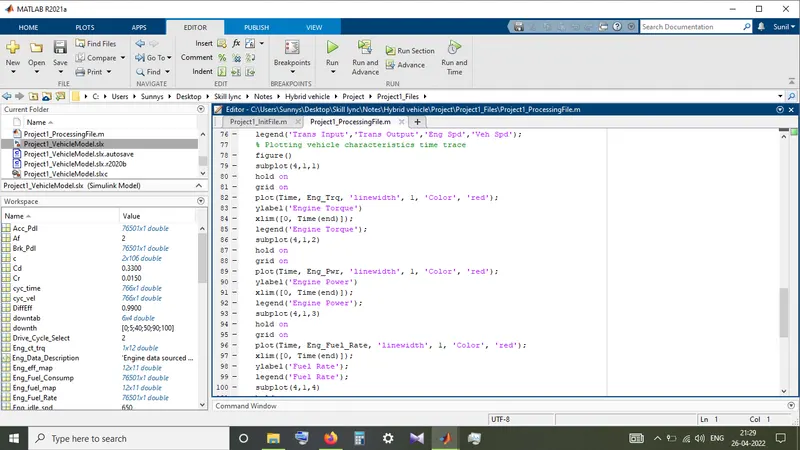
In the developed model we have saved lot of data by using the two workspace block. After execution of this simulink file the saved data in the workspace need to be properly analyzed for studying the results. So this post processing code is written in order to generate the desired graphs from the saved data in the workspace. Engine power and fuel economy are calculated by using basic formulas and the data that is saved in the workspace now the required plots that are given in the question are generated.
Generated graphs
The first plot we are asked to the plot for subplots engine power, engine torque, fuel rate, fuel consumption . it is seen that engine torque has exceeded 100 for few times, engine power has barely touched 40 at some instances.Fuel rate with almost constant in most of the occasions at .5 and the fuel consumption for the world drive cycle has nearly reached 350.
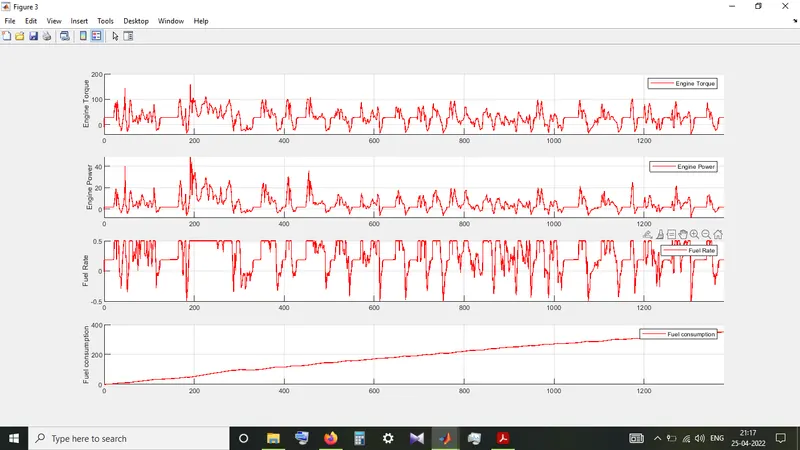 UDDS
UDDS
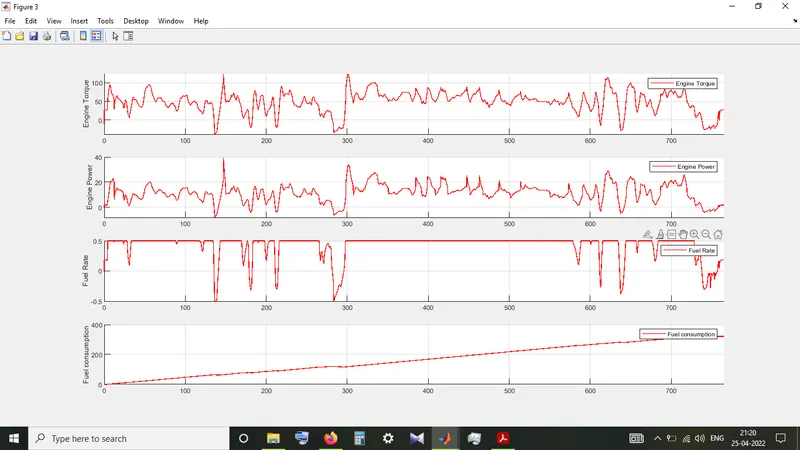 HWFET
HWFET
The second graph that is generated has three subplots one shows the acceleration and break commands in which we can clearly observe that most of the time acceleration is only done and only in rare cases break command he’s generated.
The transmission input and output speeds are plotted in the second subplot and we can clearly see that during decelerations and accelerations for short durations there is no much change in the output speed.
In the third subplot it is asked to plot the gear output and it is plotted withrespect to time.
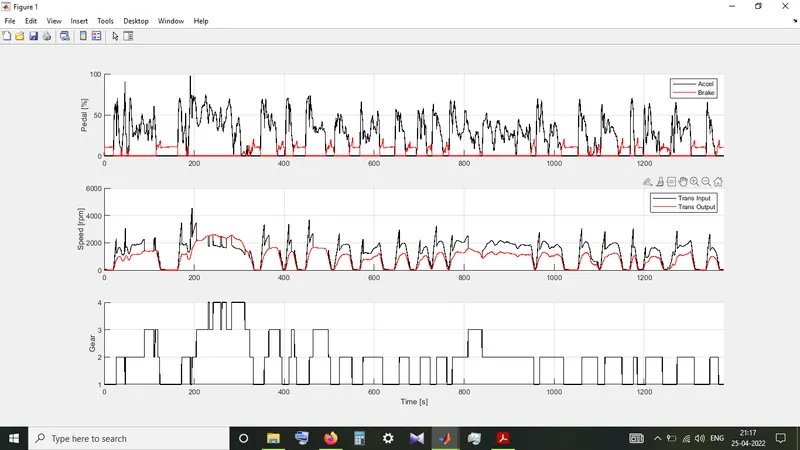 UDDS
UDDS
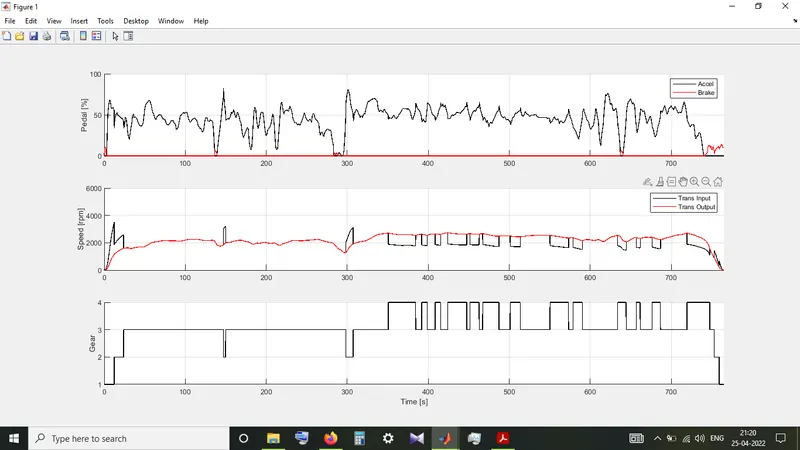 HWFET
HWFET
The third graph that is asked to generate was a time trace graph of transmission input, output, engine speed and vehicle speed. It can be clear clearly observed that engine speed and transmission input speed or almost followed the same pattern but when it comes to transmission output speed during deceleration for short durations the output speed has not followed The input speed. There is not much variation in the vehicle speed.
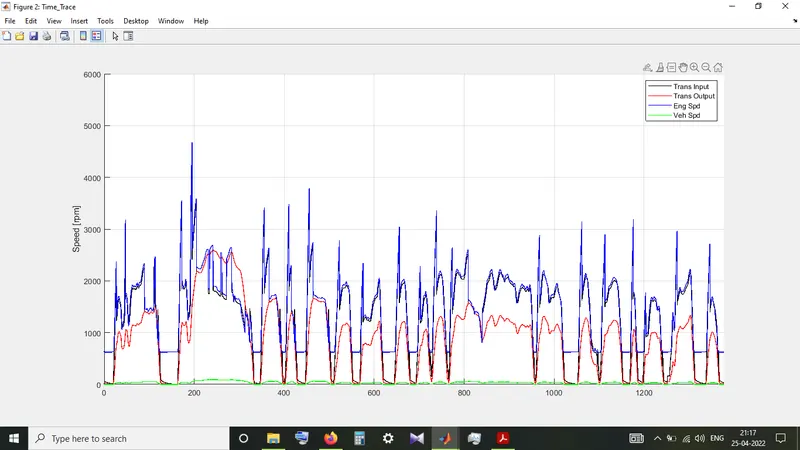 UDDS
UDDS
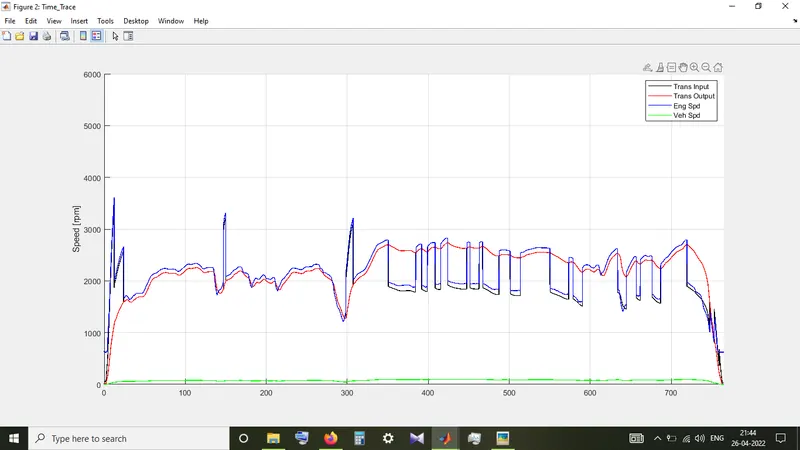 HWFET
HWFET
In the last plot engine efficiency is plotted. the engine operating points are also marked in this plot the script is written in that fashion so that operating points can be identified. It can be clearly seen that the best efficiency is a car at 3000 to 3500 RPMS
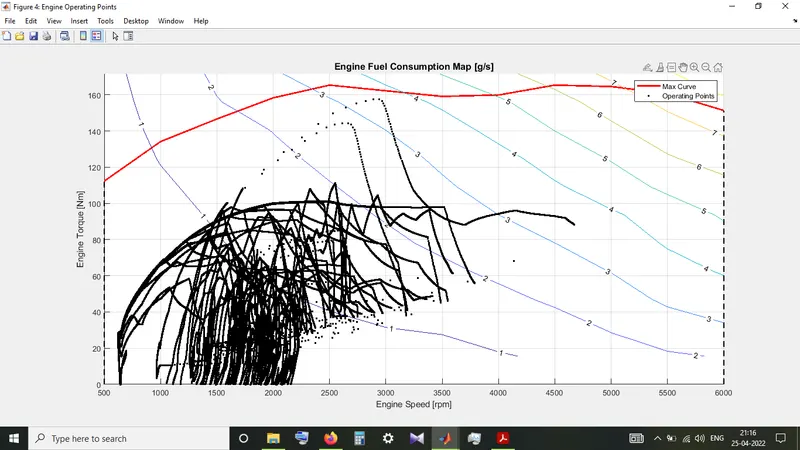 UDDS
UDDS
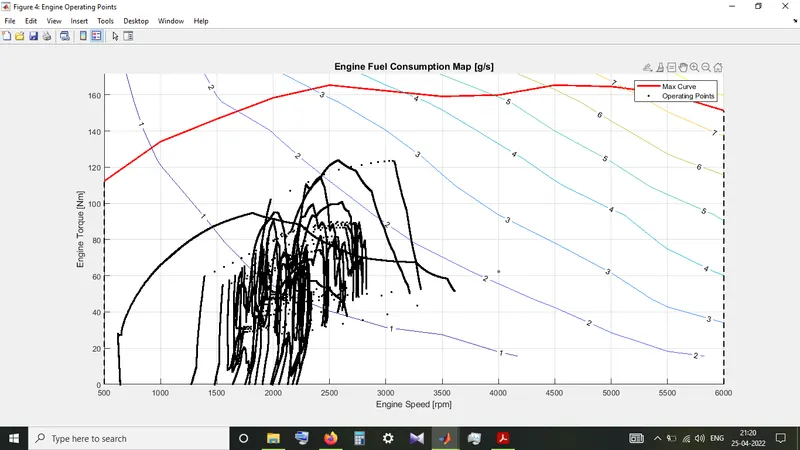 HWFET
HWFET