Project 1
pdf link same ans : https://docs.google.com/document/d/16zyPpAYnQDP_nqj_5xwpSOKR5JDQiNDM/edit?usp=sharing&ouid=112031055003736671606&rtpof=true&sd=true
********************************************************************************************
1. Explain the data. Check It is supervised or Unsupervised. Demonstrate?
The provided data is an example of supervised learning data. In supervised learning, the algorithm is trained on a labeled dataset, where the input features and their corresponding output (or target) values are provided
n this dataset:
- Input Features (Independent Variables):
- age
- sex
- bmi
- children
- smoker
- region
- Output (Dependent Variable):
- 7. charges
Info of data
- age: Age of the individual.
- sex: Gender of the individual (female/male).
- BMI: Body Mass Index (a measure of body fat based on height and weight).
- children: Number of children or dependents covered by the insurance.
- smoker: Smoking status (yes/no).
- region: Geographic region of the individual (southwest, southeast, northwest, northeast).
- charges: Insurance charges associated with the individual.
********************************************************************************************
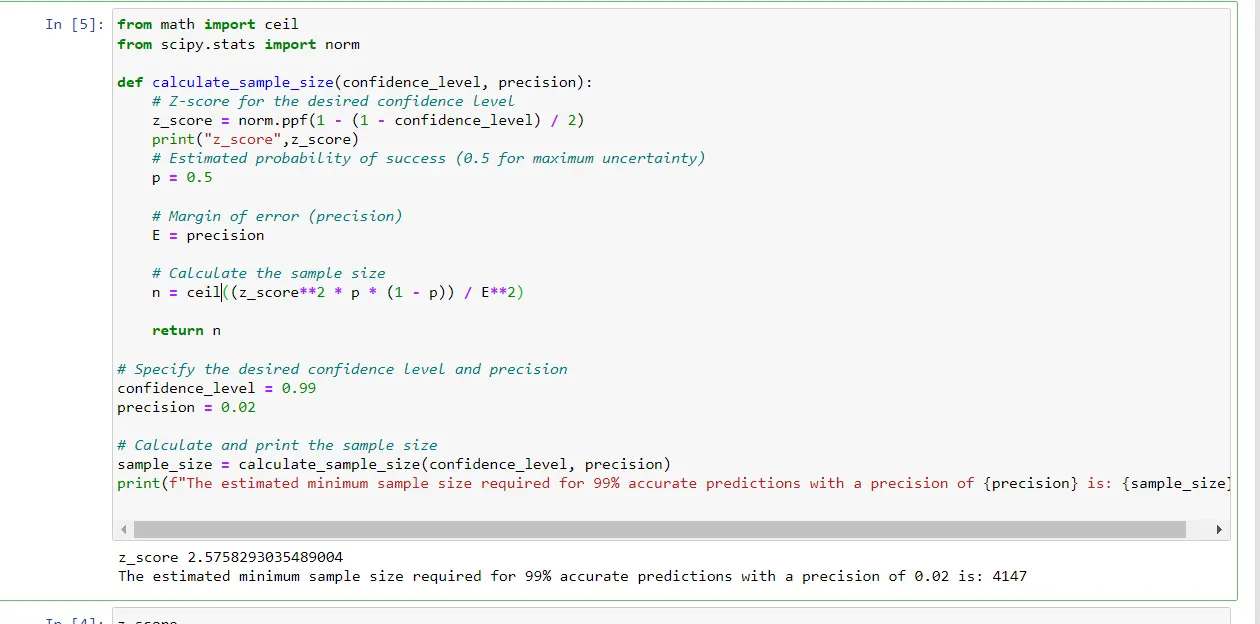
2. Estimate the minimum sample size n to get 99% accurate predictions. (precision = 0.02)
To estimate the minimum sample size required for a desired level of precision in predictions, you can use the formula for sample size in margin of error estimation. The formula is:
n = ceil((z_score**2 * p * (1 - p)) / E**2)
Where:
n is the sample size.
Z is the Z-score corresponding to the desired confidence level (99% confidence corresponds to a Z-score of approximately 2.576).
p is the estimated probability of success (0.5 for maximum uncertainty, resulting in the maximum sample size).
E is the desired margin of error (precision).
********************************************************************************************
3. Check the data is cleaned or not. If not then clean it (Null values, Row/Column Duplicates, Outliers, Change the string into numbers)
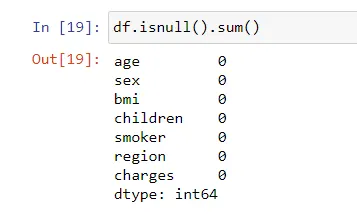
1. Null values
NO NULL Values
2. Row/Column Duplicates
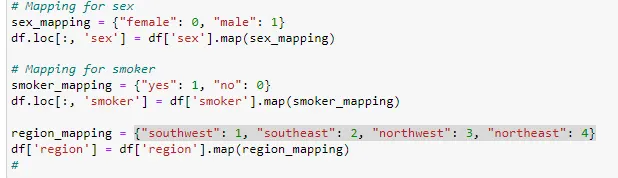
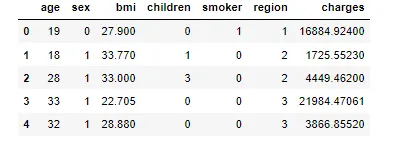
3. Change the string into numbers
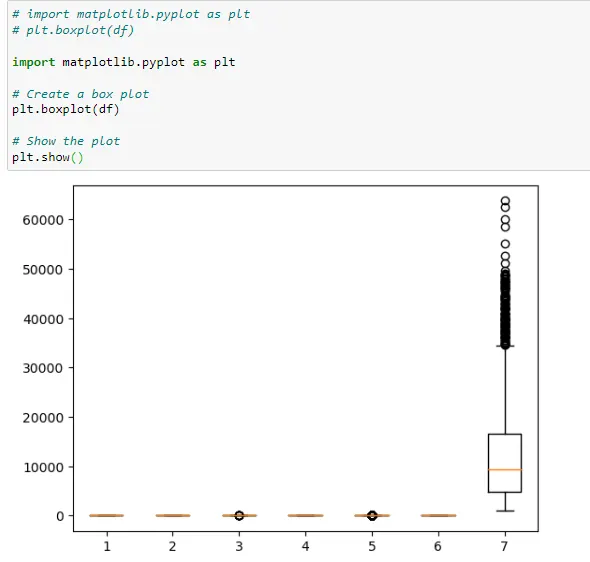
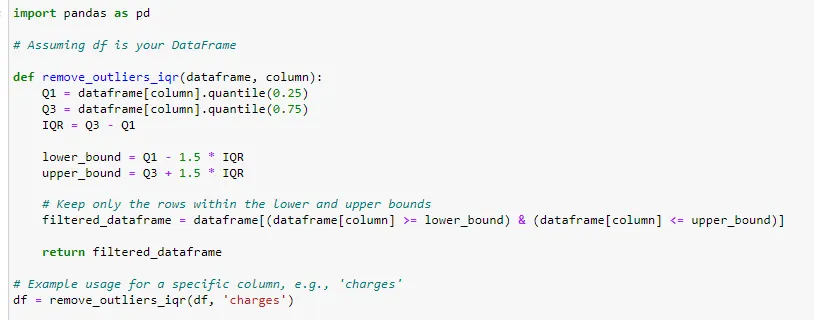
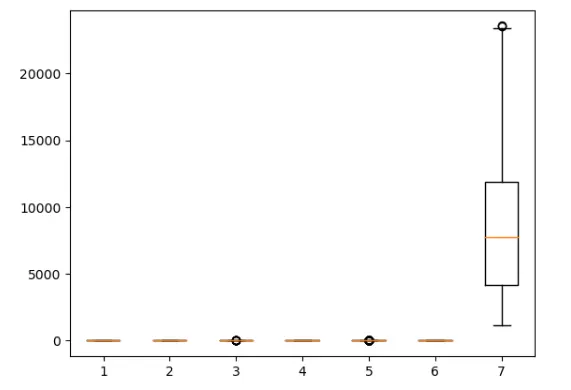
4. Outliers
********************************************************************************************
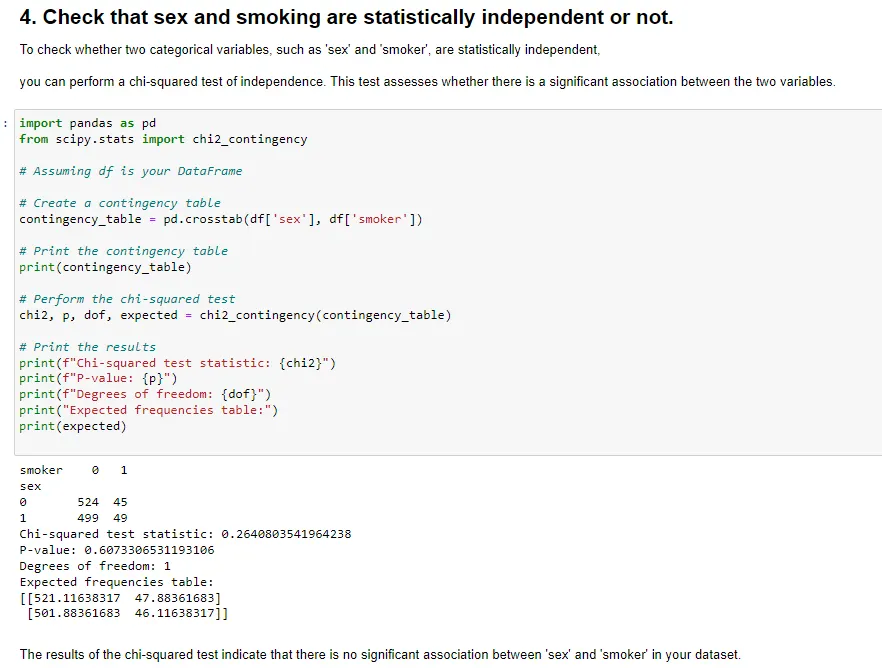
- The chi-squared test statistic: 0.2640803541964238
- P-value: 0.6073306531193106
- Degrees of freedom: 1
********************************************************************************************
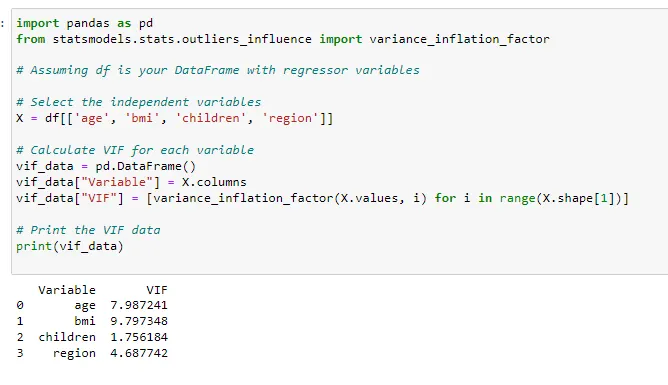
5. Check that all regressor variables (independent variable) are independent of each other or not.
********************************************************************************************
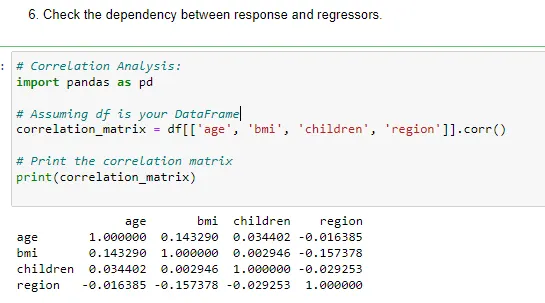
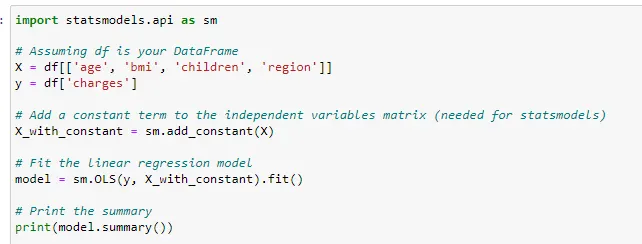
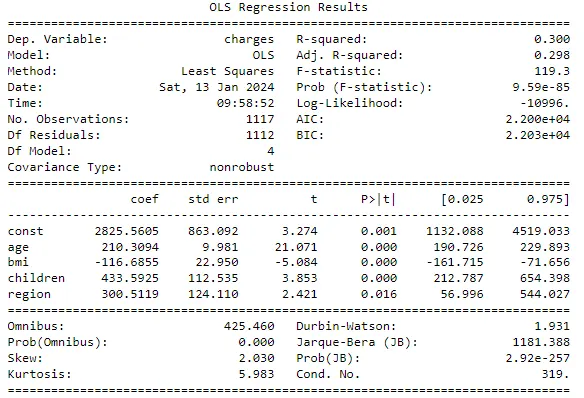
6. Check the dependency between response and regressors.
********************************************************************************************
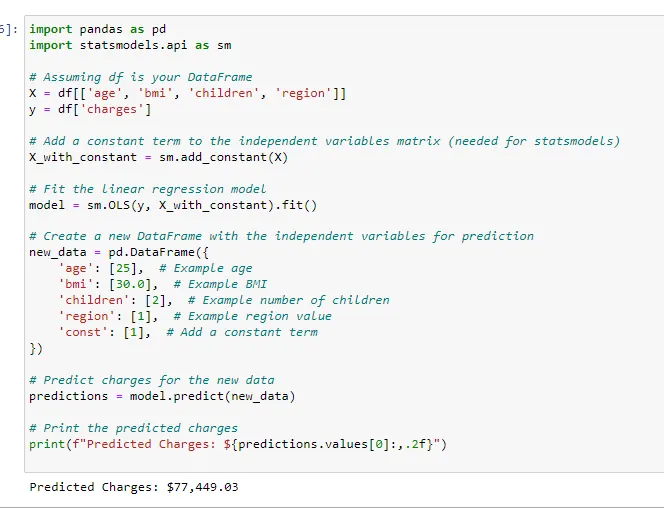
7. Predict the regression Line to predict the charges for insurance using independent variables.
Predicted Charges: $77,449.03
********************************************************************************************
8. Predict the accuracy of the regression Model.
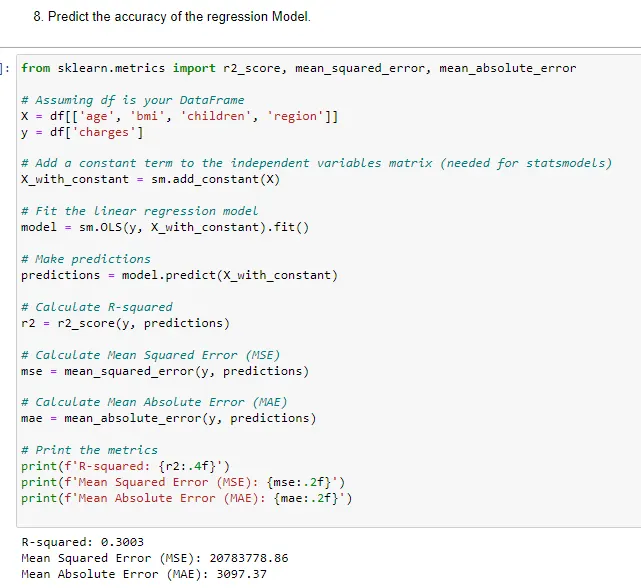
In summary, the regression model's performance is moderate:
- R-squared (R²): 0.3003 (indicating 30.03% of variance explained)
- Mean Squared Error (MSE): 20783778.86
- Mean Absolute Error (MAE): 3097.37
These metrics provide a measure of how well the model predicts insurance charges based on the given independent variables.
********************************************************************************************
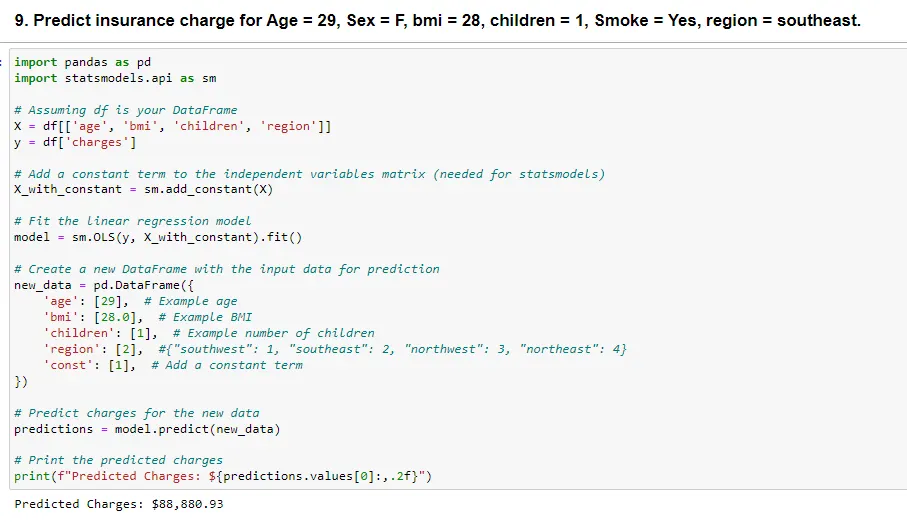
9. Predict insurance charge for Age = 29, Sex = F, bmi = 28, children = 1, Smoke = Yes, region = southeast.
********************************************************************************************
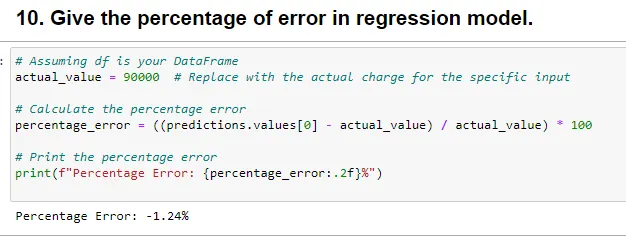
10. Give the percentage of error in regression model.
********************************************************************************************
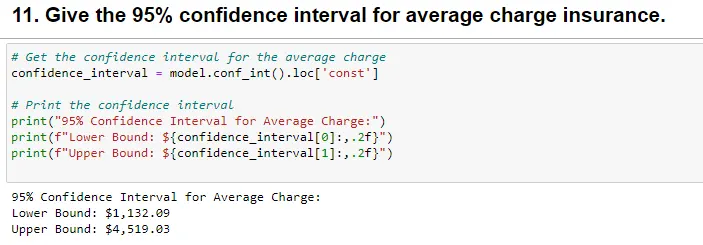
11. Give the 95% confidence interval for average charge insurance.
*************************************** Thank You *******************************************