Project 1
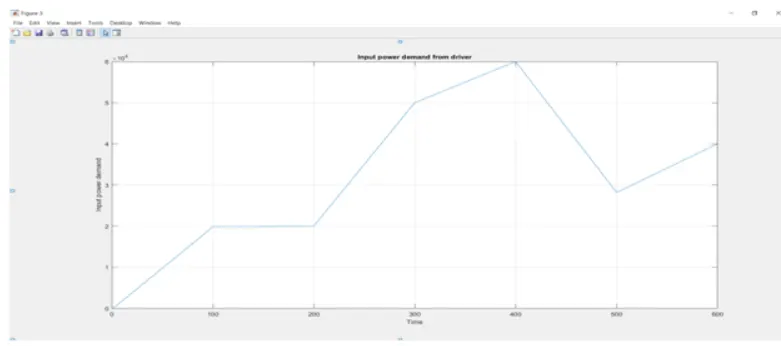
Create a stateflow or Simulink model for the following flowchart.
Load the .mat file into the workspace.
The input to the model would be the power demand.
The output should be:
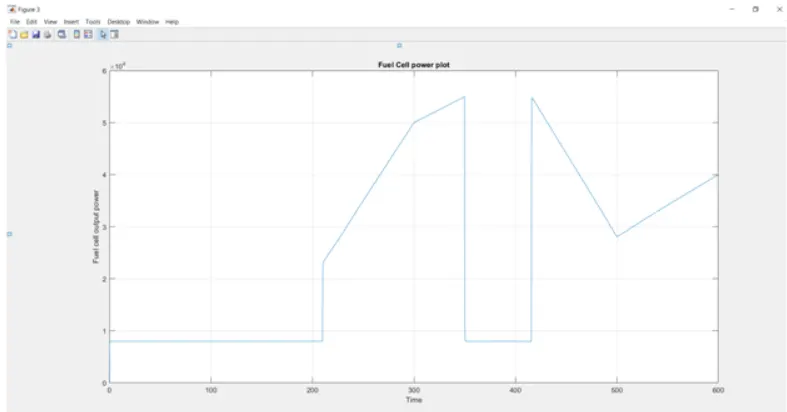
- Fuel cell power
- Battery power
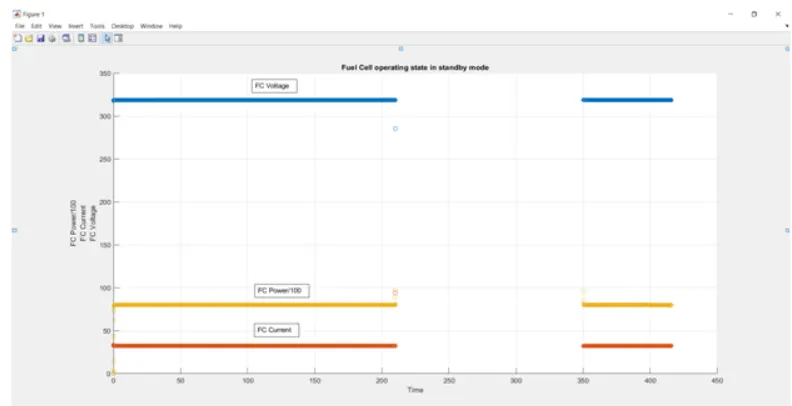
- FC Operating state (running, standby)
Create plot of these outputs against time.
Ans:
Conisderation for referance power is 80 kW FC system.
The operating range of 80 kW fuel cell can be used here in this example.
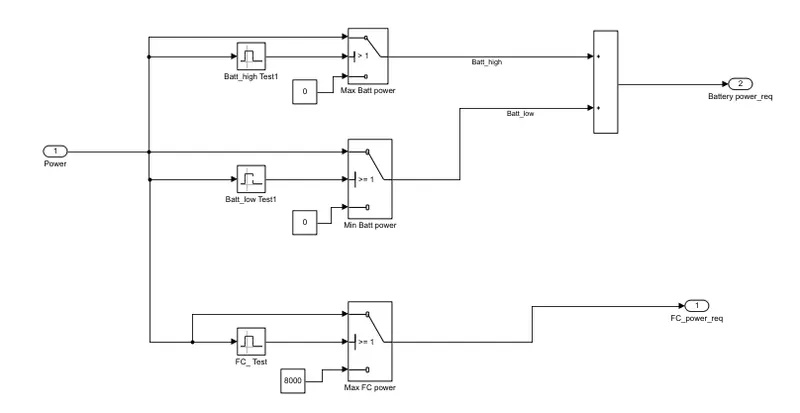
from the datasheet Fuel cell operaing range will be 23 -55 kW.
above and below will supported with battery system (to take care of intial and during operation peak load and load variations)
1. Simulink modelling:
there are mainly 3 subsystems involved.
1. Fuel cell
2.Power source selection
3.Battery system model
Fig1: Control logic flow
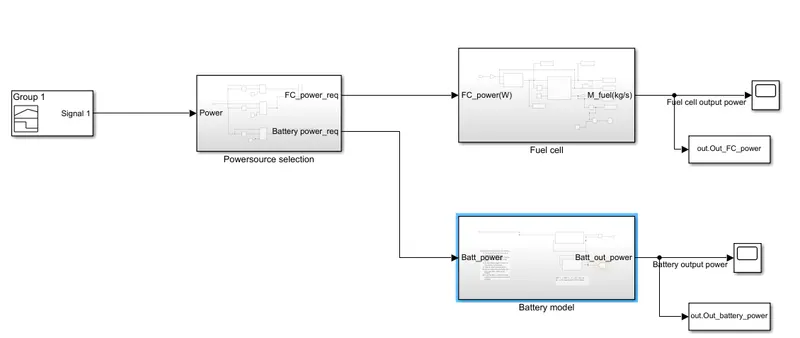
Fig2: Powersource selection:
3. Fuel cell modelling
Fuel cell modelling
Modelling and optimisation are useful tools because they often result in substantial
savings in design cost and cycle time and better system design and operation. Fuel
cell models allow one to explore the many interacting and complex phenomena, such as
coupled electrochemical, thermodynamic and transport processes, which are expensive
and time-consuming to study experimentally. If formulated properly, fuel cell models
provide insight into the performance of a fuel cell system and how the performance
can be infuenced. Modelling enables the analysis of feasibility, reliability, protability
and safety in the design phase to ensure that a design works under a wide range of
conditions, even before a prototype is fabricated and tested.
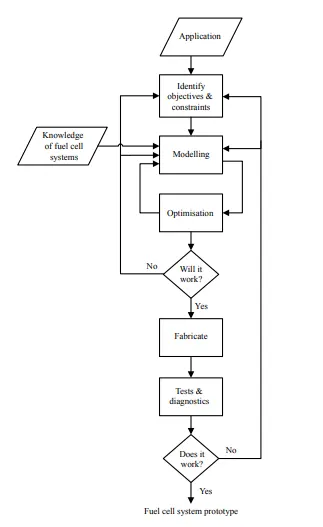
identification of the physical phenomena and to using the correct governing equations.
However, improving robustness and accuracy often involves a sacrifice in computational
efficiency. A good model should exhibit a balance between robustness and accuracy and
computational efficiency.
1. Electrochemical model detail one,
2. using governing equation
Many fuel cell models with different complexity, level of detail and scope have been
presented in the literature. These models can be characterised by approach, state,
system boundary, spatial dimension and complexity or detail (Table 3.1).
Table 3.1: Characteristics of fuel cell models
Category Level
System boundary Cell, stack, system
Approach Empirical, semi-empirical, mechanistic
State Steady, dynamics
Spatial dimension Lumped, 1-D, 2-D, 3-D
Complexity/detail Electrochemistry, transport processes,
thermodynamics, catalysis, fuid dynamics
Fuel cell modelling approaches can either be mechanistic, empirical or semi-empirical.
1.Mechanistic models, also known as theoretical models or physics-based models, are
derived from the physics and the electrochemistry governing the fuel cell phenomena
of interest. They provide a detailed and complex account of the phenomena in the fuel
cells. They are typically represented by a mixture of partial diferential and algebraic
equations. They are useful for the investigation of localised phenomena, for example,
at a pore level, or a single three-phase boundary. However, they are rarely employed for
high system-level simulations because their solution requires long computational times.
Also, their development is laborious and their validation may be difficult. For these
reasons, mechanistic modelling is usually performed on one aspect or region of the fuel
cell only.
2. Empirical models, also called analytical models, are used when the physical phenomena
are difcult to model or are not well understood. Empirical models are developed
based on experimental data and are represented as a correlation between input and
output. Their advantages over mechanistic models are that they are much simpler and
have smaller computational requirements. They are useful for making quick predictions
and provide a fast start into fuel cell modelling. However, empirical models are only
Fuel cell modelling approaches can either be mechanistic, empirical or semi-empirical.
Mechanistic models, also known as theoretical models or physics-based models, are
derived from the physics and the electrochemistry governing the fuel cell phenomena
of interest. They provide a detailed and complex account of the phenomena in the fuel
cells. They are typically represented by a mixture of partial dierential and algebraic
equations. They are useful for the investigation of localised phenomena, for example,
at a pore level, or a single three-phase boundary. However, they are rarely employed for
high system-level simulations because their solution requires long computational times.
Also, their development is laborious and their validation may be dicult. For these
reasons, mechanistic modelling is usually performed on one aspect or region of the fuel
cell only.
Empirical models, also called analytical models, are used when the physical phenomena
are difcult to model or are not well understood. Empirical models are developed
based on experimental data and are represented as a correlation between input and
output. Their advantages over mechanistic models are that they are much simpler and
have smaller computational requirements. They are useful for making quick predictions
and provide a fast start into fuel cell modelling. However, empirical models are only
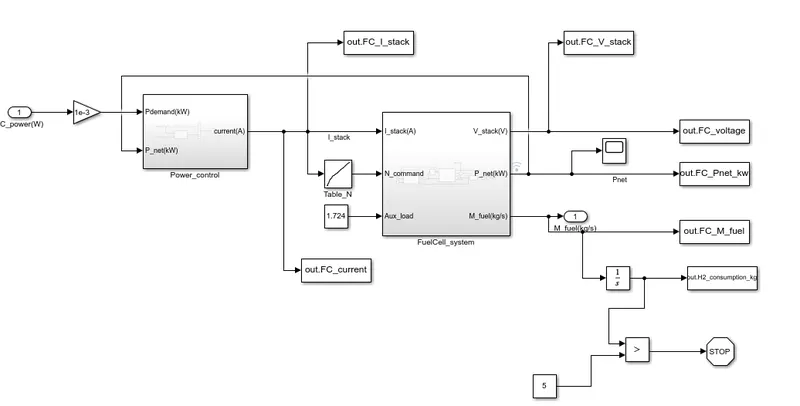
modelling of fuel cell system consist of 3 modules:
1.Air compressor
2.Fuel cell stack
3.feedback control
Actual fuel cell had lot more components other than this one.
2.Compressor model
Fuel cell compressor is to inrease power density and improving efficiency of the fuel cell by increasing A/F ratio.
The increase in power resulting from operating a PEM fuel cell at a high pressure is result of the
reduction in the cathode over activation over voltage. The increased pressure raises the exchange current density. which has apperent effect of lifing open circuit voltage.(OCV)
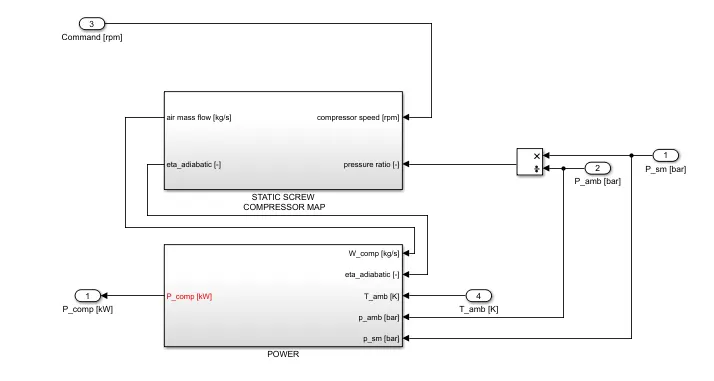
compressor sub mode sub systems:
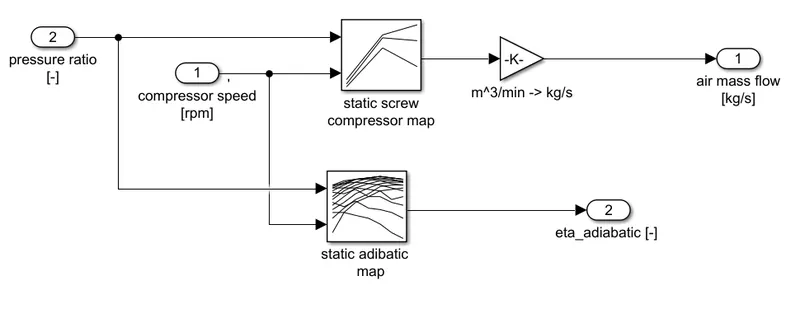
the airflow from compressor depends on the following parameters:
1.Pressure ratio
2.Compressor speed
3.Adiabatic efficiency
Fig - static screw compressor
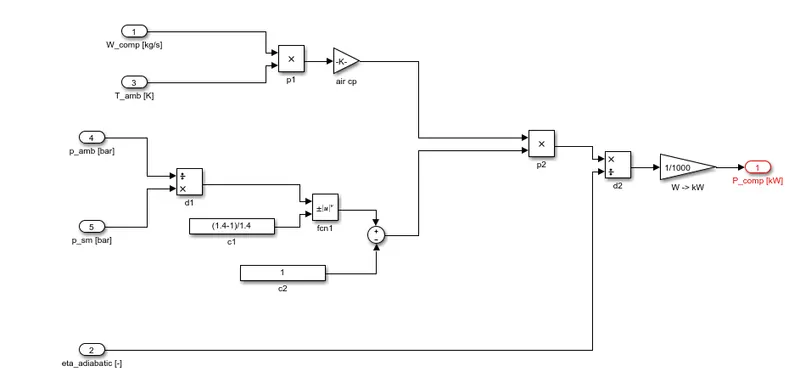
Fig - compressor power calculation:
P_compressor = (W_comp*Tamb*cp) * (P2/P1)^(1.4-1/1.4)/eta_adiabatic
W_comp = air mass flow rate kg/s,
T_ambient= ambient temperature
Cp - specific heat at constant pressue (j/kgk)
P2 - compressor outlet pressure
P1- Inlet pressure
Fuel cell stack subsystem:
1.Stack voltage
2.Air & Hydrogen consumption
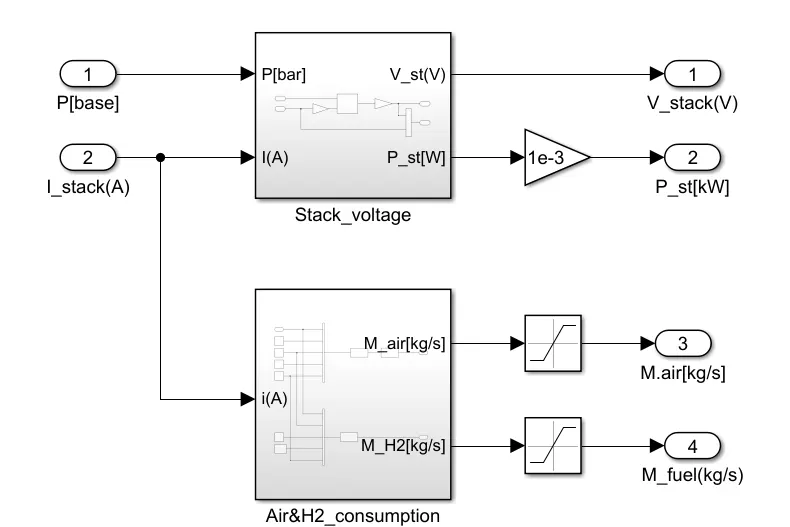
The oxygen consumption is given by:
O2 consumption: (I * AFR * no of cells in series * molar mass of O2 )/ 4F
Wher I = stack current
AFR = Air fuel ratio
Molar mass of O2 = 32e-3
F = faradays constant = 96485
The air consumption is given by ; O2 consumption / (0.21 *32)/(0.21 * 32+0.79*48))
Where approximate air:
0.21O2 + 0.79N2 (mole basis)
The hydrogen consumption is given by
H2 consumption = I * no of cells * molar mass of H2/ 2*FC.mu*F
where FC.mu = Hydrogen utility factor
molar mass H2 = 2*e-3; F - faradays contant
3. Batter model:
3.1 Current calc:
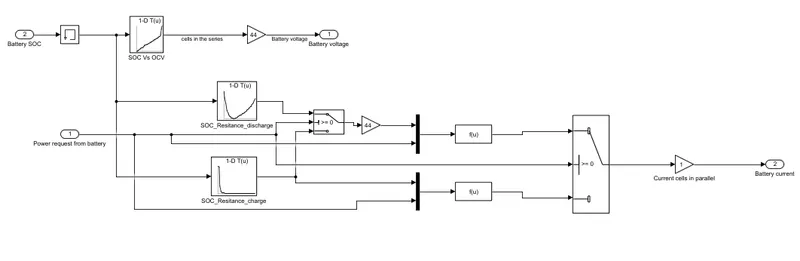
Inputs:
1) SOC
2) Power request from Battery
Output
3) Current
I = \sqrt(Power/R(charge/discharge))
- SOC is calculated from another block forming on the algebric loop
- needs a step delay
- Voltage of the each cell in series adds upto battery pack voltage.
- power and current have the same sign.
- current from all the cells
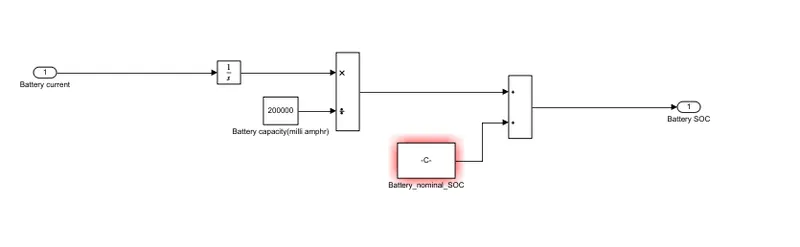
Nominal SOC targets from the battery
- There has to be some room to accept regen power.
- There has to be enough charge to provide acceleration at all times
- So the EMS targets a SOC for the battery to maintain.
- This is called nominal SOC
- this is somewhere between the min. and Max. SOC.of the battery
- E.g if the Max. is 90% and min is 20% nominal could be around 55-60%
SOC(t) = SOC (t-1) + I(t)/ Qn*\delta
Qn - Total Amhr of the battery
Fuel cell output:
Battery output: