Project 1
Create a stateflow or Simulink model for the following flowchart.
Load the .mat file into the workspace.
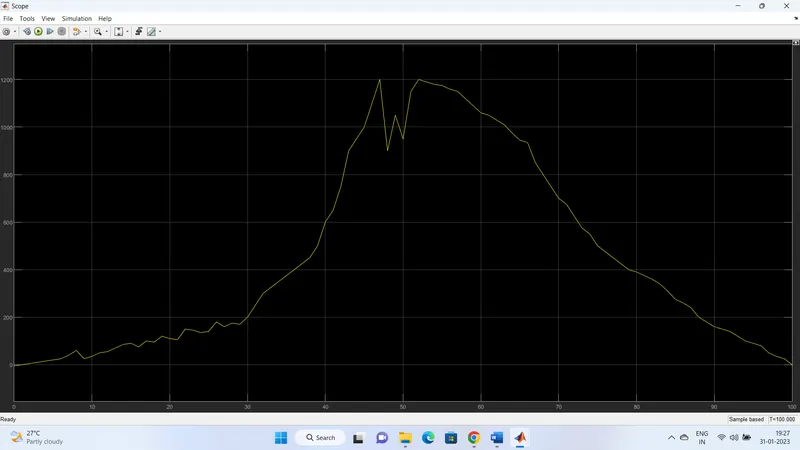
The input to the model would be the power demand.
The output should be:
- Fuel cell power
- Battery power
- FC Operating state (running, standby)
Create plot of these outputs against time.
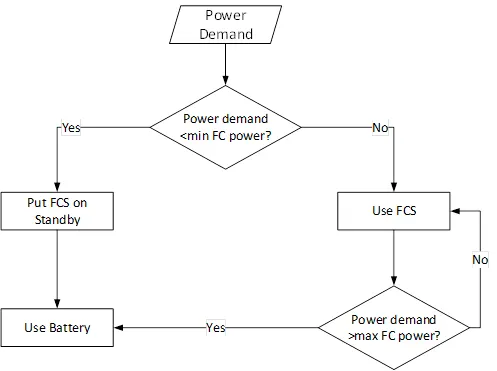
Aim:- The aim of the project is to make the Simulink or Stateflow model for this chart of the energy management system.
Here the Major input is Power demand.
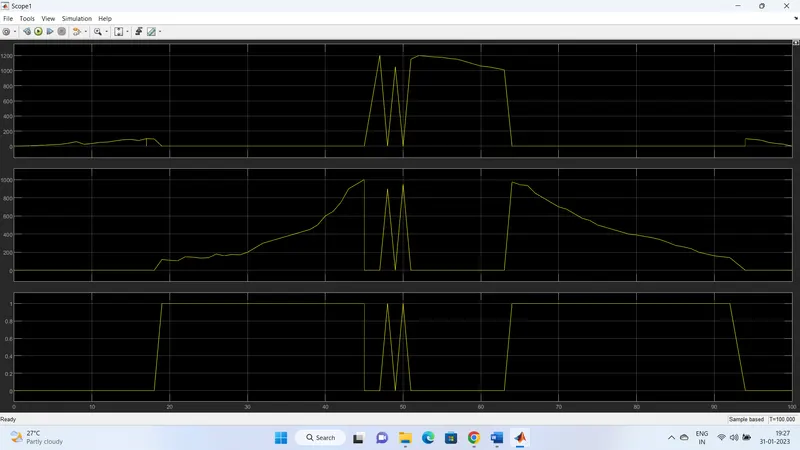
The Desired Outputs are 1) Battery Power, 2)Fuel Cell Power, and 3)Fuel Cell operating State.
Here I had assumed the operating states,
Battery- 0 to 100KW power, Fuel cell-101 to 1000KW, Battery-1001 to 1200KW.
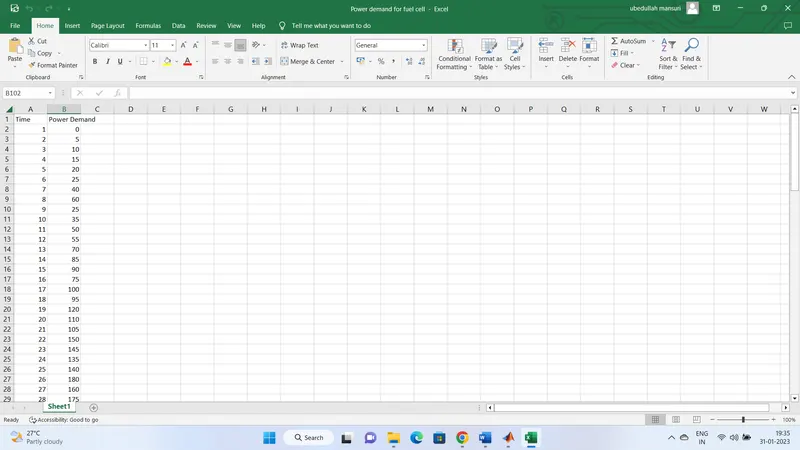
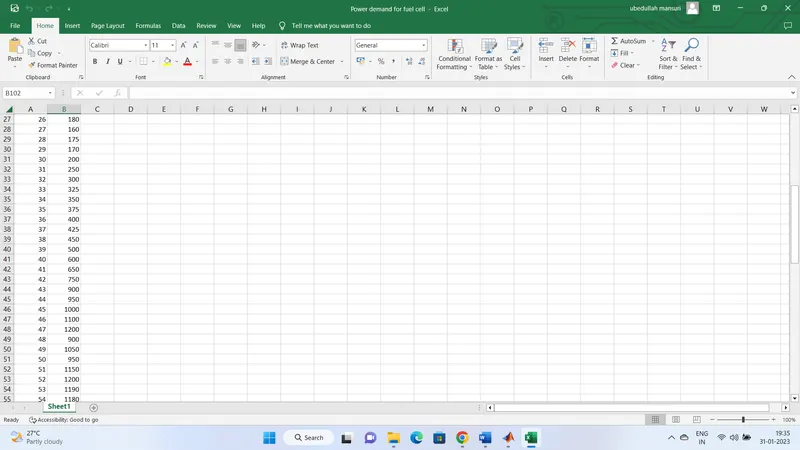
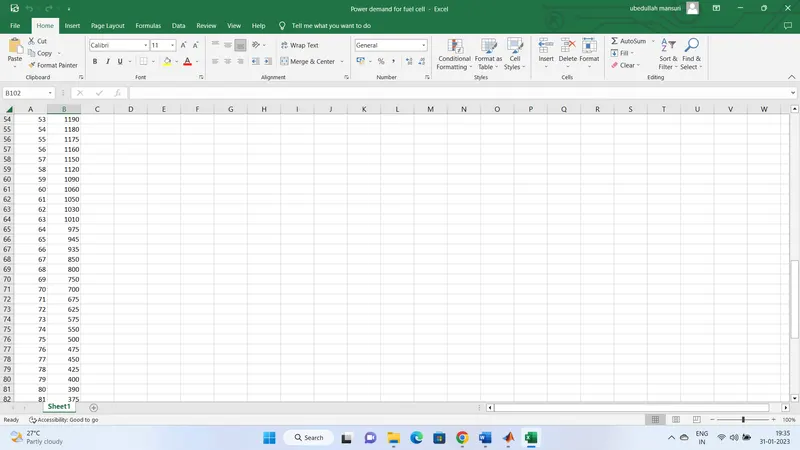
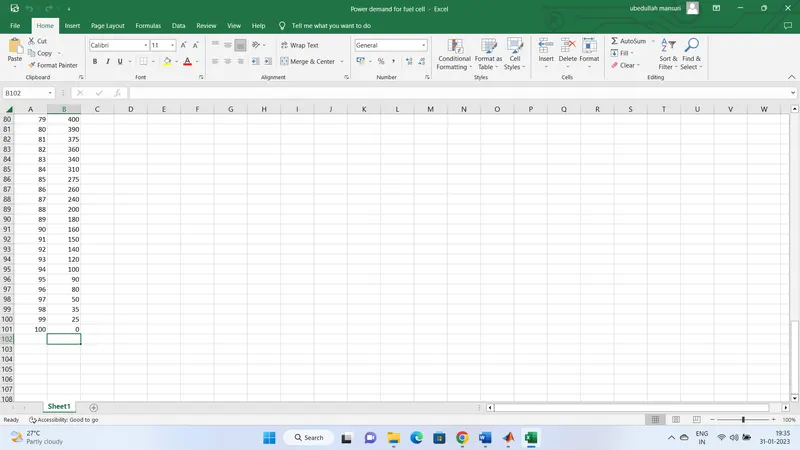
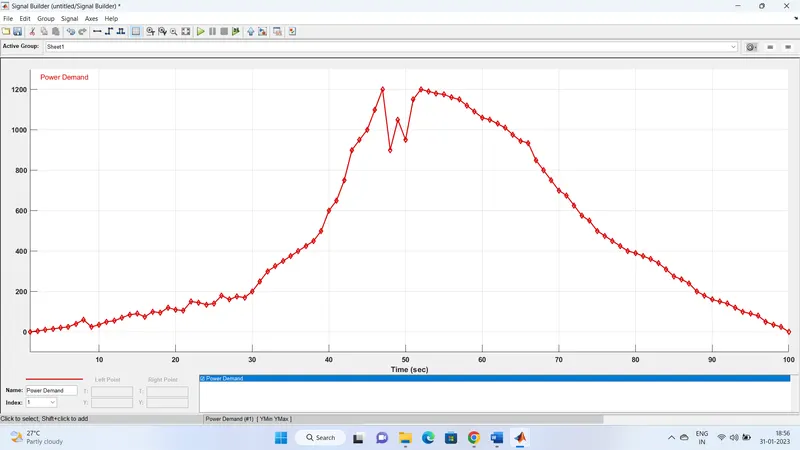
So I created an excel sheet for the same and then load it in signal Builder Block.
The Input is for the time of 100 seconds.
Here we can see the subsystem of the model,
Power demand is the input given,
Here we have used the interval test block to set the upper limit and lower limit,
The blocks used are,
Input, Output, Interval Test, Constant, Switch, Add, Scope, Signal Builder Block, Powegui.
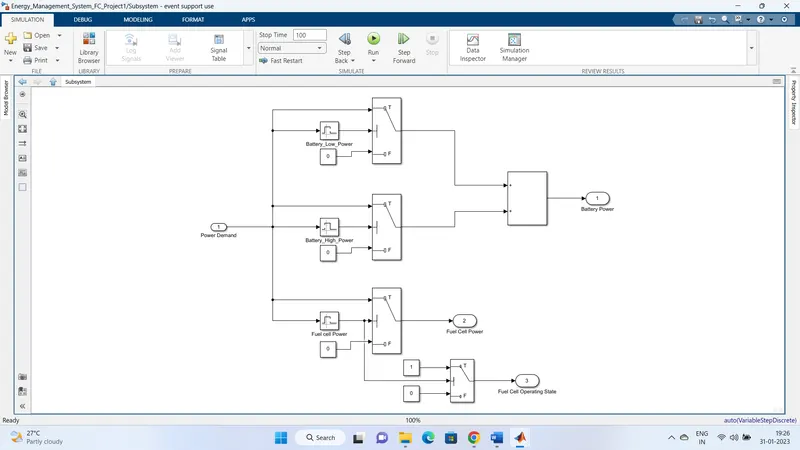
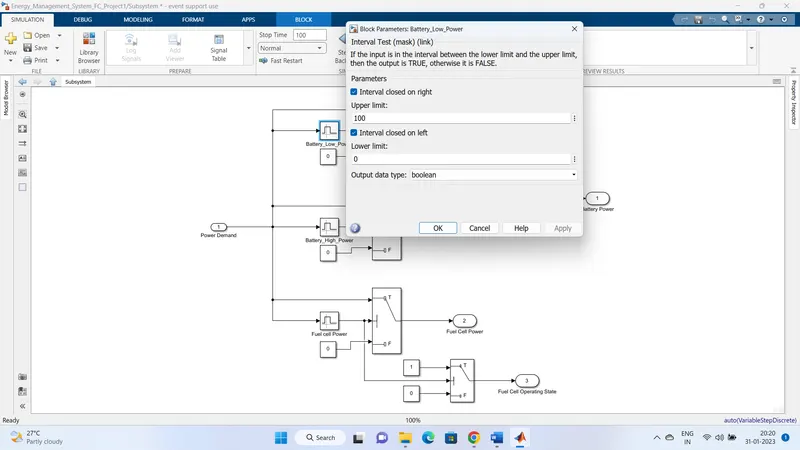
So power demand less than minimum fuel cell power Battery is going to run.The input are given as follows:
So here the Battery operating area is set to 0 to 100 if the power demand is between this limits the battery is working.
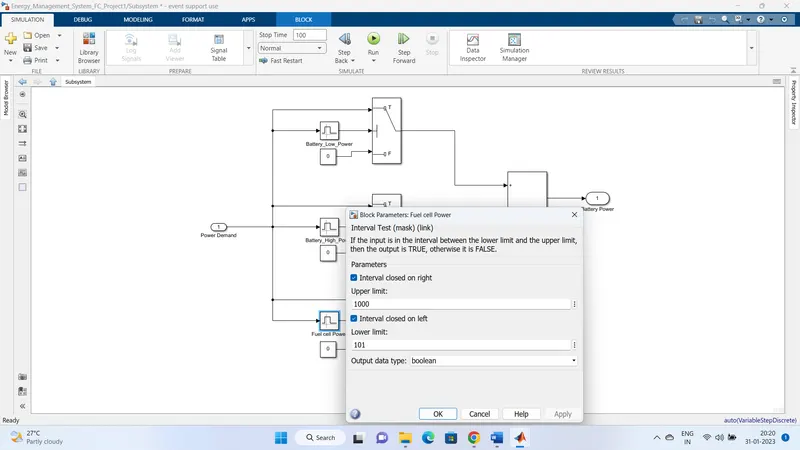
Now When the power demand is from 101 to 1000.The fuel cell is used to drive the vehicle.
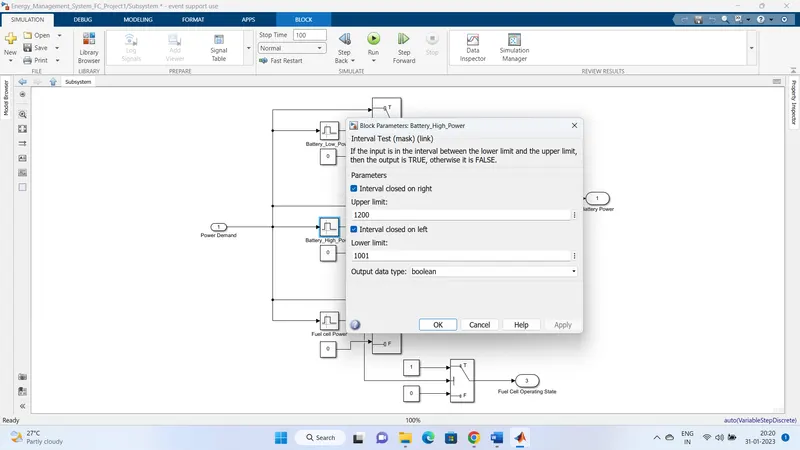
Now when the Power demand is from 1001 to 1200. The Battery is used to drive the Vehicle.
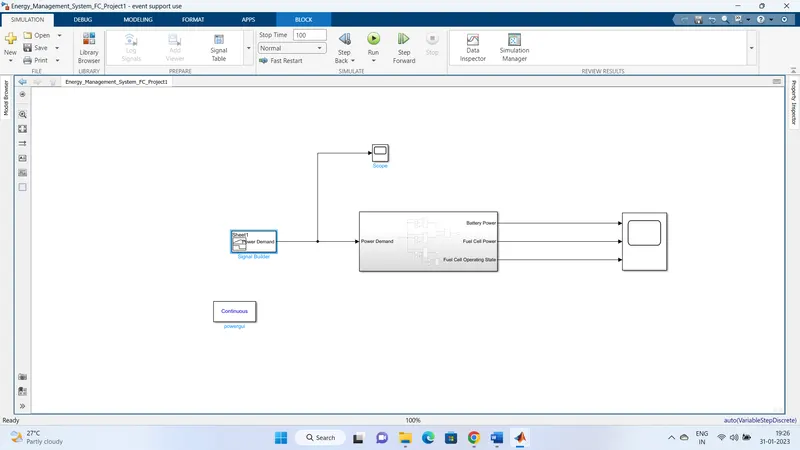
Final Model:
Results:
Power Demand
Battery Power, Fuel Cell Power, Fuel Cell Operating state.