Modelling of EV using MATLAB and Simulink
AIM OF THE PROJECT :-
MATLAB modelling of a electric car which uses a battery and a DC motor by using suitable blocks from powertrain blockset.
THEORY :-
Electric vehicle is a vehicle which uses one or more electric motor or traction motor for its momemtum . It may be powered by the self contained battery , solar panel , fuel cell etc . Matlab modelling uses induction motor and lithium ion battery .
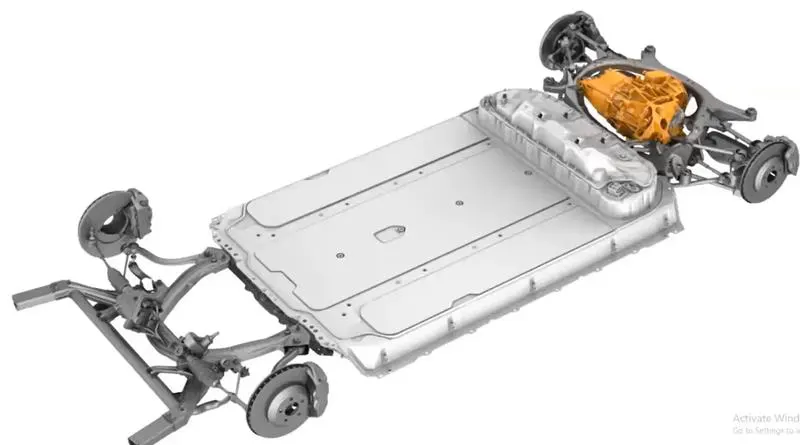
It is an image of real life powertrain of electric vehicle and it includes battery pack , motor , converter which is mounted over the chasis .From the back 18-19th centuries electric vehicles are invented but the manufacture costing of these are very high due to its battery pack by which it is not performing a vital role in now a days . It is ecofriendly . For future its been increasing its efficiency and reducing the cost value.
These are some real life model vehicles designed by different different compnies :-
1.Electric car by siemens - 1904
2.Thomas edition - 1907-1939
3.Tribelhorn - 1902-1919
4.The henny kilowatt - 1961
5.EV-1 GM - 1996
6.Chevrolwt volt - 2007
7.Tesla roadster - 2008
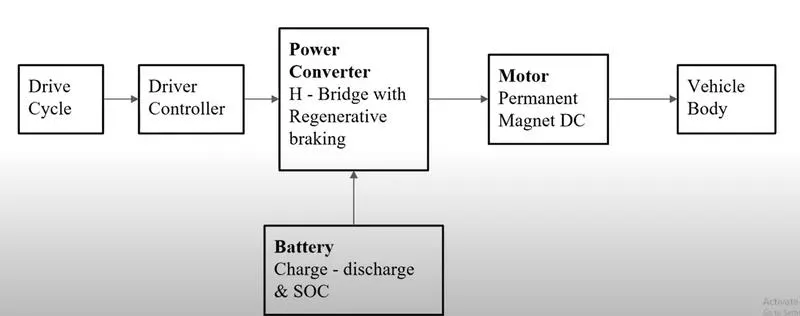
BLOCK DIAGRAM :-
MODEL PARAMETER :-
BASIC PRINCIPLE :-
1.Electric vehicle is powered by an electric motor.
2.Controller energzied the motor.
3.The controller is powered by an array of rechargeable batteries .
COMPONENTS OF ELECTRIC VEHICLE :-
1.Battery :- Main component of the system .
2.Charging port :- It is required to charge the system from an external supply.
3.DC - DC Converter :- It converts the voltage from low to high and vice versa.
4.Motor :- Most important component of the system .
5.Power electronics componnet :-They manage the flow of energy .
6.colling sysytem :-It helps in cooling the system.
7.Transimission system
TYPES OF EV :-
There are mainly three types of vehicles we are following :-
1.BEV - Battery electric vehicle
2.HEV - Hybride electric vehicle
3.PHEV - Plug-in Hybride electric vehicle
And many other types of vehicles also there .
SYSTEM LEVEL CONFIGURATION :-
BLOCKS USED IN SIMULINK OF AN ELECTRIC VEHICLE :-
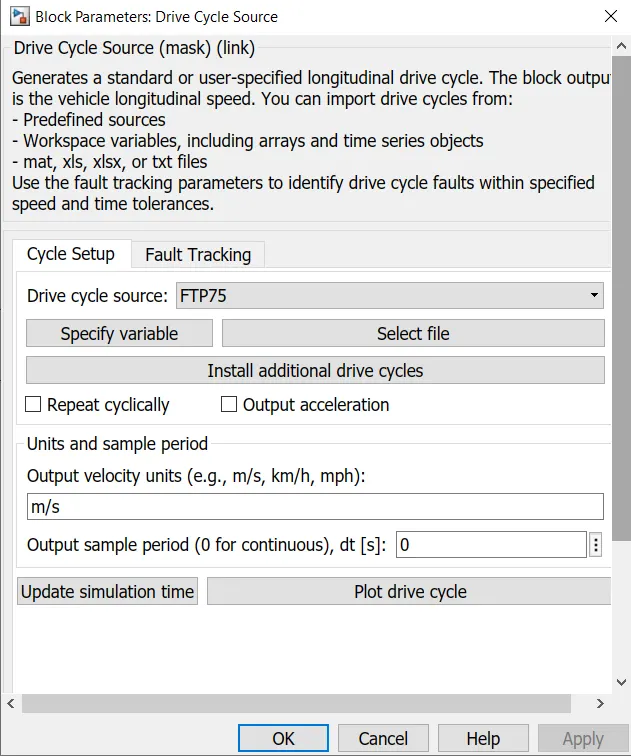
Drive cycle :- Here,i have used FTP75 for the operation by keeping all the parameter as default as shown below.
Drive cycle is shown below :-
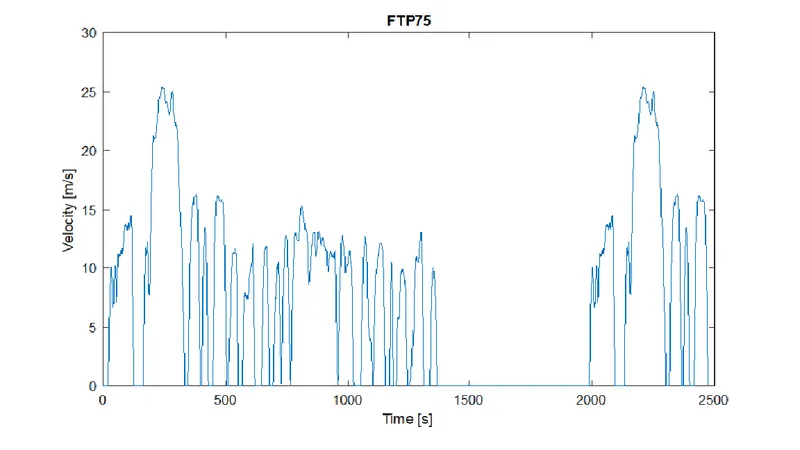
It has a maximum velocity of 25.30 m/s.
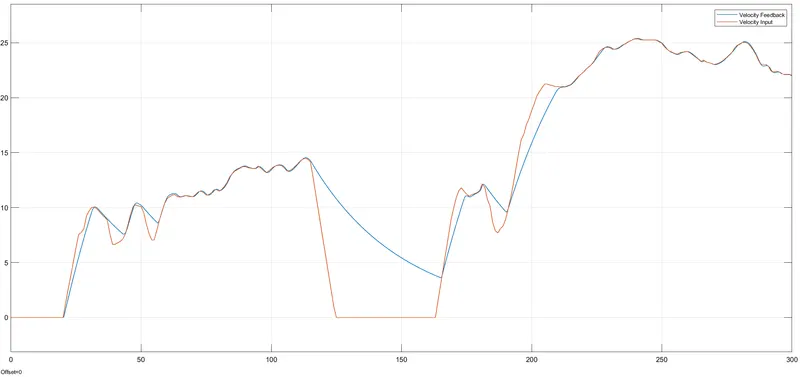
Then the drive cycle is connected to the velocity input where we provides input for the system and it represented by the graph as here we use a scope for this.
Now the input is given to the longitudinal driver block (VelRef) and the grade is grounded zero as here we are taking a case of smooth surface.
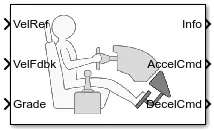
This block is based on the reference and feedback velocities and it works like it generates some acceleration and breaking command . It shows the dynamic response of the driver . It consist of six ports as shown in the figure.
Reference is given by the input velocity and the feedback is also the speed taken from the sub system through a PS simulink converter.
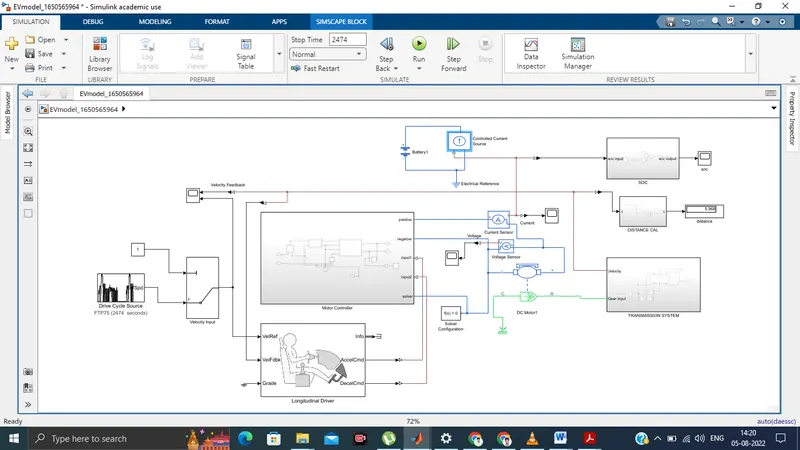
Then we connected this block to the motor contoller block where the accelertion and deacceleration are connected to the controlled voltage source blocks ,which simnontaniously connected to the PWM block where we modulate the input signal and it is then connected to the H bridge block . Connection are done as per required like PWM to PWM in both the block PWM and H bridge block .Reference in blocks are connected to the electrical references . A solver block is used to slove the following equations.
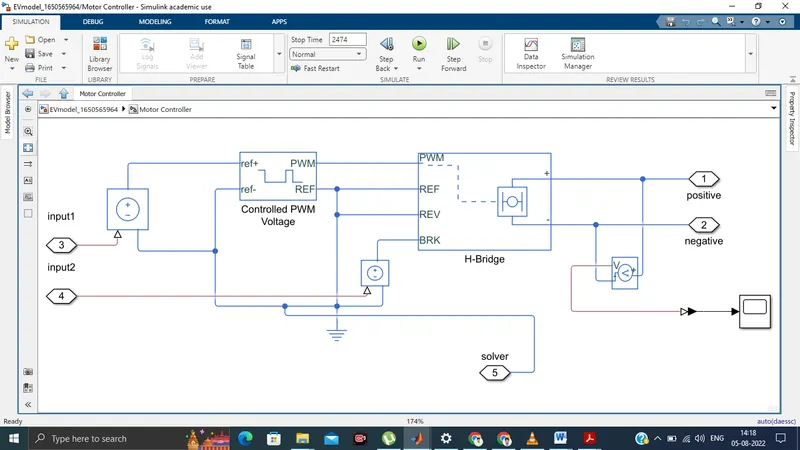
The controlled PWM voltage block gives the modulated voltage signal Where PWM is connected to the PWM of H - bridge and positive to positive and same in negative . References are connected to the electrical reference in both the blocks . Simontaniously other connections are also done . Here we changed the PWM frequency to 50Hz , remaining all other parameter as default.The H - bridge is driven by the PWM voltage block and connections are done . Two output port of H bridge is connected to a DC motor ,also the positive output of bridge is connected to a controlled current sensor and negetive by a voltage sensor .
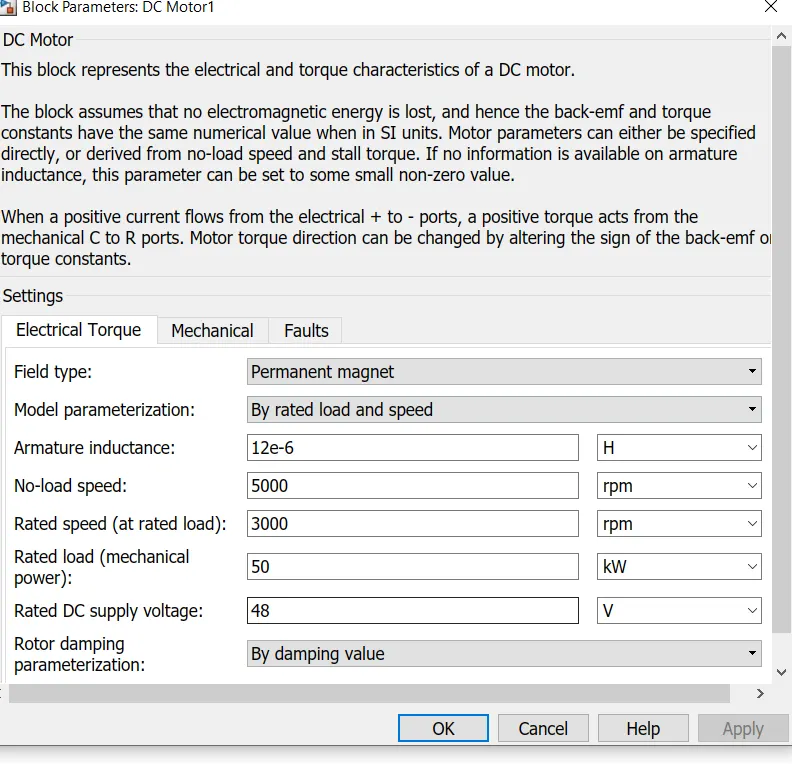
DC Motor - This block represents the electrical and torque characteristics. In this block blue part represents to electrical part and the green part reprsents the mechanical part .
After this The R port of the machine is connected to the subsystem created called transmission line . The subsystem block consist of vehicle body , tyre , gearbox , scope and some constants. Here four tyres are used as per normal vehicle process and a vehicle body block is used for its control.It has six ports like for rear tyre and front tyre , for gradeability , wind velocity port etc . It is connected to four tyres and here we are taking zero values to the grade port and wind velocity port . H port is connected as follows and we connected gearbox with the rear tyre assuming (rear tyre drive). Now the gear input is connected to the DC motor and the velocity port is connected to a distance calculator using PS - smulink converter.
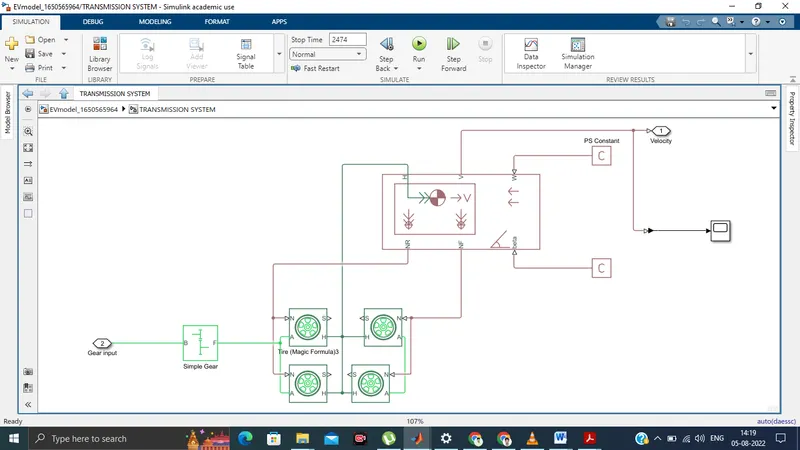
Here the velocity from this port is given as feedaback in the longituidinal driver port as we know close loop system is more stable .
BATTERY :-
The battery is connected to the controlled currrent source which later connected to the electrical reference ans SOC port through a PS Simulink converter .It is the main power source in this model . Here we taken the charging capacity of the vehicle to infinity and the nominal voltage to 80 V and current source value as default.
The SOC part shows the battery capacity left in the system after some uses.
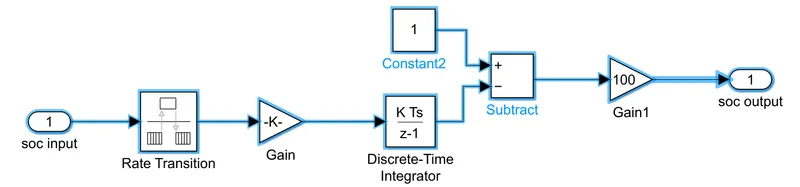
Scope is connected to it observe its output.
SIMULINK MODEL :-
RESULTS:-
Input velocity and feedback velocity:-
Here we can observe that the two lines overlapping to each other where as red line is the input velocity and the blue one is feedback velocity and maximum spped is 25.30 m/s.
Voltage :-
Current :-
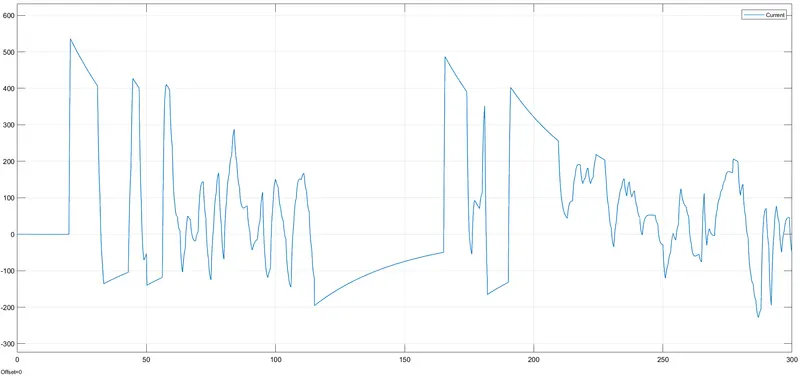
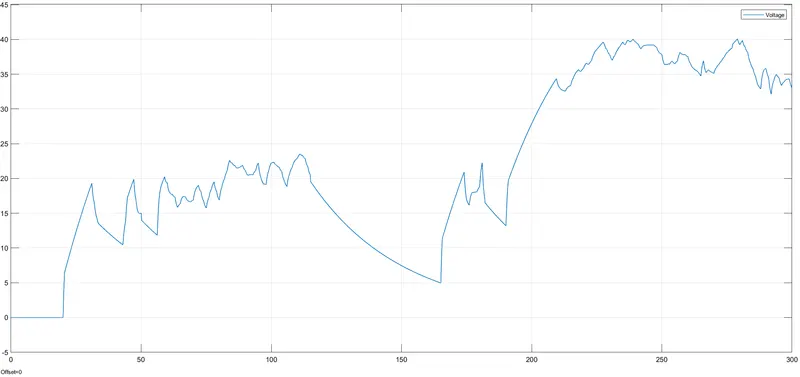
It is the flow of current from battery to the motor for the given drive cycle. Up spikes are for acceleration as it required more current similarly down spikes for deacceleration.
SOC (State of charge):-
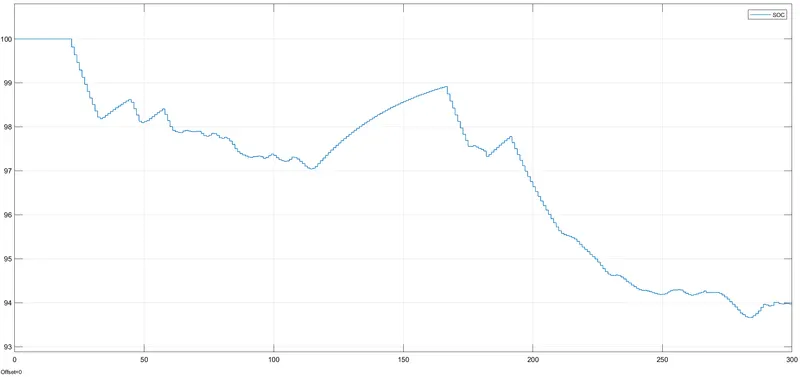
As here we can see that some ups and dips , the overall charge of the battery is decreases but while breaking (Regenerative) we can see that the battery starts charging .
It is the ratio of current charge to the rated battery capacity.
Distance :-
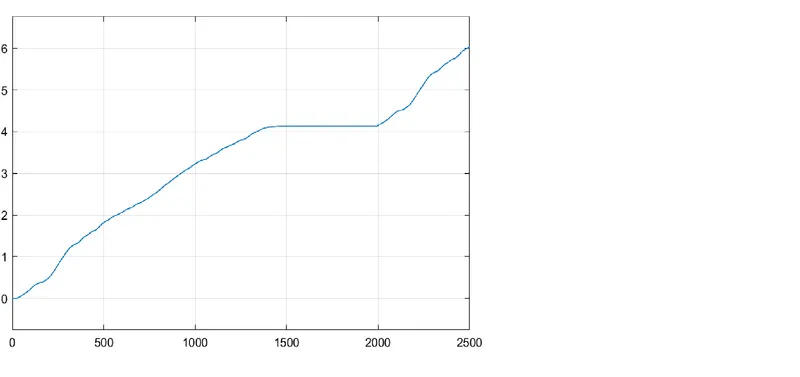
Here we run the simulation for 2500 sec and the distance travelled by the vehicle in this time period is shown and it is 6.022km.
CONCLUSION:-
1.Here , the model has been runned and simulated for the given drive cycle .
2.We observed that the system is dependent upon some parameter like drive cycle , input voltage , battery modelling etc.
3.It has very low run time.
4.Cheked the distance travelled by the vehicle.
5.Vehicle weight is inversely properstional to the maximum speed and many factors affects it.