Modelling of Battery Pack
Aim: Compare 3S4P AND 4P3S battery pack configurations and comment on the results.
Procedure:
Firstly we need to decide upon which battery block to use out of all available battery blocks in MATLAB. Selection is basically based upon the input parametrs we need to use and the output we want from the model.
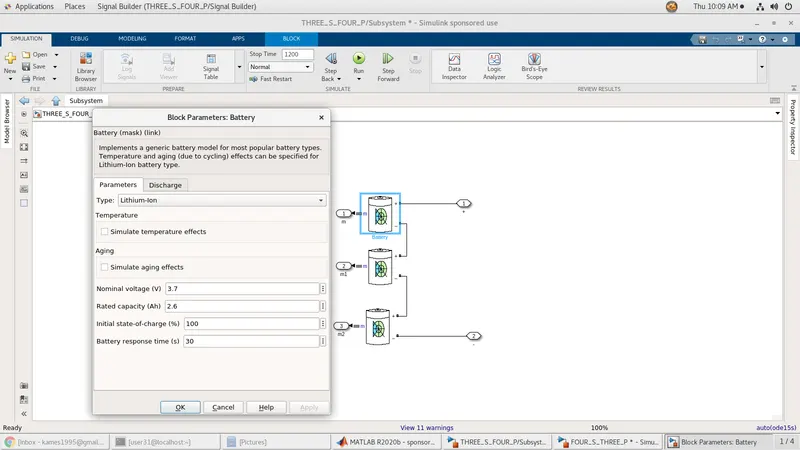
Based on above mentioned criteria i have choosen a generic battery block from power systems library. Now we need to configure this block with all right parametrs of lithium ion battery. Here i have used Specifications of 18650 lithim ion cell which is being mostly used while construction of Battery pack and modeule for available EV.
18650 Cell Features and Technical Specifications
- Nominal Voltage: 3.6V
- Nominal Capacity: 2,850 mAh
- Minimum Discharge Voltage: 3V
- Maximum Discharge current: 1C
- Charging Voltage: 4.2V (maximum)
- Charging current: 0.5C
- Charging Time: 3 hours (approx)
- Charging Method: CC and CV
- Cell Weight: 48g (approx)
- Cell Dimension: 18.4mm (dia) and 65mm (height)
- Capacity: The capacity of a battery or cell is defined as the amount of energy that it can deliver in a single discharge. Battery capacity is normally specified in amp-hours (or milli-amp-hours) or as watt-hours.
- Charge rate or C-rate : The definition of the charge rate or C-rate of a battery or cell is the charge or discharge current in Amperes as a proportion of the rated capacity in Ah. For example, in the case of a 500 mAh battery, a C/2 rate is 250 mA and a 2C rate would be1 A.
- Constant-Current Charge: This refers to a charging process where the level of current is maintained at a constant level regardless of the voltage of the battery or cell.
- Constant-Voltage Charge: - This definition refers to a charging process in which the voltage applied to a battery is held at a constant value over the charge cycle regardless of the current drawn.
- Cycle Life: The capacity of a rechargeable cell or battery changes over its life. The definition of the battery life or cycle life of a battery is number of cycles that a cell or battery can be charged and discharged under specific conditions, before the available capacity falls to a specific performance criteria - normally 80% of the rated capacity.
- Cut-off voltage: As a battery or cell is discharged it has a voltage curve that it follows - the voltage generally falling over the discharge cycle. The definition for a cell or battery of the cut-off voltage cell or battery is the voltage at which the discharge is terminated by any battery management system. This point may also be referred to as the End-of-Discharge voltage.
- Energy Density: The volumetric energy storage density of a battery, expressed in Watt-hours per litre (Wh/l).
- Power Density: The volumetric power density of a battery, expressed in Watts per litre (W/l).
- Rated Capacity: The capacity of a battery is expressed in Ampere-hours, Ah and it is the total charge that can be obtained from a fully charged battery under specified discharge conditions
- Self-Discharge: It is found that batteries and cells will lose their charge over a period of time, and need re-charging. This self-discharge is normal, but various according to a number of variables including the technology used and the conditions. Self-discharge is defined as the recoverable loss of capacity of a cell or battery. The figure is normally expressed in a percentage of the rated capacity lost per month and at a given temperature. The self-discharge rate of a battery or cell is very dependent upon the temperature.
- Specific Energy: The gravimetric energy storage density of a battery, expressed in Watt-hours per kilogram (Wh/kg).
- Specific Power: The specific power for a battery is the gravimetric power density expressed in Watts per kilogram (W/kg).
Lead Acid vs Ni-Cd vs Ni-MH vs Alkaline vs Li-ion vs Li-Polymer Batteries
|
Parameter |
Lead Acid |
Ni-Cd |
Ni-MH |
Alkaline |
Li-Ion |
Li-Polymer |
|
Cell Voltage |
2V |
1.2V |
1.2V |
1.5V |
3.6V |
3.7V |
|
Cost |
Low |
Moderate |
High |
Very Low |
Very High |
Very High |
|
Internal Resistance (IR) |
Low |
Very Low |
Moderate |
Varies |
High |
Low |
|
Self Discharge (%/month) |
2% to 4% |
15% to 30% |
18% to 20% |
0.3% |
6% to 10% |
5% |
|
Charge Cycle |
500 to 2000 |
500 to 1000 |
500 to 800 |
Low |
1000 to 1200 |
>1000 |
|
Overcharge Tolerance |
High |
Medium |
Low |
Medium |
Very Low |
Very Low |
|
Energy Density (Wh/kg) |
30 to 45 |
45 to 50 |
55 to 65 |
80 |
90 to 110 |
130 to 200 |
|
Memory Effect |
No |
Yes |
Yes |
Yes |
No |
No |
|
Maintenance |
Very High |
High |
Low |
Low |
Low |
Low |
|
Safety |
Highly Safe |
Safe |
Safe |
Safe |
Un-Safe |
Un-Safe |
The selection of lithium ion was made based upon data mentioned in above table and our requirements.
Model Preperations:
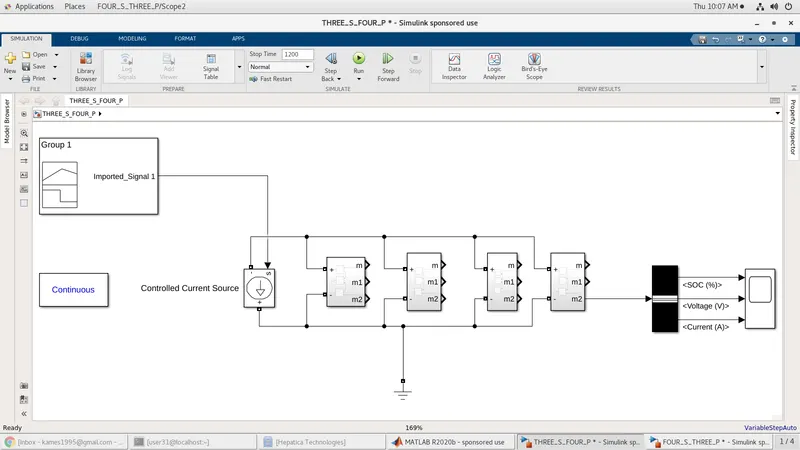
Input for both the signals:
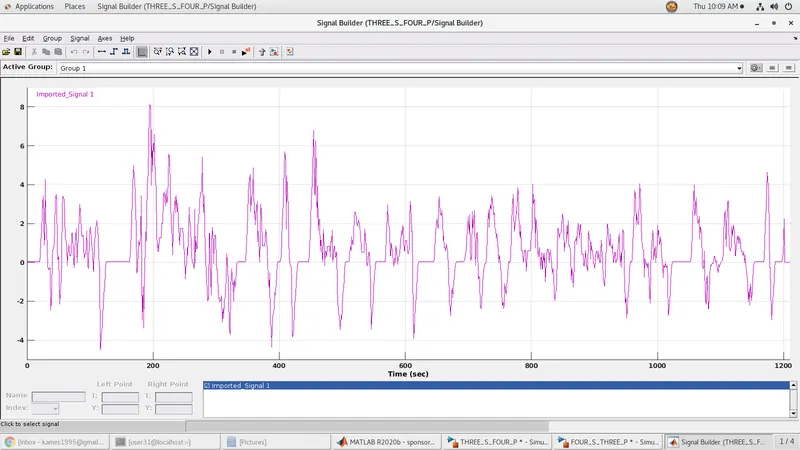
Signal Builder block - Current profile for UDDS drive cycle is used.
1)3S4P
Results:
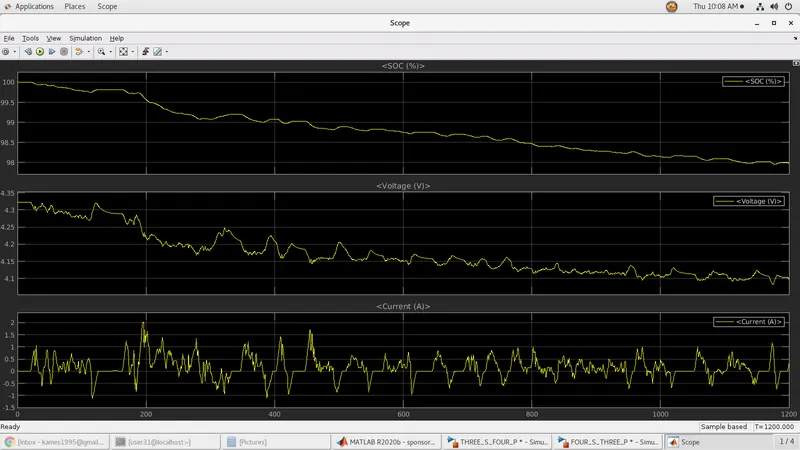
Here we see that total SOC drop of 2% happened means 100% capacity is reduced to 98% after 1200 sec continous usage of battery. And Voltage drop of nearly 0.225V is observed for same running time. And as we see some peaks also in voltage plot it means charging of battery is happening due to Controlled current source properties. It charges battery in CC (Constant current) mode till there we experience -ve current value or we can say during braking. And during this period we can see SOC also being increased with little values.
2)4S3P
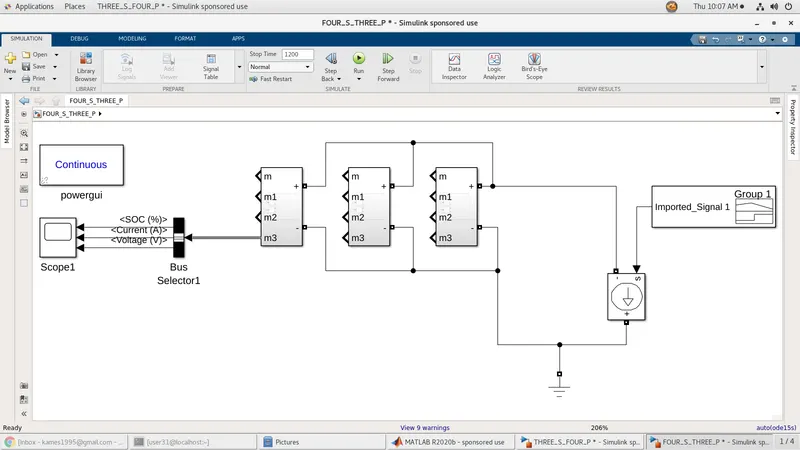
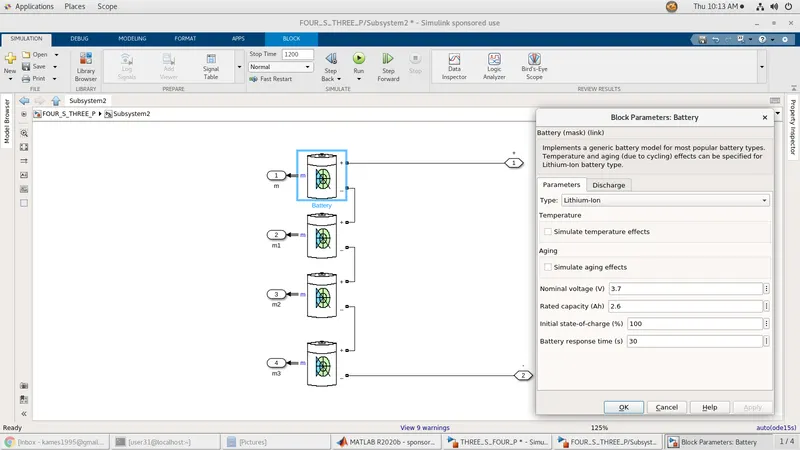
Results:
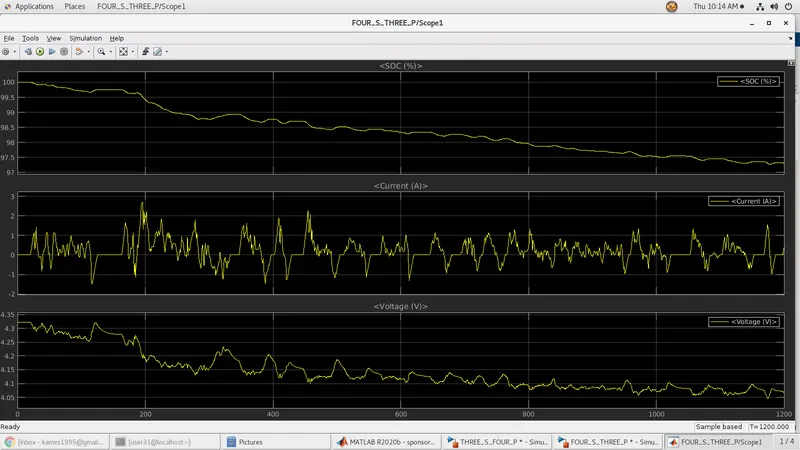
Here also we see that total SOC drop of 2.75% happened means 100% capacity is reduced to 97.25% after 1200 sec continous usage of battery. And Voltage drop of nearly 0.25V is observed for same running time. And as we see some peaks also in voltage plot it means charging of battery is happening due to Controlled current source properties. It charges battery in CC (Constant current) mode till there we experience -ve current value or we can say during braking. And during this period we can see SOC also being increased with little values.
Conclusion:
Both model worked as per expections but with a slight deferrence in drop levels 4S3P configuration showed a little more drop than 3S4P. This would have happened because of lower capacity levels in 4S3P configurations when compared to 3S4P configurations.
C Rate - 1.1304 A.
4S3P :
4*3.7 = 14.8V ; Battery Nominal Voltage
3*2.6 = 7.8AH ; Battery Capacity
Energy Capacity = 115.44 KWH
Total Time of drain = 7.8/1.1304 = 6.9 Hours (Approx)
3S4P :
3*3.7 = 11.1V ; Battery Nominal Voltage
4*2.6 = 10.4 AH; Battery Capacity
Energy Capacity = 115.44 KWH
Total Time of drain = 10.4 /1.1304 = 9.2 Hours (Approx)
Refrences:
https://components101.com/batteries/18650-lithium-cell
https://evreporter.com/know-your-lithium-ion-cells/
https://batteryuniversity.com/article/bu-302-series-and-parallel-battery-configurations