Modelling of 25 storey building with the specified properties using ETABS
- Aim:
To model a 25-storey building using ETABS software and verify the seismic code requirement from ETABS analysis.
Procedure:
- Open ETABS software.
- Click New model.
- Give model initialization setting as follow
- Click ok
- In the new model quick template dialog box , select custom grid spacing and click Edit grid data
- Give the following settings in grid system data dialog box.
- Click ok.
- Select custom story data under story dimension and click edit story data.
- Give the story data for first- three story as follow having story 1 as master story.
- Write click on the first column and select add story and click keep existing story heights.
- Give number of added story as 22
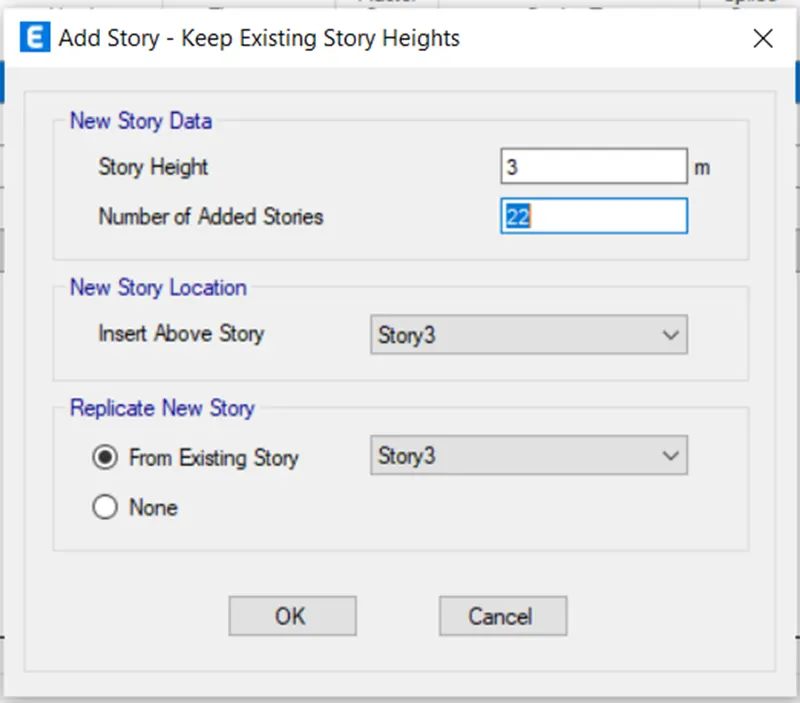
- Click ok
- The following page opens
- Click Define--> Material properties
- Click Add new material for assigning concrete
- .
- Click Add new material for assigning Rebars
- Click ok
- Click Define--> Section properties--> Frame sections.
- Select Add new property in the dialog box.
- Select the concrete shape as rectangular and give the following settings for the Beam
- Beam property is added.
- Again, click Add new property for creating property for column.
- Column property is added.
- Click--> Section properties--> Slab section
- Select Add new property and give the following settings.
- Clickà Define--> Load pattern
- Define load patterns by its name
- Click Define--> Mass source
- Check load cases by click Define-->Load cases.
- Create load combinations, Define--> Load combinations
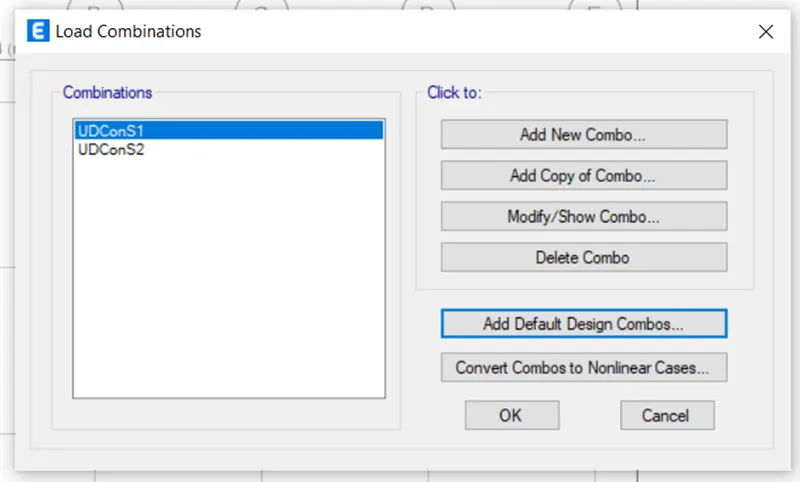
- Create Columns by Quick draw column.
- Select quick draw beams.
- Select the first horizontal and vertical beams and go to edit and select replicate.
- Select first floor in plan view
- Draw slab using quick slab by having similar stories in the status
- Select all the beams from select tab
- Assign frame loads as distributed from assign tab.
- Select the slabs
- Assign shell loads as uniform
- Select the slabs from select tab and assign as
- diaphragm from assign tab.
- Click run analysis in the panel after saving the file.
Result:
- Click Display -->Story response plot. Change the display type to Maximum storey drift and desired combo to see the plots.