Modelling and Simulation of flow through an Air Flow-bench using SolidWorks
Aim: To Simulate the flow inside Air Flow-bench for varying valve lift
Objectives:
- Performing a parametric study on three grid sizes at a particular valve lift to determine the best grid/mesh.
- Performing a parametric study on varying the valve lift/opening and studying the effect of the same on the mass flow rate.
Introduction:
An air flow-bench is a device used for testing the internal aerodynamic qualities of an engine component and is related to the more familiar wind tunnel.[1]
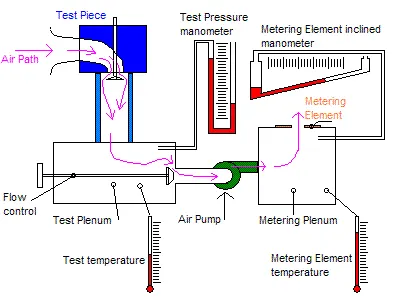
Flow Bench schematic [1]
It is used primarily for testing the intake and exhaust ports of cylinder heads of internal combustion engines. It is also used to test the flow capabilities of any component such as air filters, carburetors, manifolds, or any other part that is required to flow gas. A flow bench is one of the primary tools of high-performance engine builders.[1]
A flow-bench needs a source of airflow, a system to measure the actual airflow, a method to control the test pressure of air being applied, and an area to mount the device under test. The test piece is mounted and a certain pressure, called test pressure is applied to it and the resulting airflow measured.[2]
Geometry:
|
Front View (Cut Section) |
Isometric-View
|
Problem Specification:
- Inlet Diameter: 25 mm
- Outlet Diameter: 100 mm
- Valve geometry dimensions:
- Fluid: Air
- Viscosity: 1.81e-5 Pa-s
- Density: 1.225 kg/m^3
- Fluid cells/mesh size: Varying size of 3, 4 and 5 in automatic mesh for parametric study
- Type of Flow: Steady, Internal
Boundary Conditions:
- Inlet Velocity: 50 m/s
- Outlet Pressure: 1 atm (101325 Pa), Static
- Wall: Default ideal condition
Mesh/Grid Parametric Study for valve lift of 2mm:
- Input Variable: Level of the initial mesh ranging from 3 to 5.
- Output Parameters: Outlet Mass Flow Rate, Cut Plot of Velocity
- Scenario screenshot:
Results:
Velocity Cut Plots:
Design Point 1 (Mesh level = 3):
Design Point 2 (Mesh level = 4):
Design Point 3 (Mesh level = 5):
Goal Table for Outlet Mass Flow rate (kg/s):
The negative sign for the mass flow rate indicates that the flow is leaving at the exit.
Reverse Plot of Goal for Outlet Mass Flow rate (kg/s):
Interpretation of the Mesh Level Parametric Study:
- From the velocity contour plots, we can observe that the maximum velocity increases with an increase in the mesh level. It can be observed that the velocity does not increase drastically from mesh level of 3 to 4, but is largely different when mesh level is set to 5.
- In addition, it can be observed from the mass flow rate table and plot the flow rate is almost the same for the mesh level of 3 and 4 whereas it is significantly higher for mesh level of 5.
From the above observations, the mesh level of 5 seems to provide better results than 3 and 4. For this reason, further analysis is done with a mesh level of 5. This can be seen in the figure below.
Valve Lift Parametric Study for Mesh level of 5:
- Input parameter: Valve lift dimension varying from 1mm to 8mm with 6 design points.
- Output parameters: Outlet Mass Flow Rate, Cut Plot of Pressure, and Velocity Flow Trajectory
- Scenario Screenshot:
Results:
Pressure Cut Plots:
|
Design Point 1 (1mm) |
|
||
|
|
||
|
|
Goal Table for Outlet Mass Flow rate (kg/s):
The negative sign for the mass flow rate indicates that the flow is leaving at the exit.
Reverse Plot of Goal for Outlet Mass Flow rate (kg/s):
Interpretation of the Results from the Valve Lift Parametric Study:
- The maximum pressure in the domain decreases with increase in the valve lift dimension.
- The outlet mass flow rate decreases with increase in the valve lift dimension.
Conclusions:
There is improvement in the results as we increase the mesh/grid level and make the mesh finer. A similar study can be carried out for more advanced mesh and the results can be interpreted for the same. The optimum mesh size would then be determined where the results do not change significantly with further mesh/grid refinement.
The inlet pressure decreases with the increase in the valve lift. This is due to the variation in the pressure difference as the valve lift varies.
From the outlet mass flow rate table and the plot for the valve lift parametric study, it can be seen that the value of flow rate does not change significantly for design points 4,5 and 6. This indicates that; for valve lift of 5.2mm, 6.6mm, and 8mm; there is no significant variation in the flow rate. Hence, we can conclude that further lift of the valve beyond 5.2mm (Design Point 4) is not required. As a result, the valve lift at the 4th Design Point can be considered the optimum dimensional value.
References:
- Air flow bench; From Wikipedia, the free encyclopedia; https://en.wikipedia.org/wiki/Air_flow_bench
- Flowbench Design Guide; DTEC; http://dtec.net.au/Flowbench%20Design%20Guide.htm