Modelling and simulation of flow through a flowbench
FLOWBENCH SIMULATION
AIM:
- To Simulate flow bench test.
- To calculate the "mass flow rate" at the inlet port of the cylinder
- To visualize the Fluid trajectories.
THEORY
- Flowbench is an experimental setup used to evaluate the fluid flow characteristics within the component (valve, nozzle, airfilters etc) and it gives the parameter values, which are critical in designing that component.
- Flowbench, basically consist of air pump and metering element (to measure pressure, temperature etc.) with some control devices.
- In CFD simulation we can simulate the air flow through the component to evaluate the fluid flow charcteristics within the component similar to FLOWBENCH setup.
- Engine intake valve is the best example to conduct flowbench simulation.
- Engine intake valve is responsible for intake of air mixture into the combustion chamber and its performance is evaluated by how well it imparts swirl and tumble motion to air.
- Swirl (rotation about axis of cylinder) and tumble motion (rotation perpendicular to the axis of cylinder), these motion is responsible for better mixing of air and fuel (to get homogenous mixture).
- Combustion of Homogenous mixture gives complete combustion and hence higher effeciency.
WORKING
- In this project, a roughly designed inlet port of the engine cylinder 3D model is used to show the flow bench simulation.
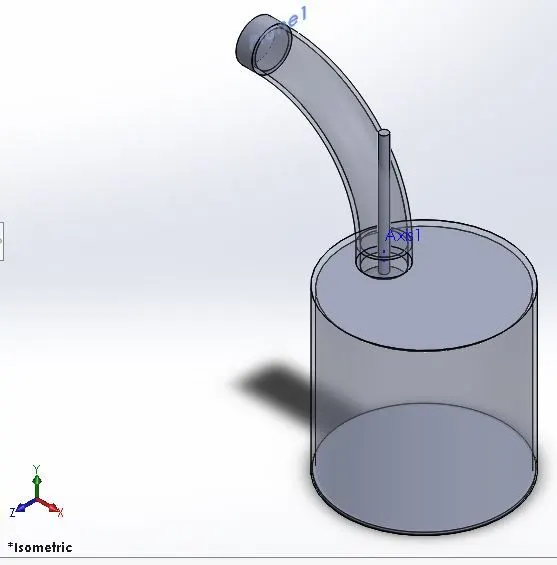
- Lids are created to define the fluid domain
- This CFD simulation is internal flow, air is selected as fluids
- Boundary Conditions are total pressure(101325*5 pa @ inlet lid) and static Pressure (101325*0.75 pa at outlet Lid)
- Since in Engines air is drawn into the cylinder due to decrease in pressure in the cylinder
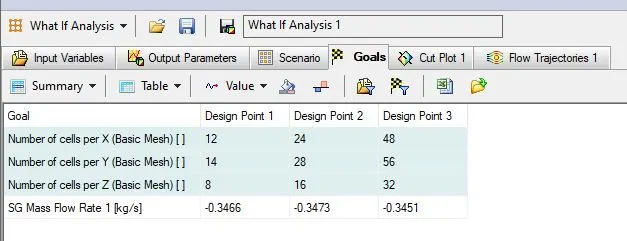
- Basic mech consist of cells in direction X=12, Y=14, and Z=8
- This flow bench simulation is divided into two parts
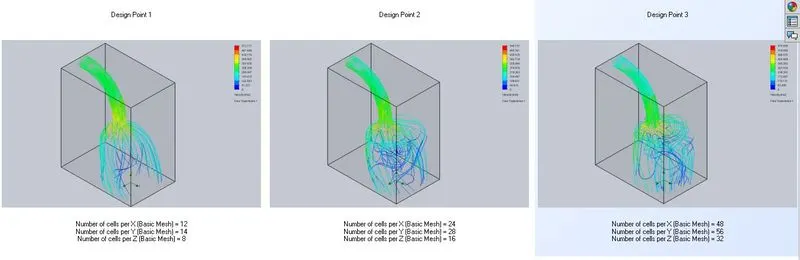
- The first part is the "Grid Dependency Test", Here the mass flow rate of the inlet port at maximum valve lift condition is simulated by increasing the number of meshing grids. The best meshing result is selected for the second part,It consist of 3 design Points.
- In the second part for different values of "valve lift" corresponding mass flow rate, pressure profile, velocity profile, and fluid trajectories are obtained to visualize the performance of the inlet valve.
RESULT
- Grid dependency result shown, the flow trajectories of fluid seems to be well defined as the grid numbers increases, hence in grid dependency, higher grid cells lead to better visualization of the results
- Hence higher grid cells (X=48, Y=56, and Z=32) are selected for valve lift simulation
- It doesnot show any appriciable on the massflow rate value
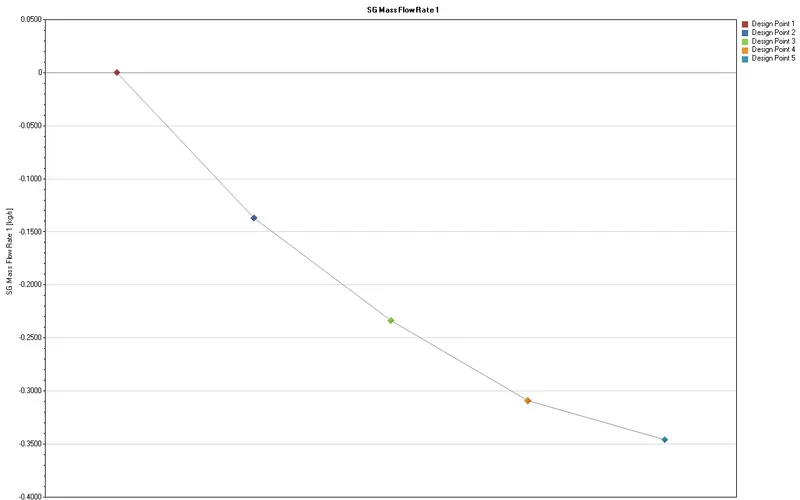
- Mass flow rate versus valve lift obtained through a parametric study and the results are shown below
- Negative means, it is exiting from that point
- Hence as the Valve lift increases from 0 to 0.0075m the mass flow rate also increase
- But between the point 0.005625 and 0.0075m, mass flow rate increases slightly
- Velocity also increases with increase in valve lift

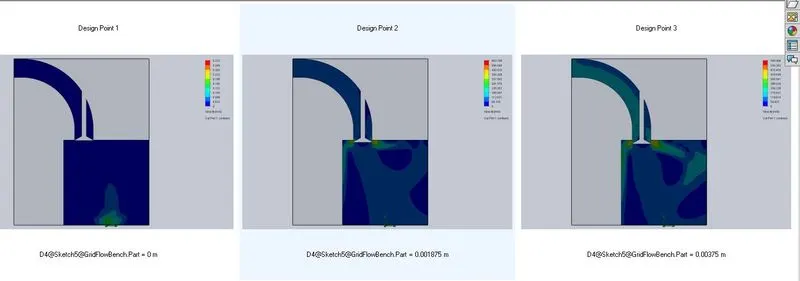
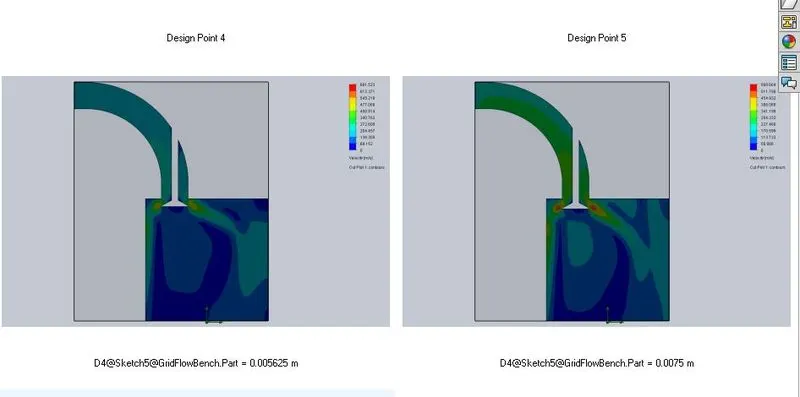
- Velocity Trajectories
- From velocity trajectories it can be seen that, as the valve lift increases, the swirl and tumble action of fluid increases, indicating better mixing of air with fuel
- But between 0.005625 and 0.0075m valve lift, slight decrease in swirl and tumble action.
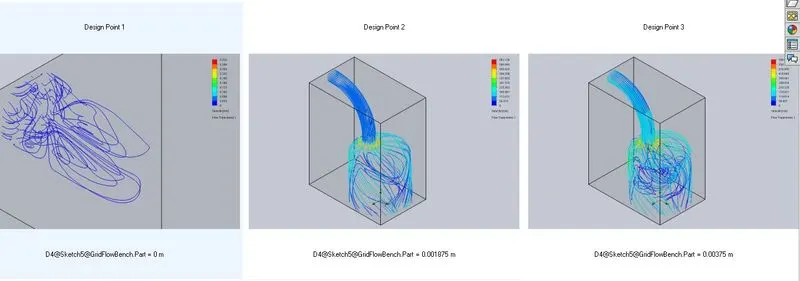
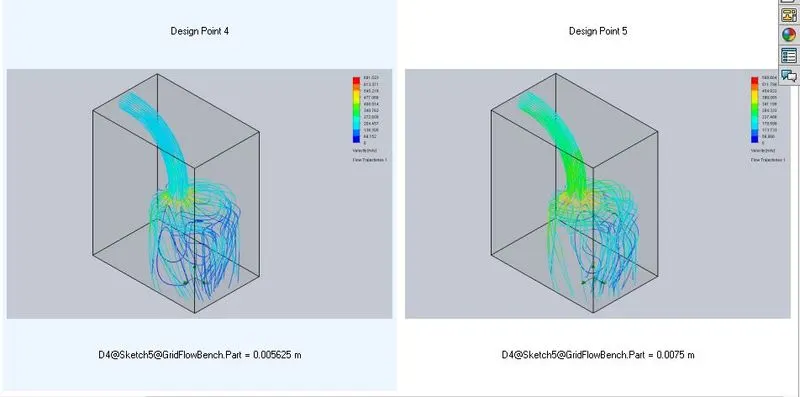
THANK YOU