Modelling and simulation of flow through a flowbench
Objective:
Create a 3D model of a flow bench. Run a parametric study on different valve lift. Run flow analysis and obtaining a plot graph between lift and mass flow rate
Introduction:
A flow bench is a device used for testing the internal aerodynamic qualities of an engine component. It is mainly used for testing the intake and exhaust ports of cylinder heads of the internal combustion engine.
Procedure:
Make a circle and extruded it to make a cylinder. Select the top face of the cylinder and make a circle and select the right plane to make the profile of the intake port, then using the Swept Boss option to make it 3D. Design the valve. Using Shell Command and select inlet and outlet faces and give a minimum thickness.
CAD Model:
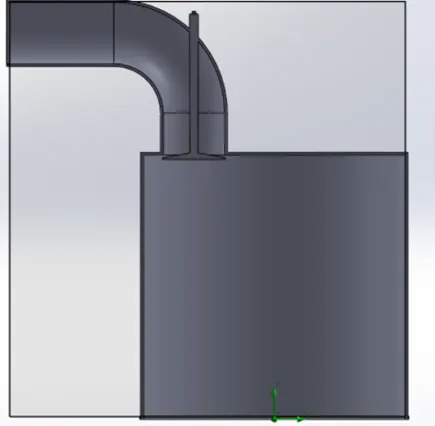
Grid Dependency Test:
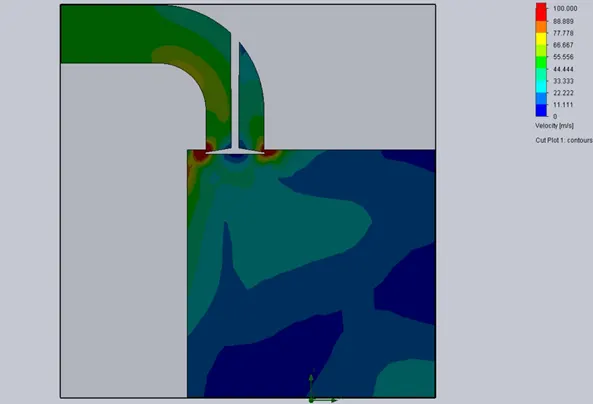
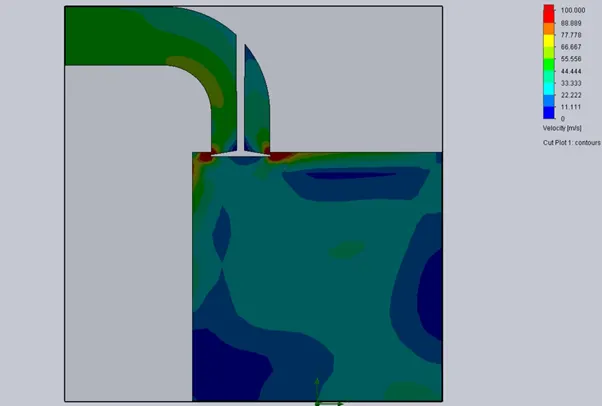
This is to find the best grid for running the simulation. Three grids are used at particular valve lift and the grid which shows the good results is selected for further simulation.
Case 1:
Velocity Plot:
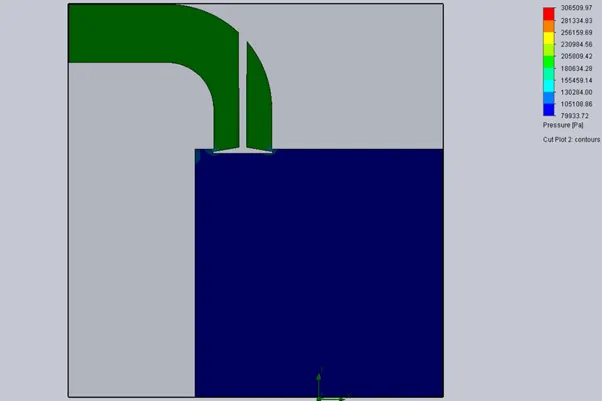
Pressure Plot:
Case 2:
Velocity Plot:
Pressure Plot:
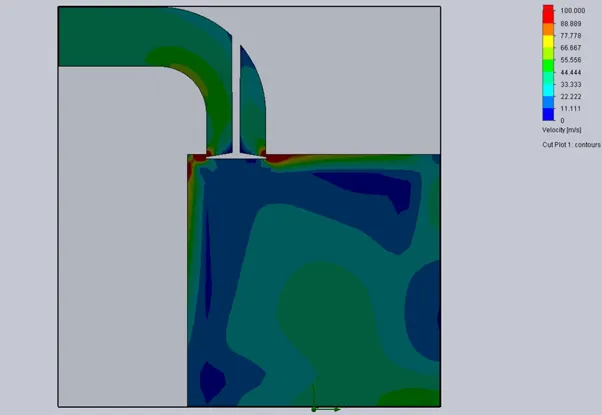
Case 3:
Velocity Plot:
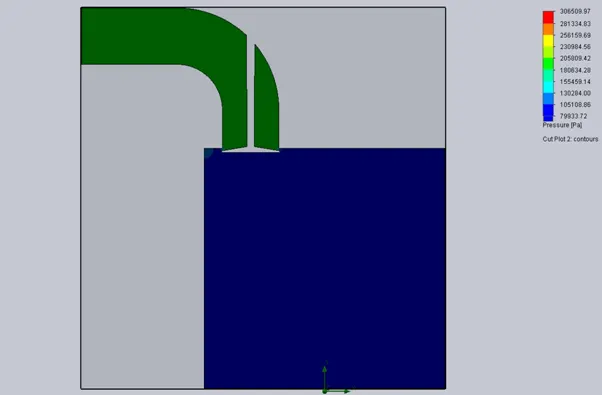
Pressure Plot:
Flow Simulation:
Create Lids to close the inlet and outlet faces. Make internal analysis type and extruded cavities with flow conditions. Select water as the working fluid. The adiabatic wall is selected as the default wall thermal condition. The value of temperature is 293.2K
Boundary conditions:
Select total pressure at the inlet and since there is pressurized fuel at inlet then give the value of pressure is 2 bar. Select static pressure at outlet gives the value of pressure is 1 bar (atmospheric pressure).
Procedure (Continued):
Make a cut plot and select velocity to enable the view of fluid flow inside it. Right-click on Goals and. select surface goals. Then right-click on outlet face and select led options. Select the mass flow rate. Right-click on Project and select new parametric study. Select the dimension of valve lift in add dimension parameter to add it as input parameters. Give input for the required valve lift position and then run the parametric study.
Results:
Valve Lift = 0.01m
Velocity Plot:
Pressure Plot:
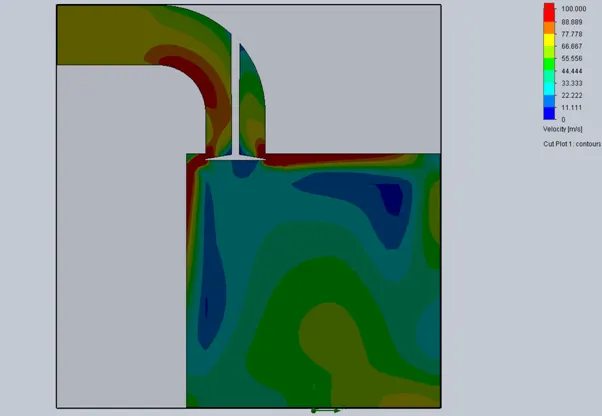
Valve lift = 0.02m
Velocity Plot:
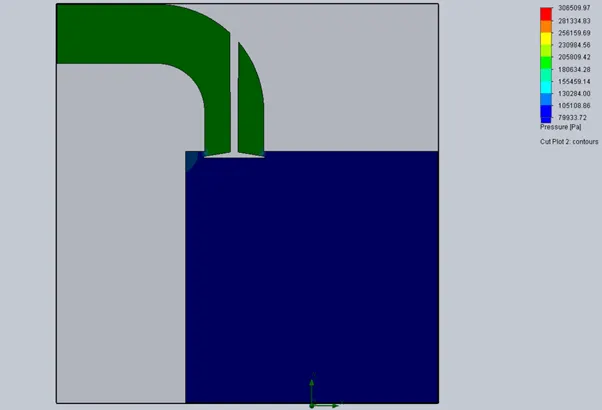
Pressure Plot:
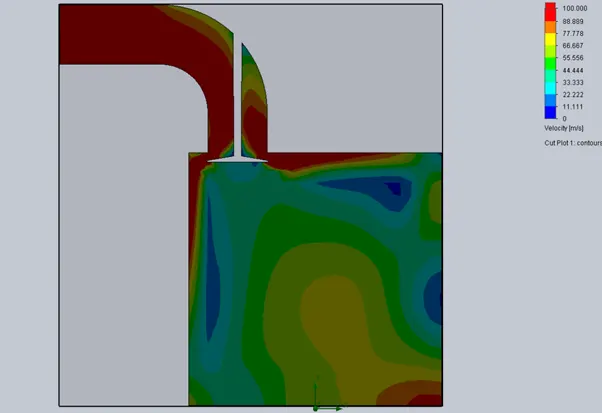
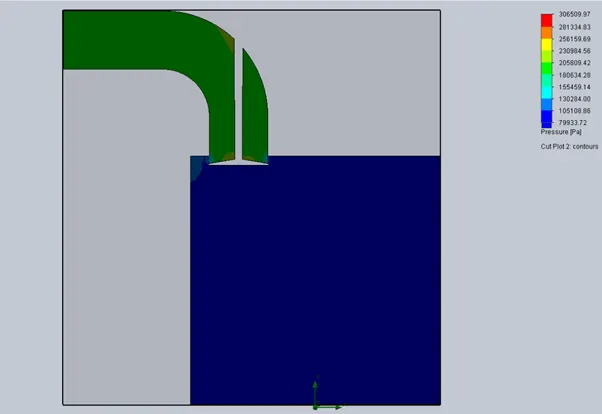
Valve Lift =0.03m
Velocity plot:
Pressure plot:
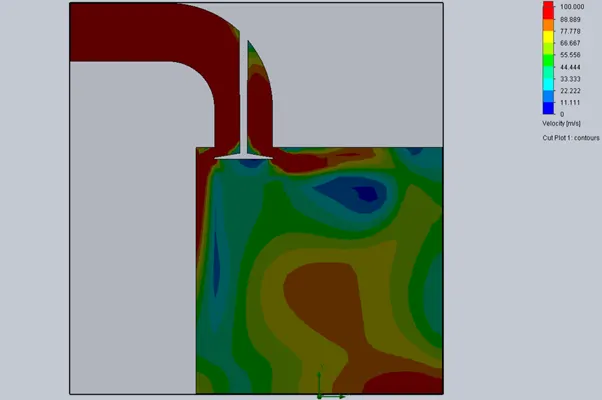
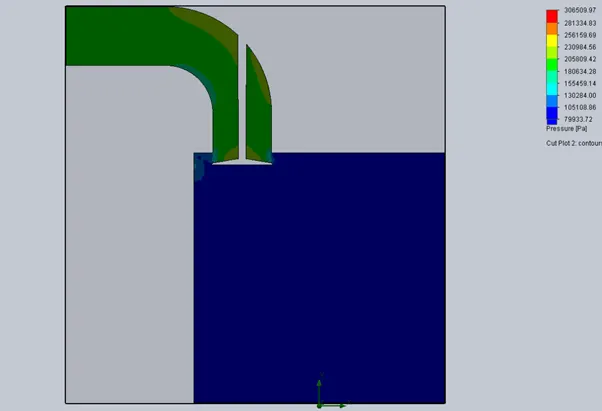
Valve Lift= 0.04m
Velocity Plot:
Pressure Plot:
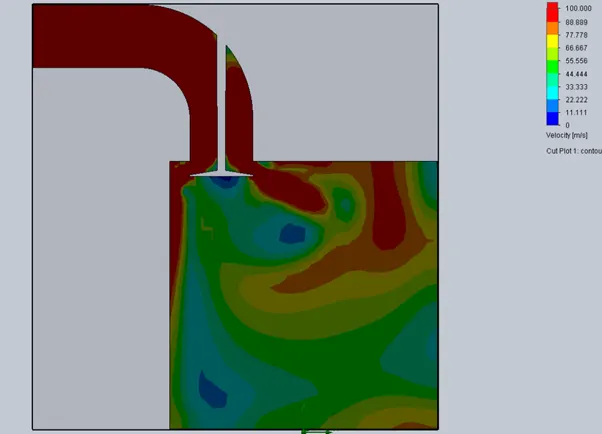
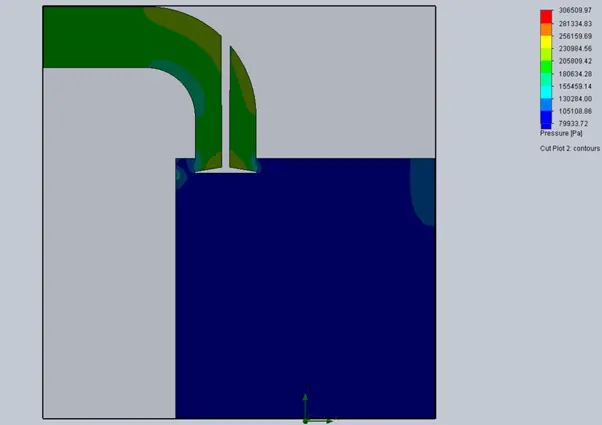
Valve Lift= 0.05
Velocity Plot:
Pressure Plot:
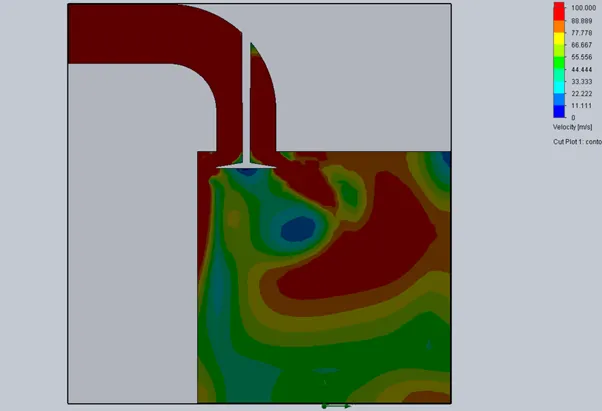
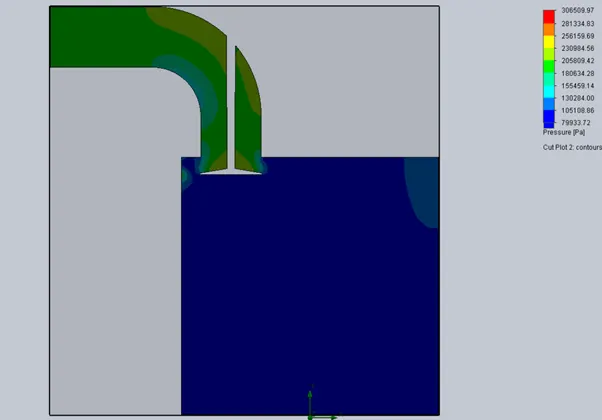
Valve Lift = 0.06
Velocity Plot:
Pressure Plot:
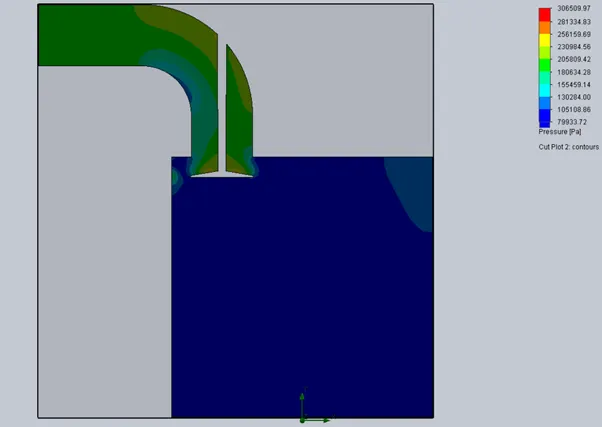
Valve Lift= 0.07 m
Velocity Plot:
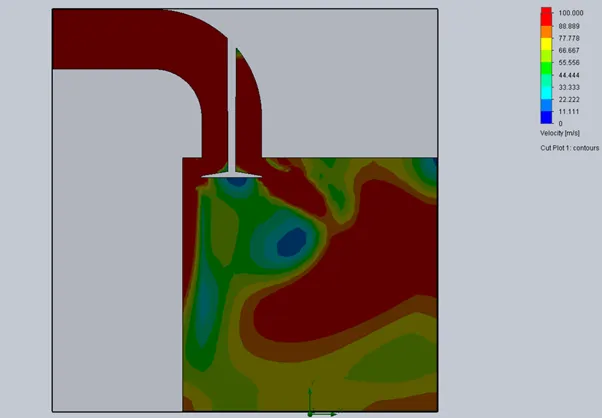
Pressure Plot:
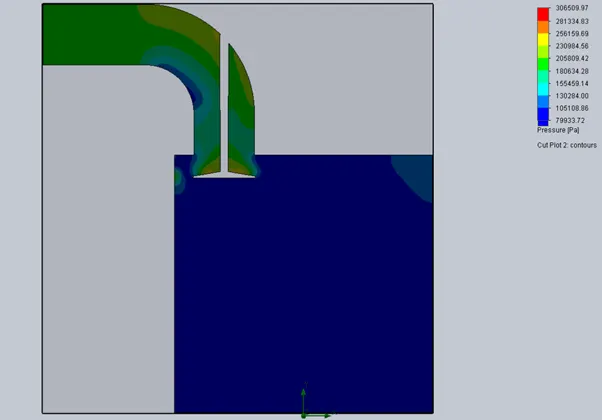
Valve Lift =0.08m
Velocity Plot:
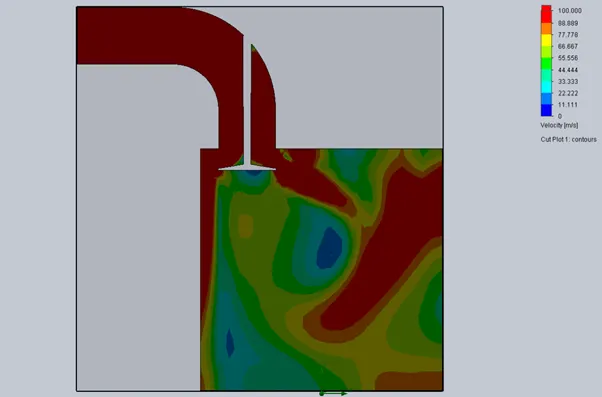
Pressure Plot:
Valve Lift= 0.09m
Velocity Plot:
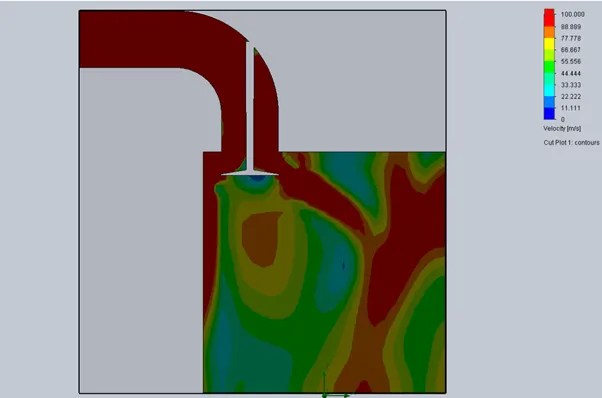
Pressure Plot:
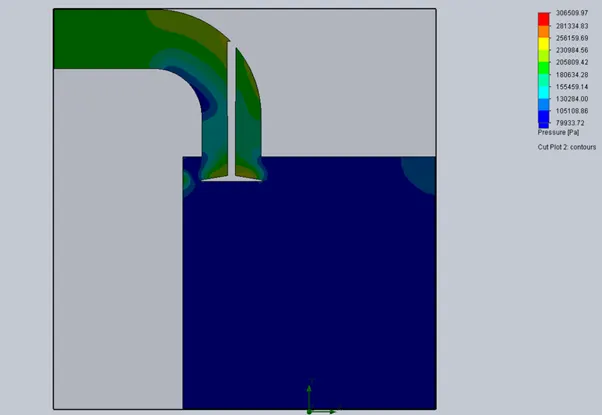
Valve Lift =0.10m
Velocity Plot:
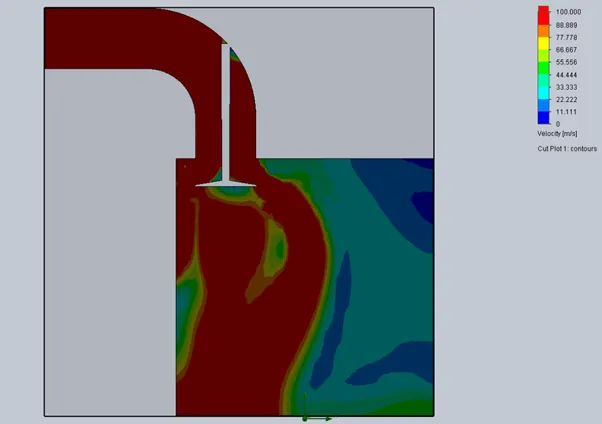
Pressure Plot
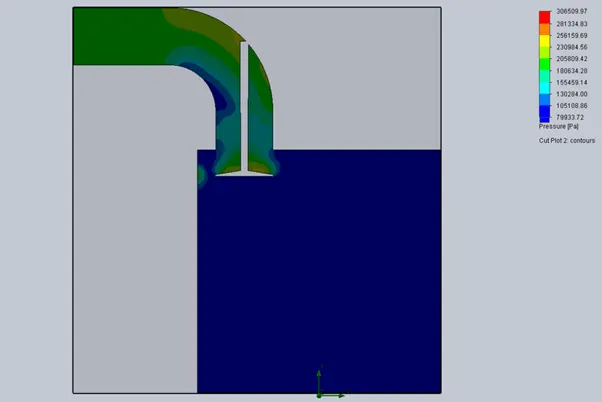
Mass Flow Rate Plot:
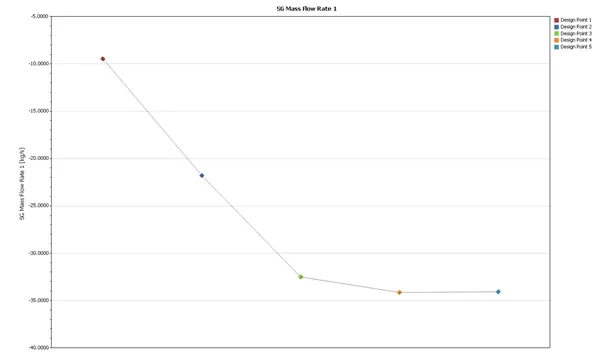
It is observed that the mass flow rate reduces as the valve lift increases. As the valve lift continues to increase, a large intake valve opening allows for a greater induction mass flow rate.
Conclusion:
It can be observed that the pressure reduces with the increase in valve lift due to an increase in distance between the valve opening and cylinder and pressure increases with an increase in valve lift. High pressure leads to a swirling effect.