Mixing efficiency of Tee Joint
Objective: To set up steady-state simulations to compare the mixing effectiveness when hot inlet temperature is 360C & the Cold inlet is at 190C.
Use the k-epsilon and k-omega SST model for the first case and based on your judgment use the more suitable model for further cases. Giving the reason for choosing a suitable model is compulsory.
- Case 1
- Short mixing tee with a hot inlet velocity of 3m/s.
- Momentum ratio of 2, 4.
- Case 2
- Long mixing tee with a hot inlet velocity of 3m/s.
- Momentum ratio of 2, 4.
Momentum ratio = velocity at cold inlet / velocity at hot inlet
In a table, compare the following values from the 2 cases.
- Cell count
- Average outlet temperature
- Number of iterations for convergence
Expected results:
- Velocity and temperature contour plots on the cut planes along and across the pipe.
- Velocity and temperature line plots along and across the length of the pipe.
- Perform Mesh independent study for any one case.
- Discuss the effect of length and momentum ratio on results.
For each simulation, convergence plot need to be shown
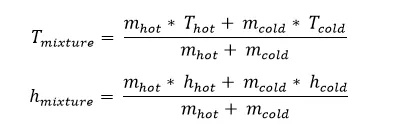
Reference Formulas:-
->Solution:
1) Tee Joints (Mixing Tee):
Tee Joints are flow control devices which are used for efficient mixing of two different fluids of various temperatures and velocities into one combined stream as per the requirements. It has two inlets and one outlet which are at 900, hence the name Tee ("T") Joint. Tee joints are mainly used for high pressure applications, nuclear reactor safety, air conditioning etc.
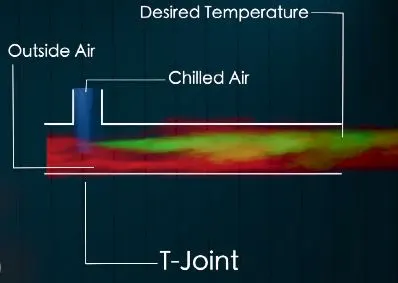
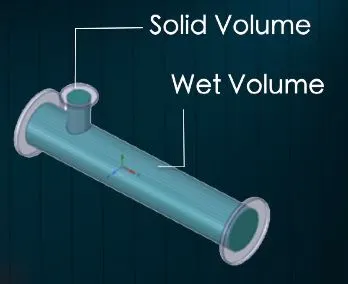
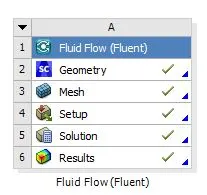
The simulations for different boundary conditions and cases are carried out in Ansys Fluent. Following workflow is followed from start to end, to obtain results.

2) Case 1:
- Short mixing tee with a hot inlet velocity of 3m/s.
- Momentum ratio of 2, 4.
#Case 1A:
- Short mixing tee with a hot inlet velocity of 3m/s, hot inlet temperature of 360C & the Cold inlet temperature of at 190C.
- Momentum ratio = 2
- K-Epsilon Model
We know that Momentum ratio = velocity at cold inlet / velocity at hot inlet. Therefore, for momentum ratio = 2, hot inlet velocity = 6 m/s.
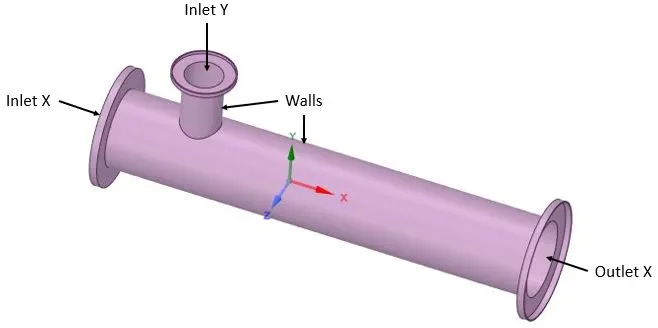
-Given Geometry:
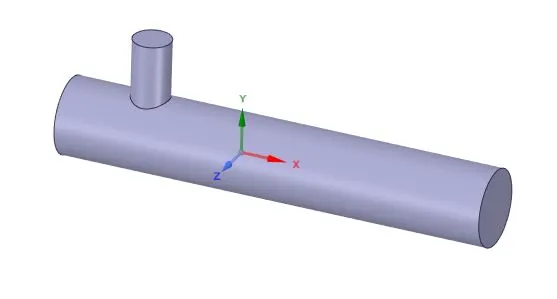
-Extracted Volume:
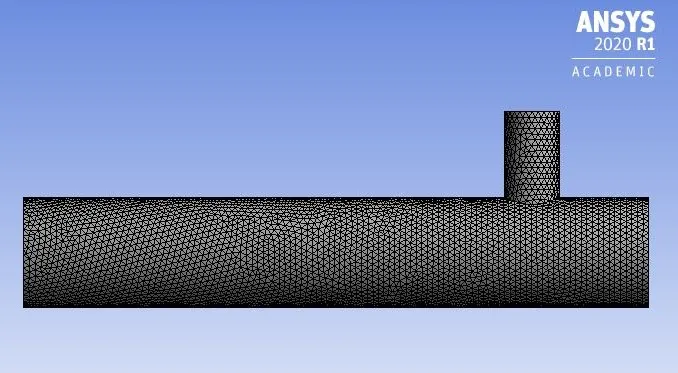
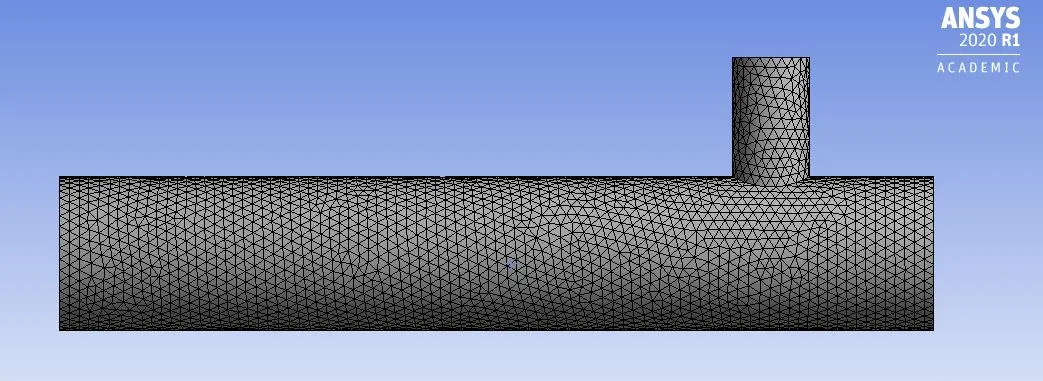
-Meshing:
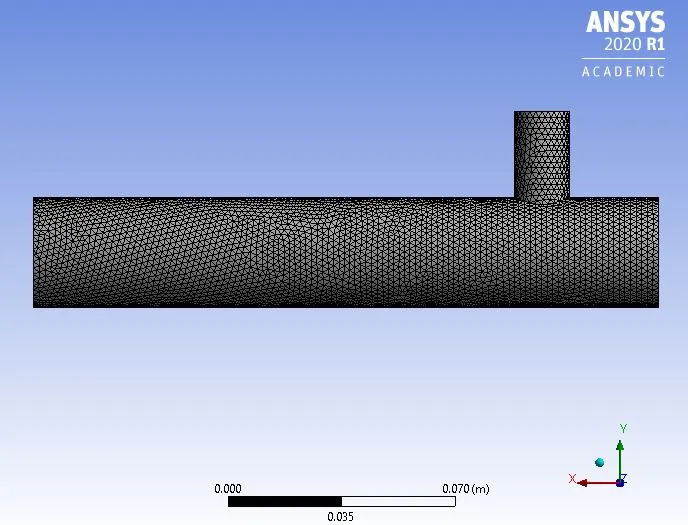
>Type of meshing used: Tetrahedral
>Cell Count: 105865
>Element Size: 0.002m
>Nodes: 21347
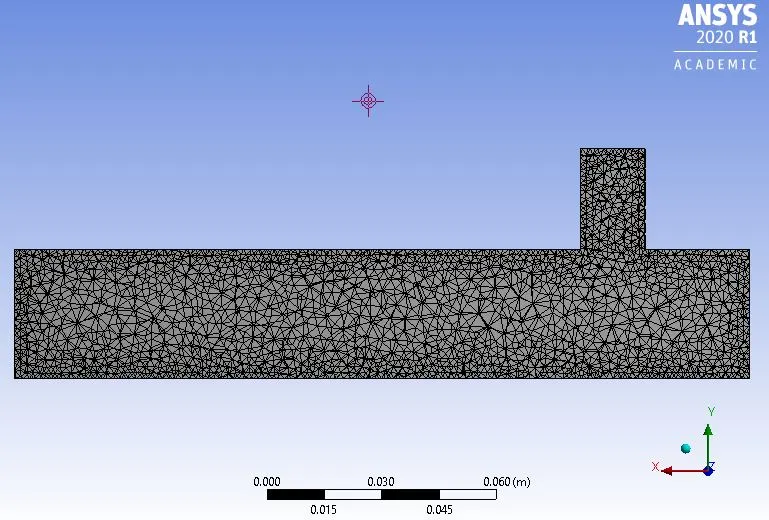
Sectional view of the meshed geometry
>Mesh Metrics:
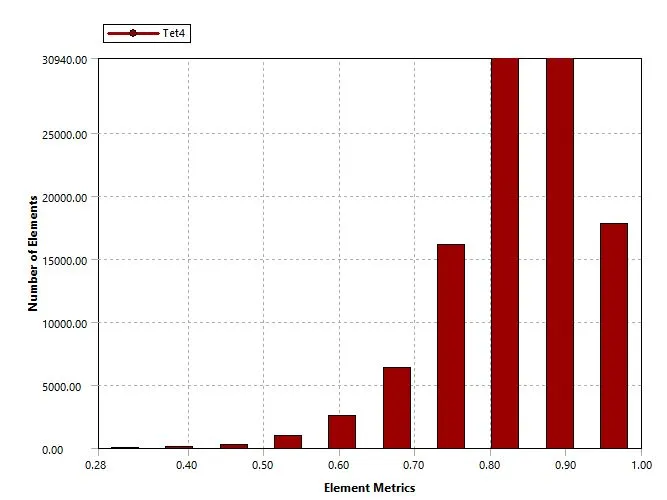
Element quality greater than 5%, to obtain better results.
-Solution:
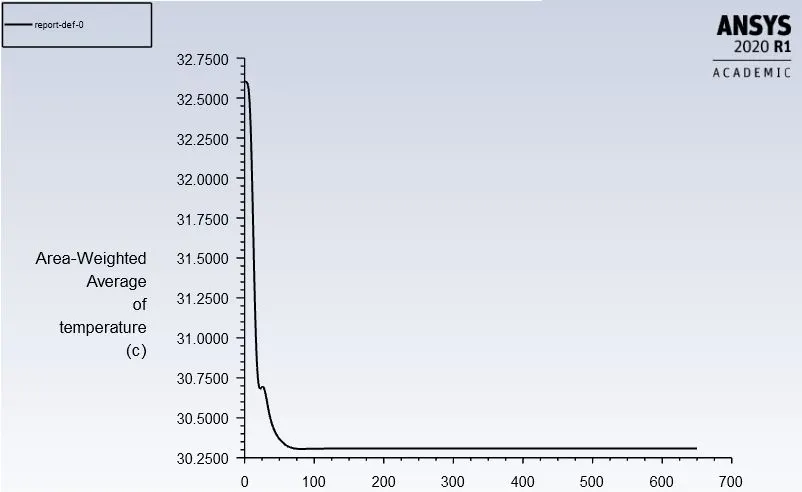
>Area Weighted Average of Temperature plot at Outlet:
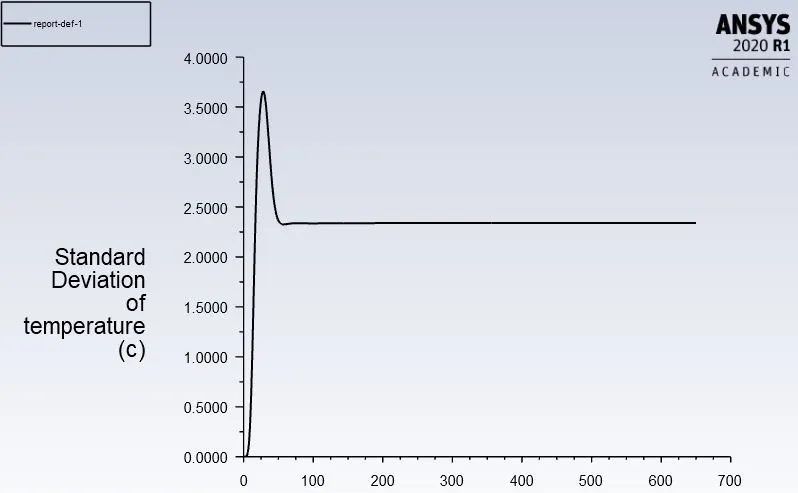
>Standard Deviation of Temperature plot at Outlet:
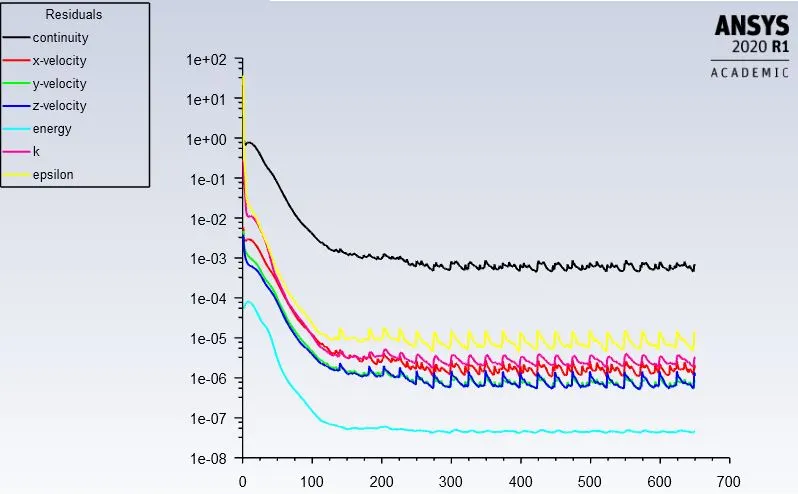
>Residuals Plot:
-Results:
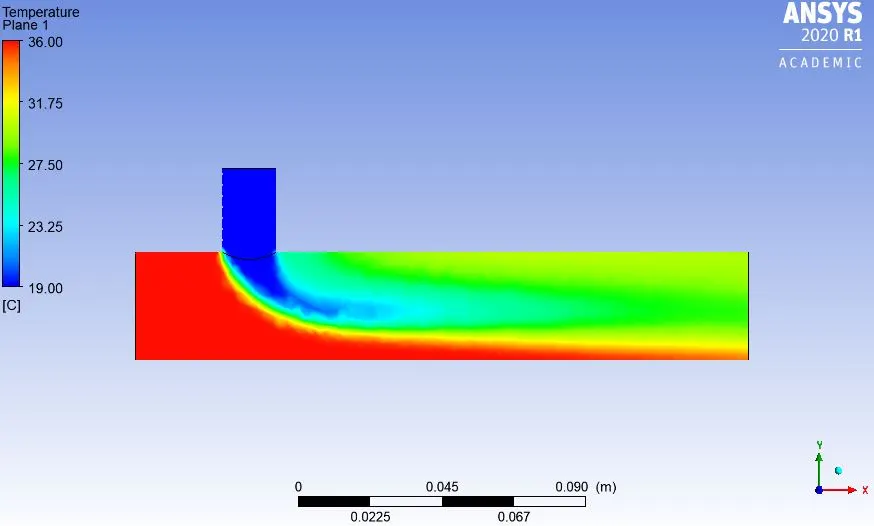
>Temperature Contour Plot on the cut plane along the Pipe:
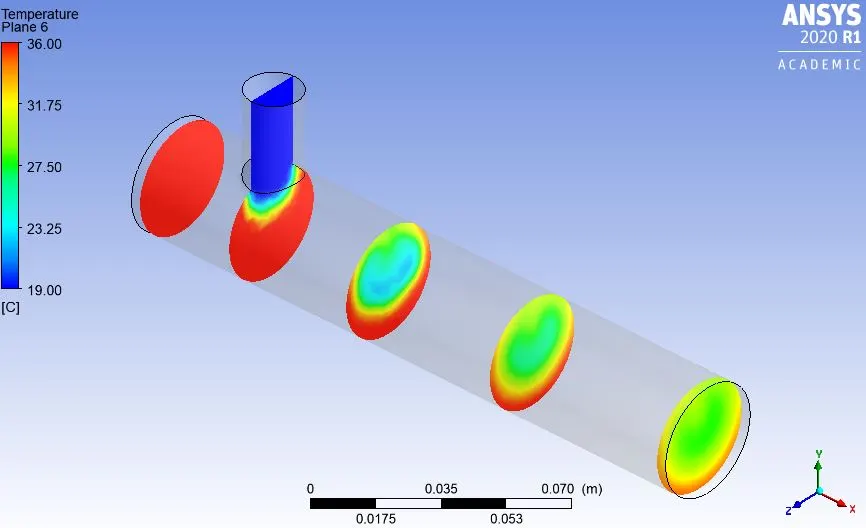
>Temperature Contour Plot on the cut plane across the Pipe:
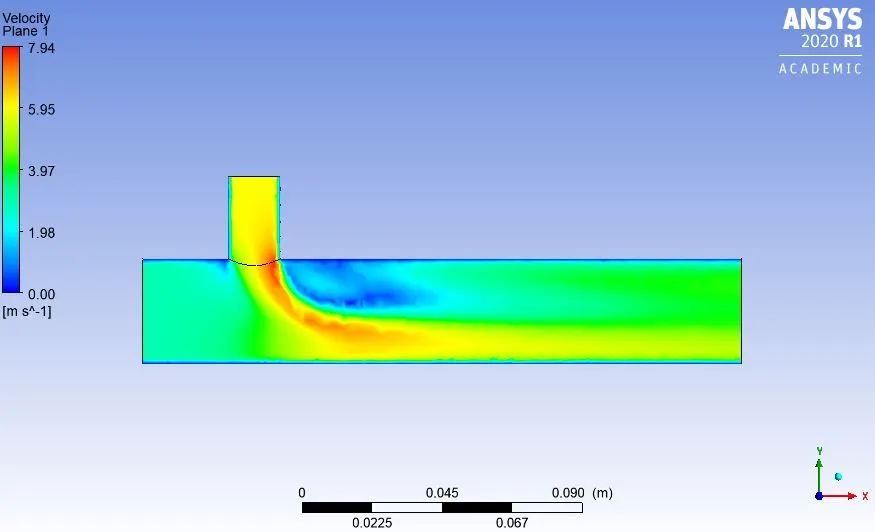
>Velocity Contour Plot on the cut plane along the Pipe:
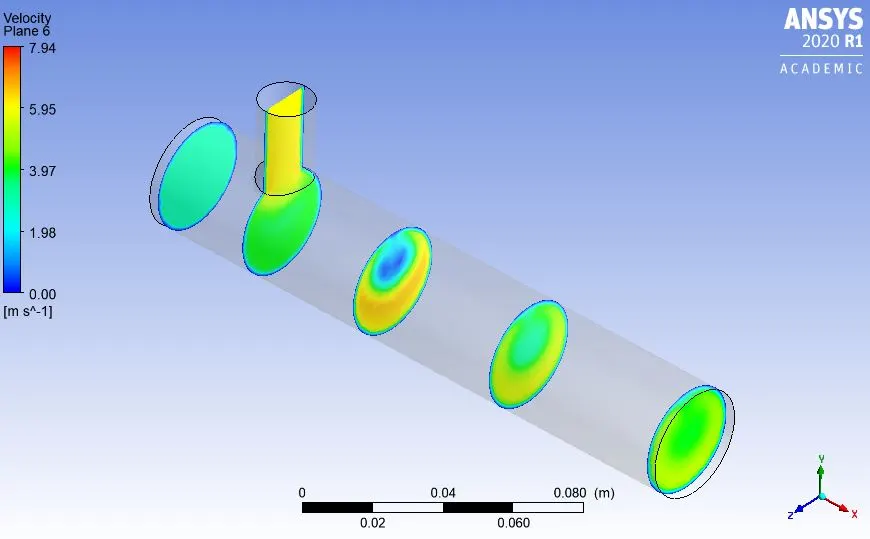
>Velocity Contour Plot on the cut plane along the Pipe:
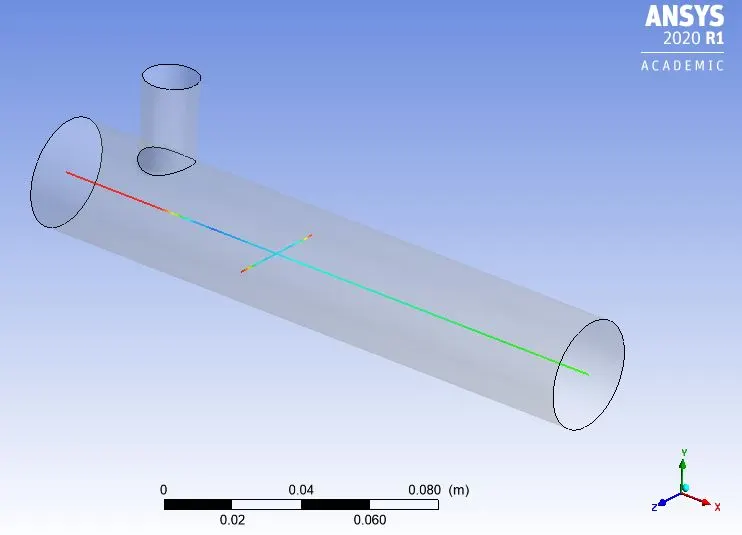
>Temperature Line Contour along and across the length of pipe:
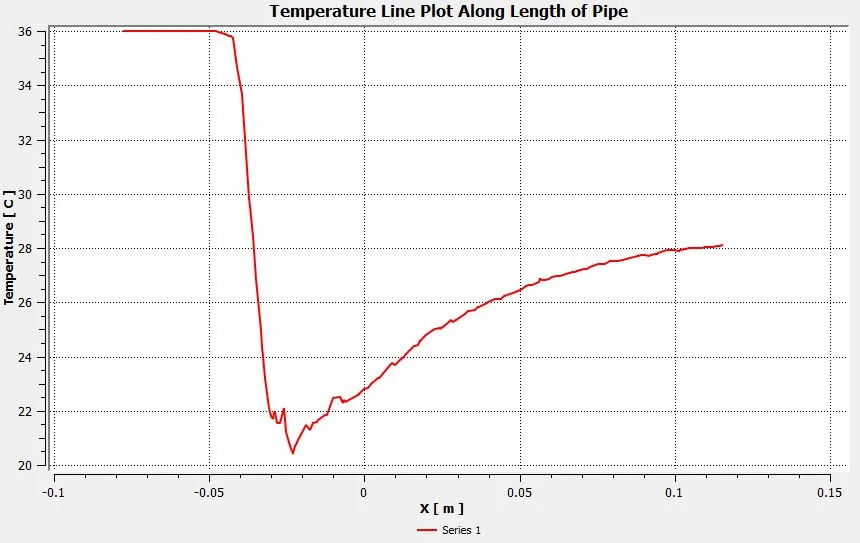
>Temperature Line Plot along the length of pipe:
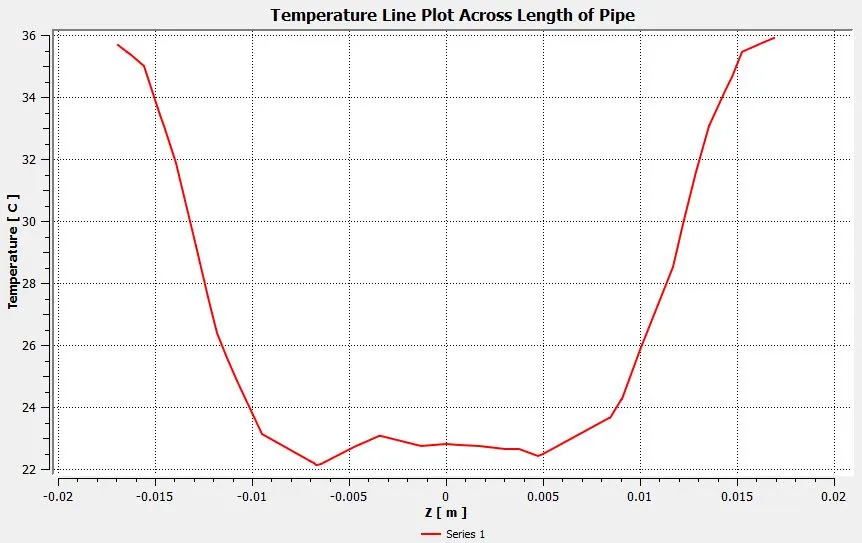
>Temperature Line Plot across the length of pipe:
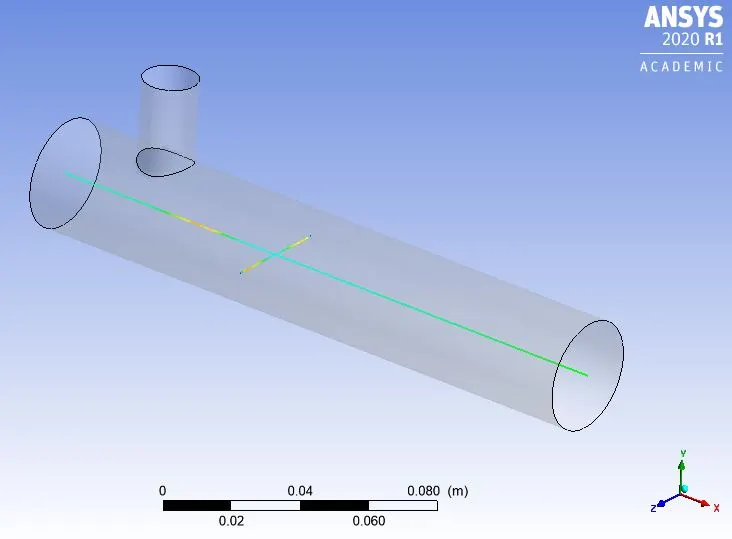
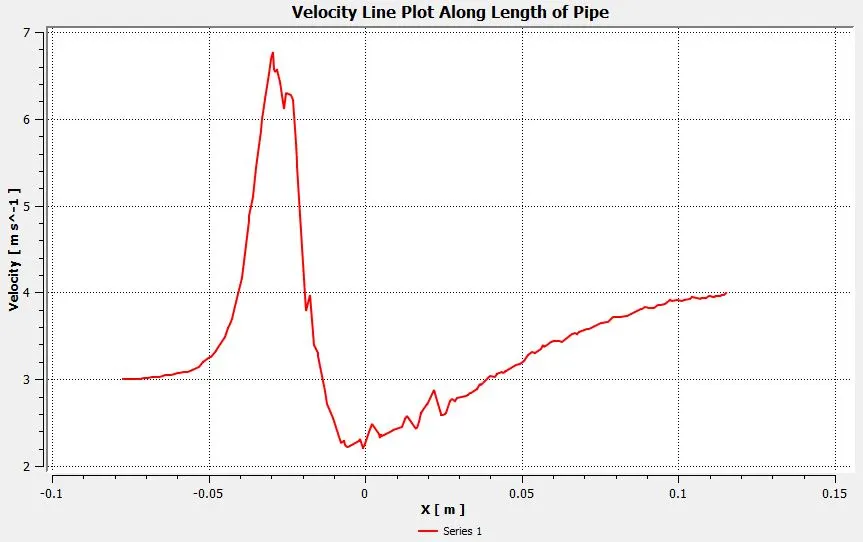
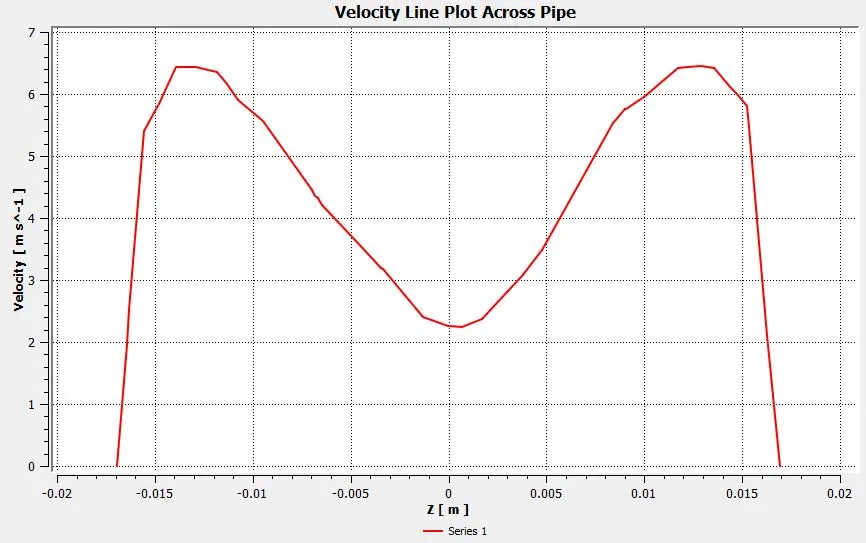
>Velocity Line Contour along and across the length of pipe:
>Velocity Line Plot along the length of pipe:
>Velocity Line Plot across the length of pipe:
#Case 1B:
- Short mixing tee with a hot inlet velocity of 3m/s, hot inlet temperature of 360C & the Cold inlet temperature of at 190C.
- Momentum ratio = 2
- K-Omega Model
-Solution:
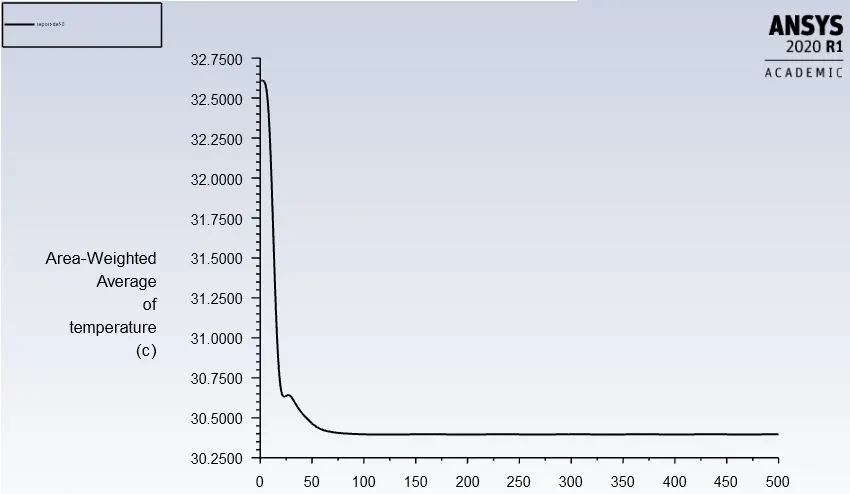
>Area Weighted Average Temperature plot at Outlet:
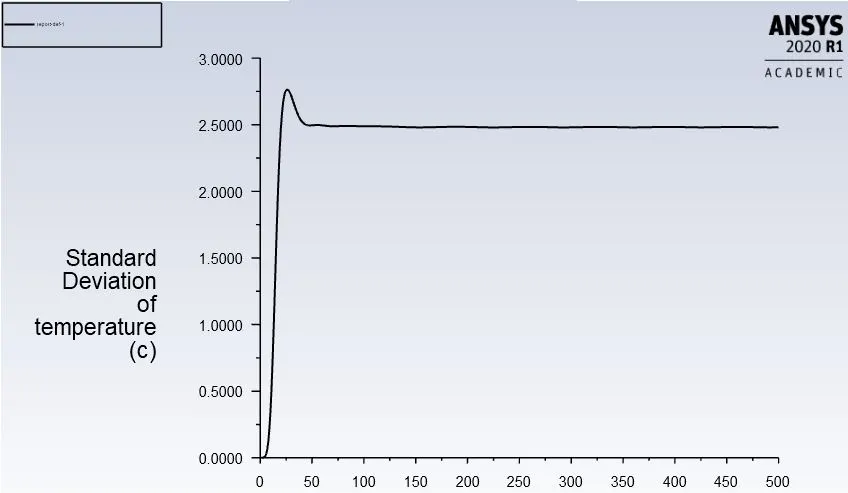
>Standard Deviation of Temperature plot at Outlet:
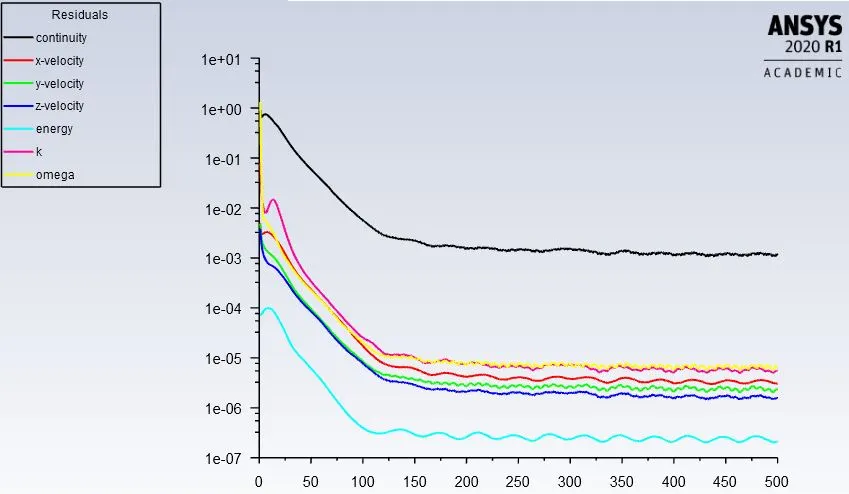
>Residuals Plot:
-Results:
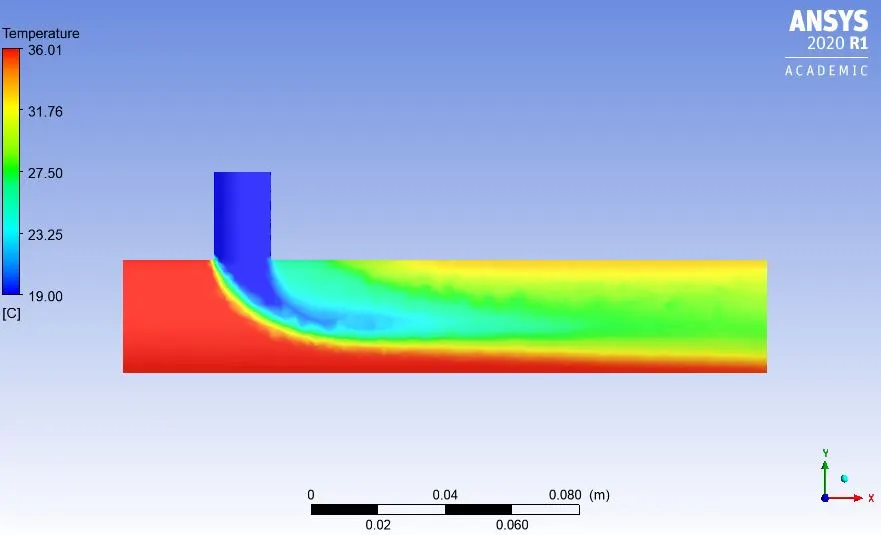
>Temperature Contour Plot on the cut plane along the Pipe:
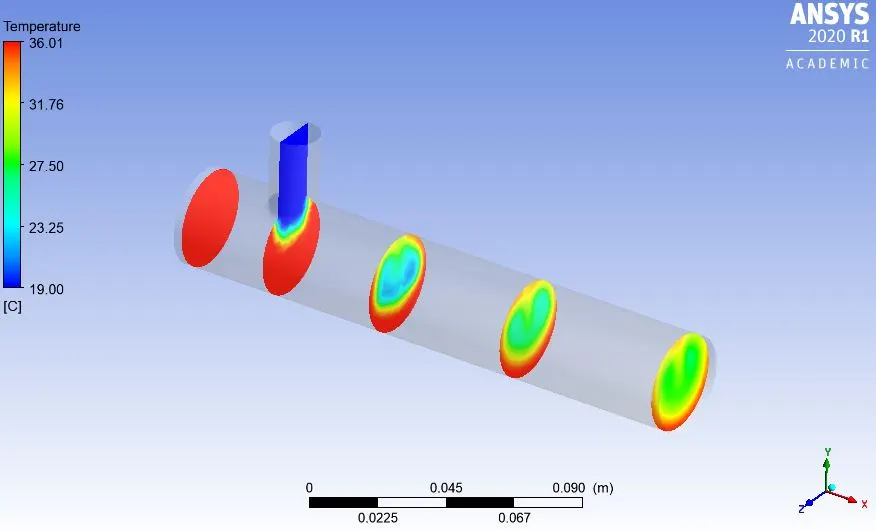
>Temperature Contour Plot on the cut plane across the Pipe:
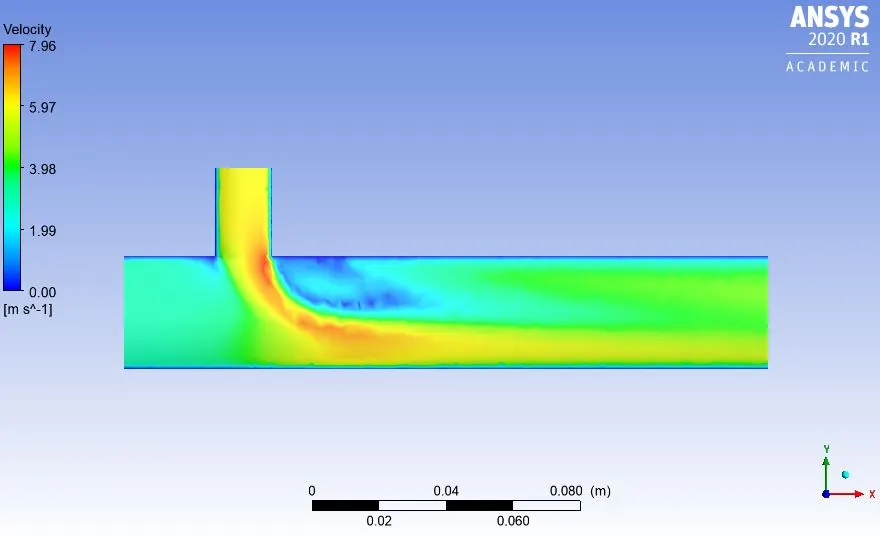
>Velocity Contour Plot on the cut plane along the Pipe:
>Velocity Contour Plot on the cut plane across the Pipe:
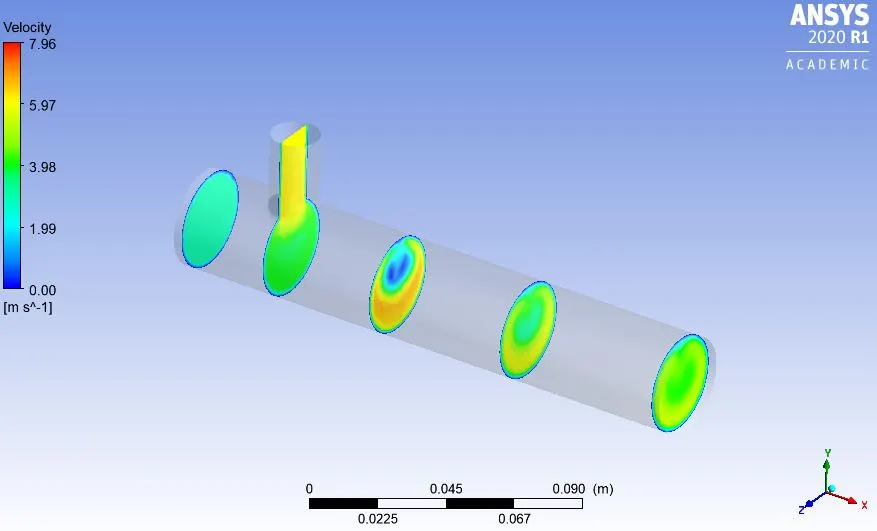
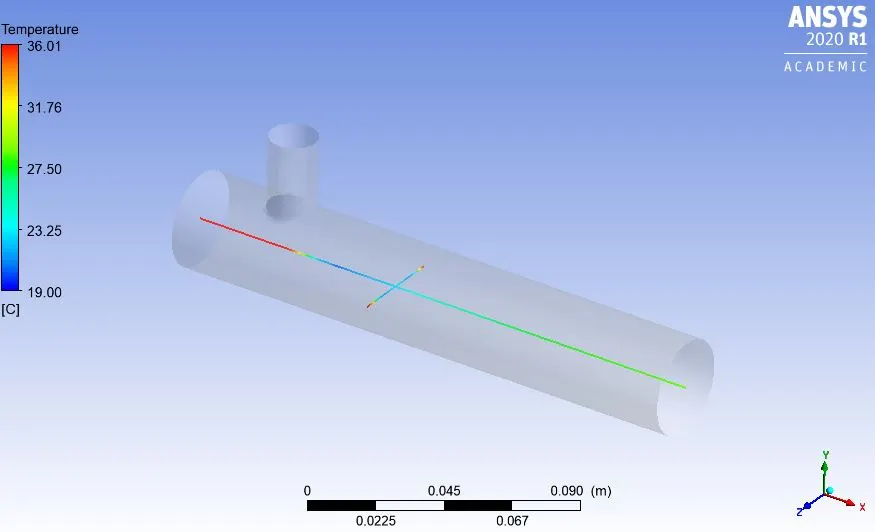
>Temperature Line Contour along and across the length of pipe:
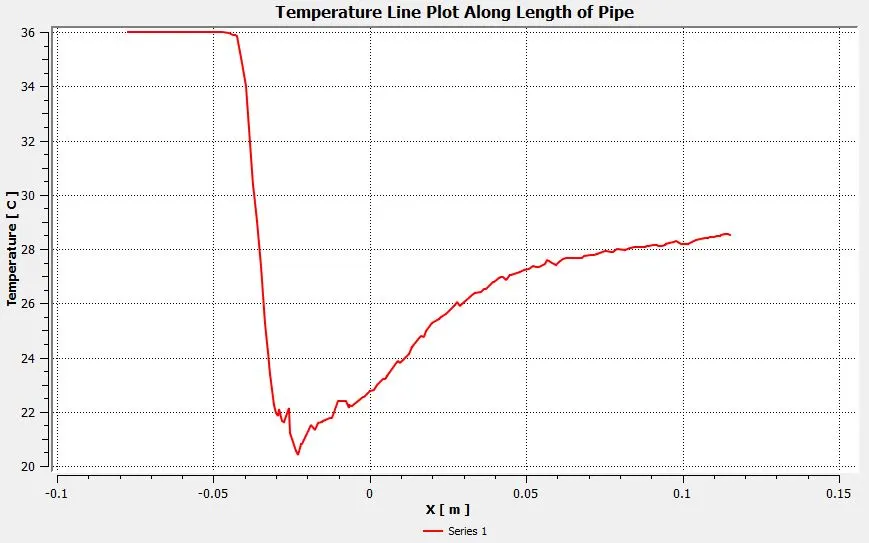
>Temperature Line Plot along the length of pipe:
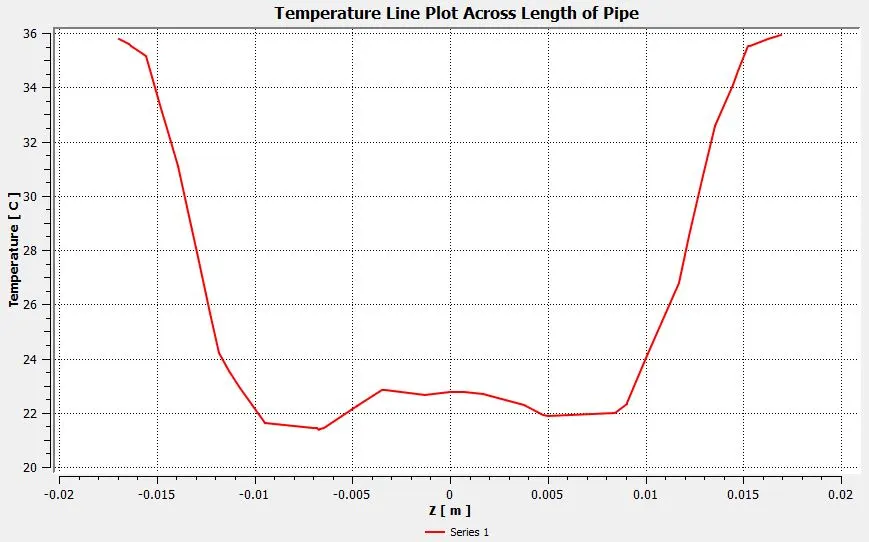
>Temperature Line Plot across the length of pipe:
>Velocity Line Contour along and across the length of pipe:
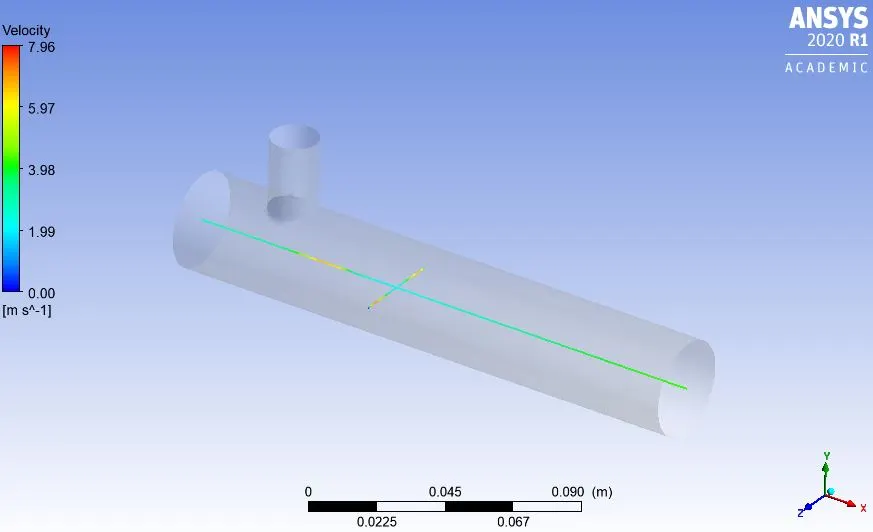
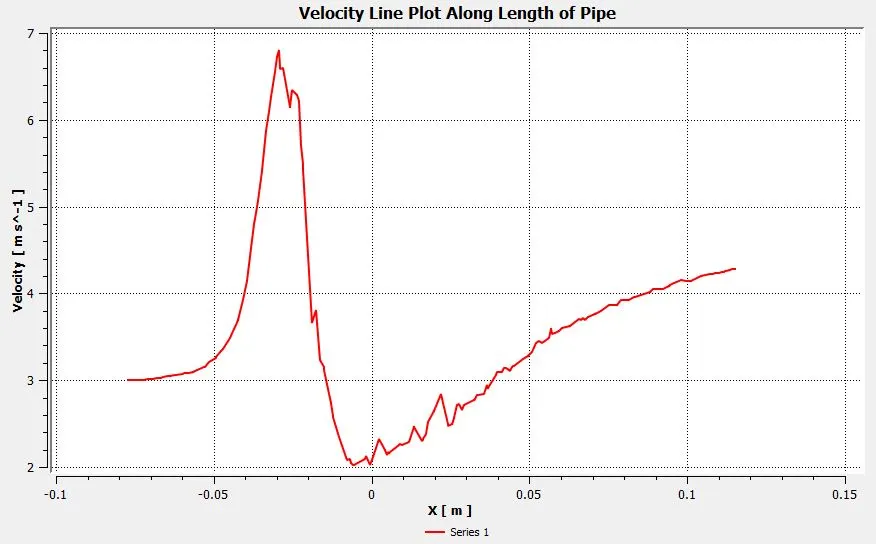
>Velocity Line Plot along the length of pipe:
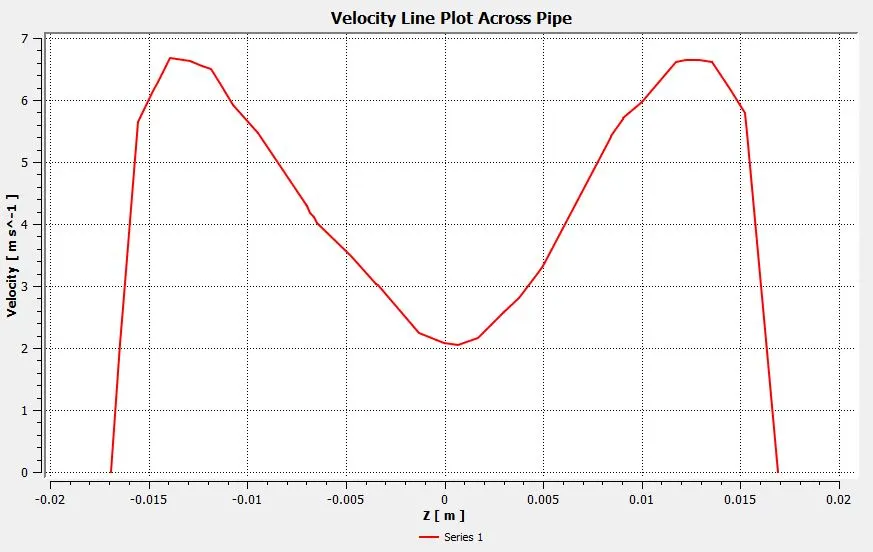
>Velocity Line Plot across the length of pipe:
-Result Summary:
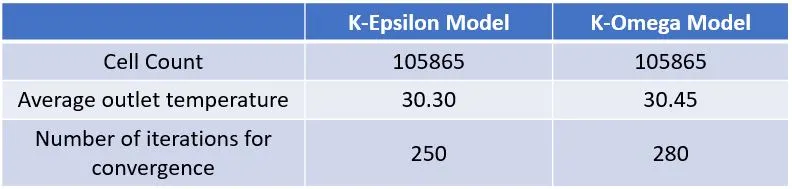
From the above results and following reasons, it can be said that K-Epsilon Model is more suitable than K-Omega Model.
a) The average temperature at outlet is low in case of K-Epsilon model when compared to K-Omega model.
b) The number of iterations for convergence is less in K-Epsilon model than K-omega model.
c) The standard deviation of temperature is comparatively more in K-Omega model than K-Epsilon model.
d) K-Epsilon model is preferably used for problems away from wall and K-Omega model is preferred for problems near wall.
#Case 1C:
- Short mixing tee with a hot inlet velocity of 3m/s, hot inlet temperature of 360C & the Cold inlet temperature of at 190C.
- Momentum ratio = 4
- K-Epsilon Model
-Solution:
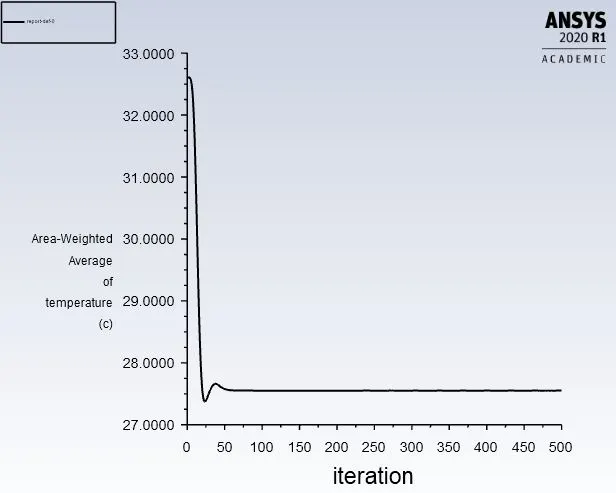
>Area Weighted Average Temperature plot at Outlet:
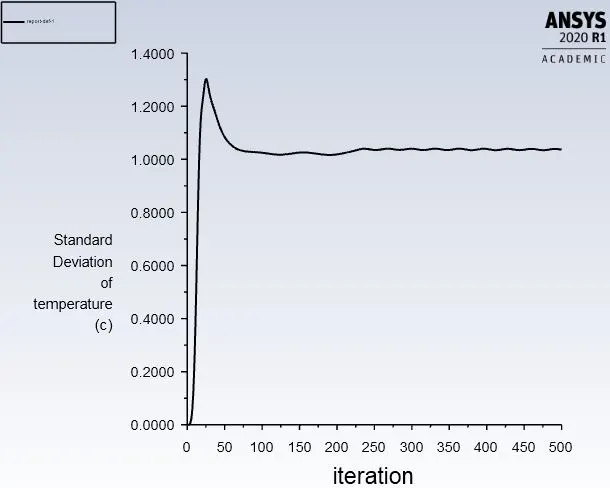
>Standard Deviation of Temperature plot at Outlet:
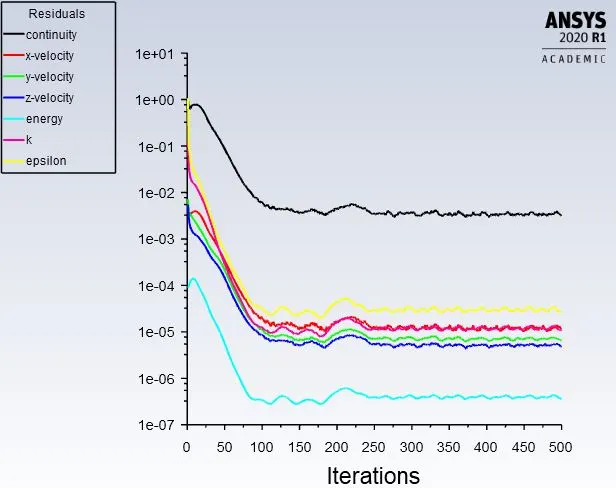
-Residual Plots:
-Results:
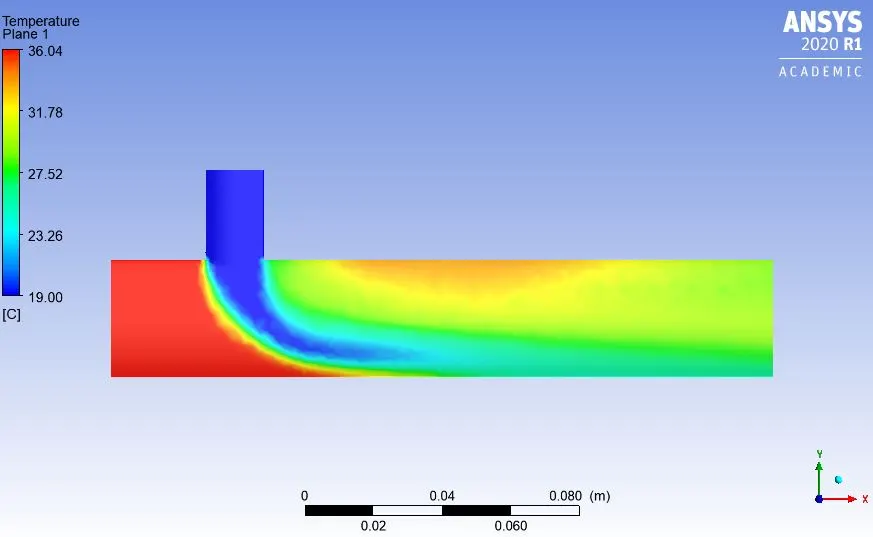
>Temperature Contour Plot on the cut plane along the Pipe:
>Temperature Contour Plot on the cut plane across the Pipe:
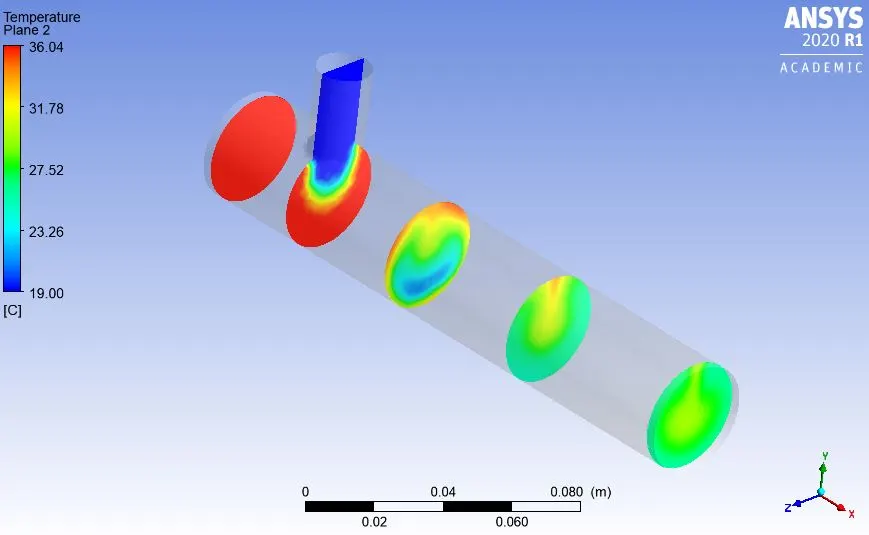
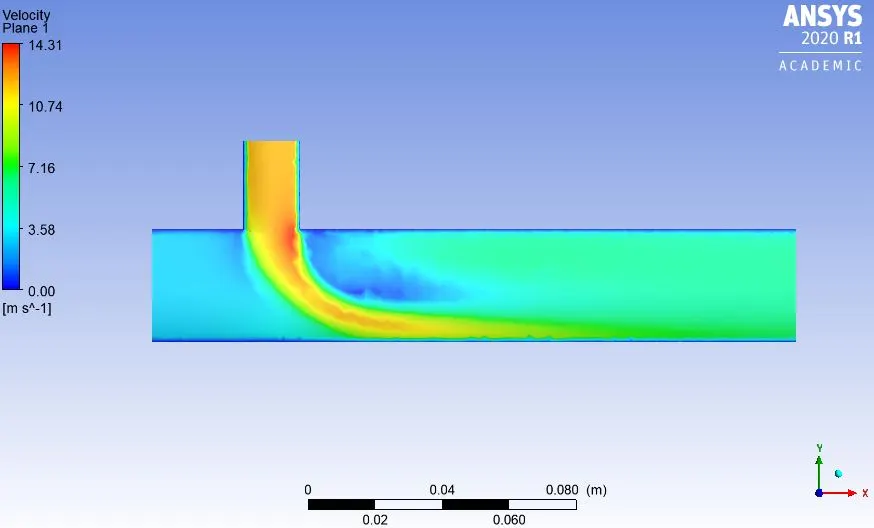
>Velocity Contour Plot on the cut plane along the Pipe:
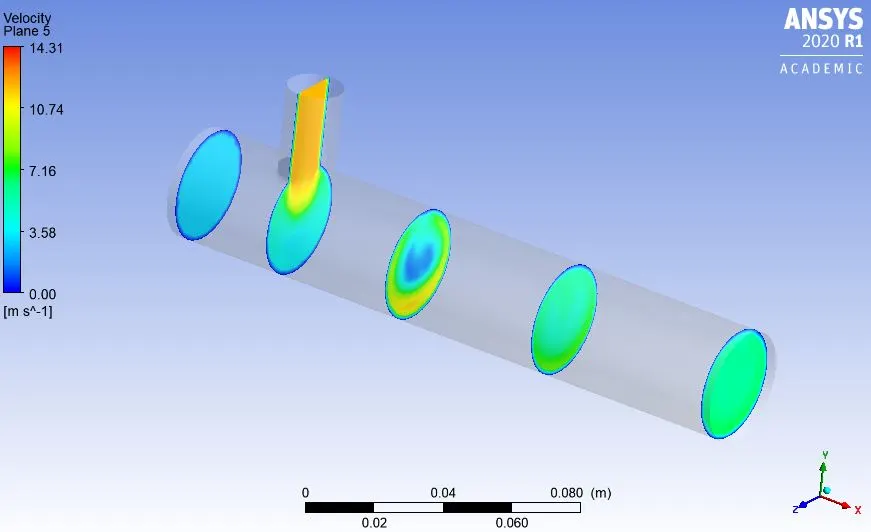
>Velocity Contour Plot on the cut plane across the Pipe:
>Temperature Line Contour along and across the length of pipe:
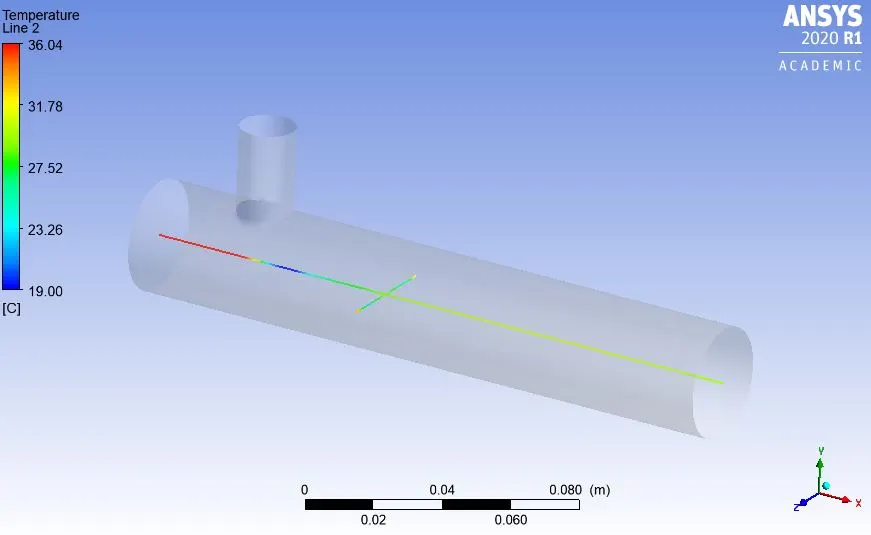
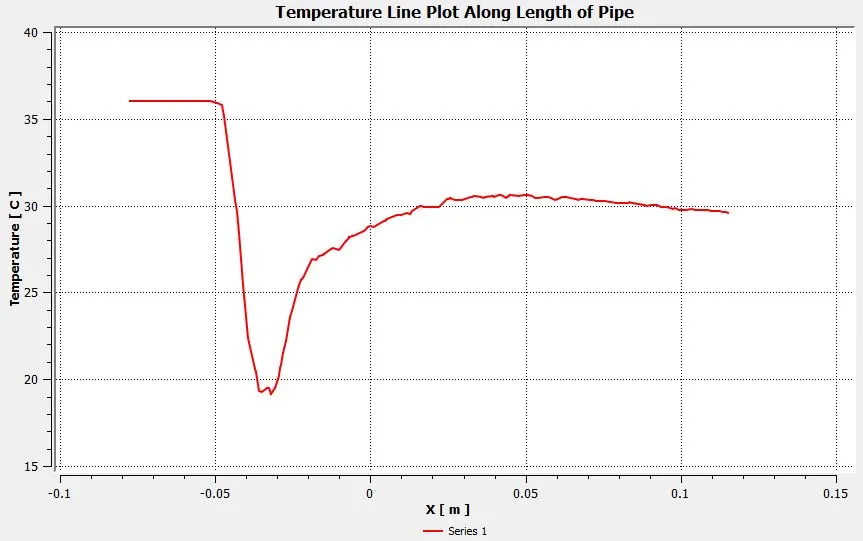
>Temperature Line Plot along the length of pipe:
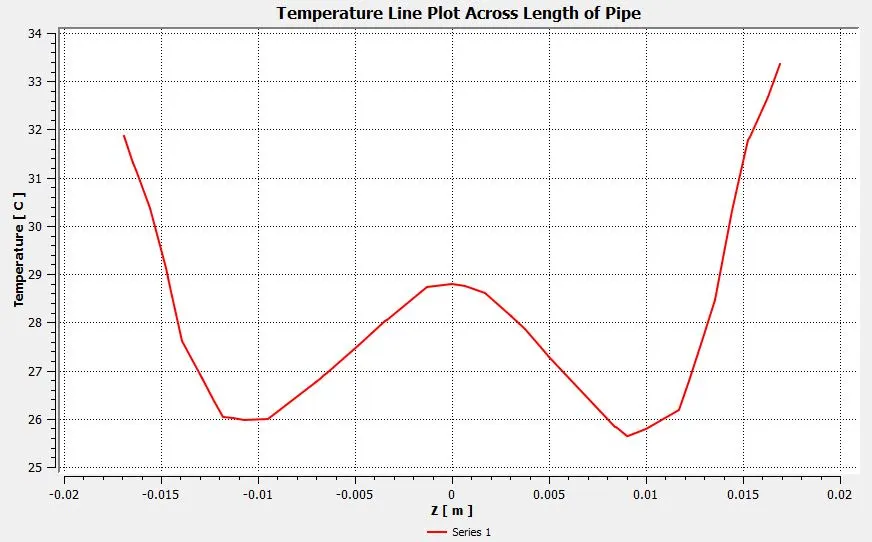
>Temperature Line Plot across the length of pipe:
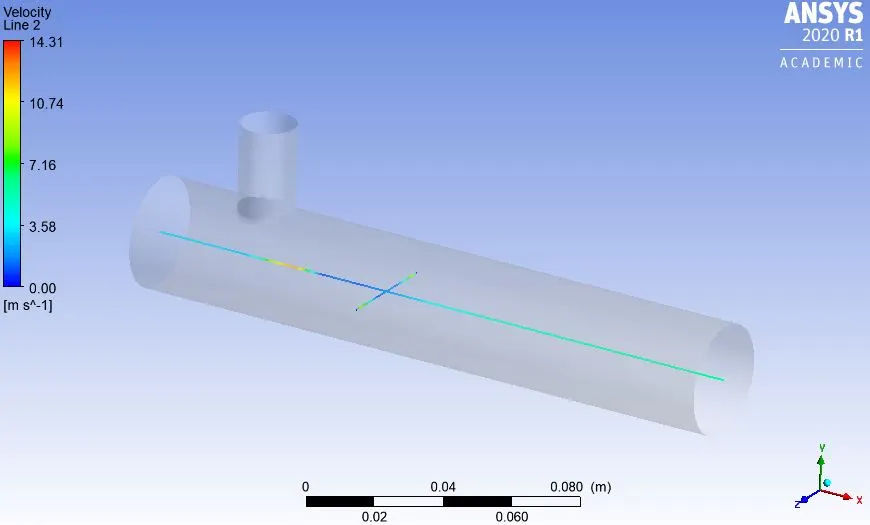
>Velocity Line Contour along and across the length of pipe:
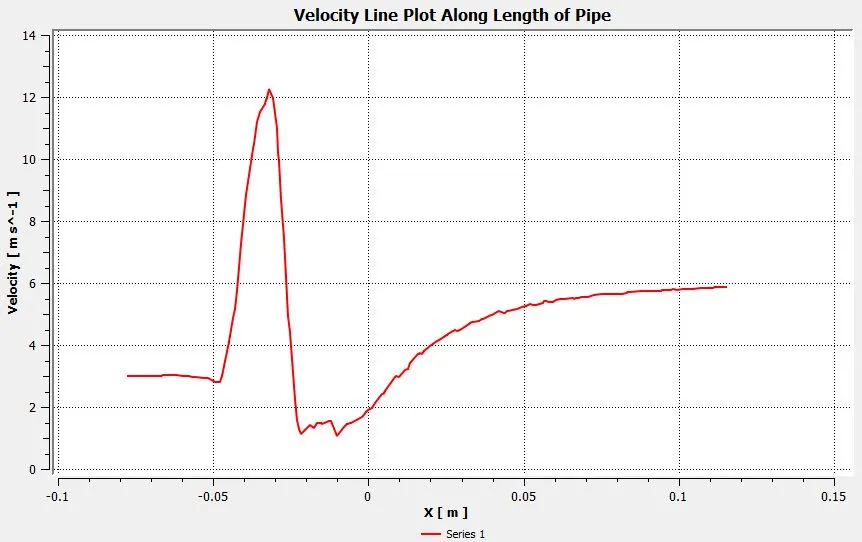
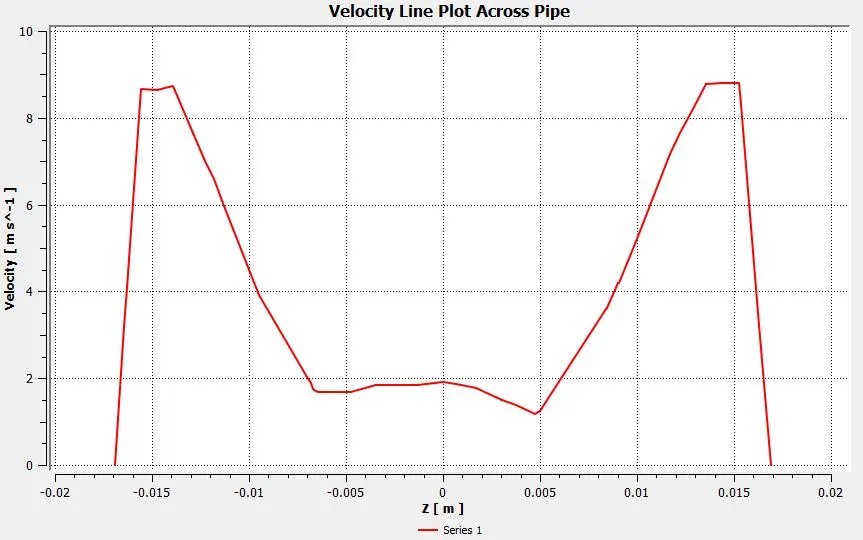
>Velocity Line Plot along the length of pipe:
>Velocity Line Plot across the length of pipe:
____________________________________________________________________________________________
3) Case 2
- Long mixing tee with a hot inlet velocity of 3m/s.
- Momentum ratio of 2, 4.
#Case 2A:
- Long mixing tee with a hot inlet velocity of 3m/s, hot inlet temperature of 360C & the Cold inlet temperature of at 190C.
- Momentum ratio = 2
- K-Epsilon Model
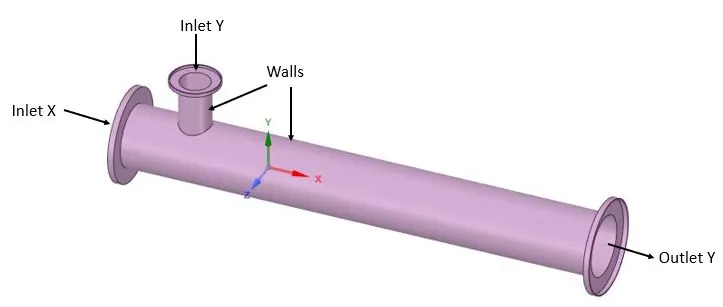
-Given Geometry:
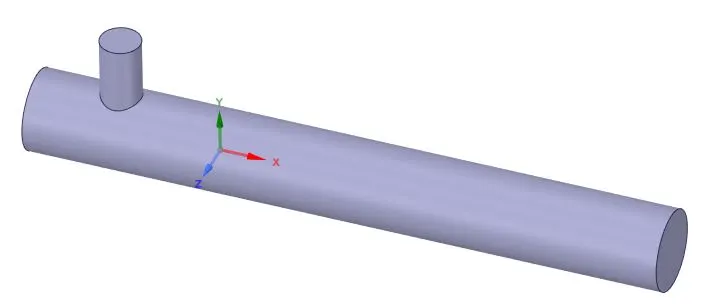
-Extracted Volume:
-Meshing:
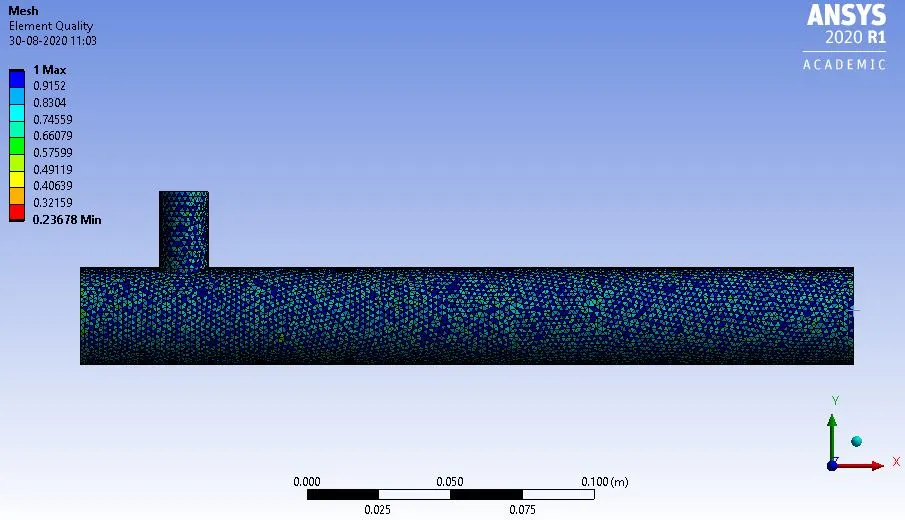
>Type of meshing used: Tetrahedral
>Cell Count: 140272
>Element Size: 0.002m
>Nodes: 28331
>Mesh Metrics:
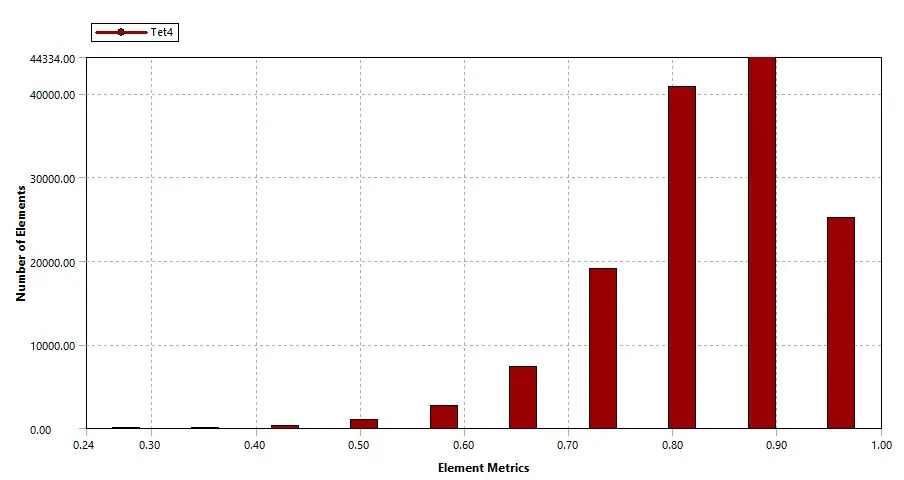
Element quality greater than 5%, to obtain better results.
-Solution:
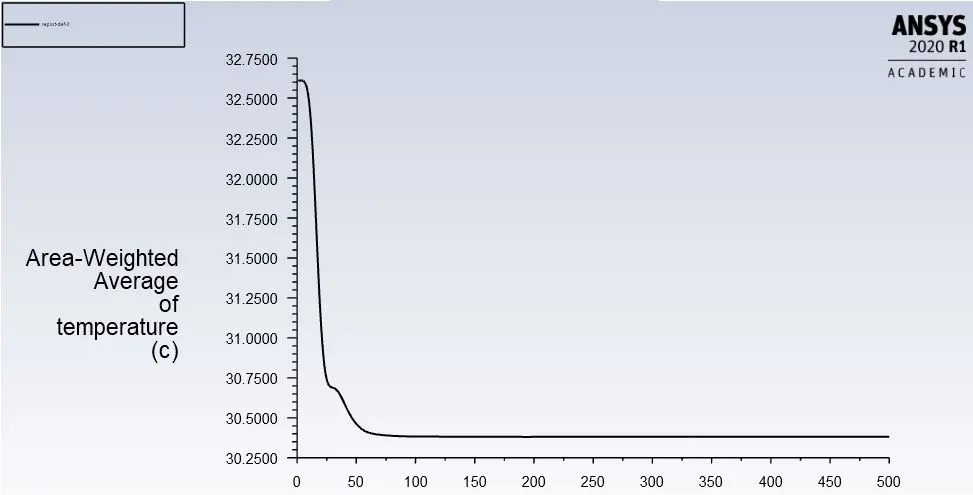
>Area Weighted Average Temperature plot at Outlet:
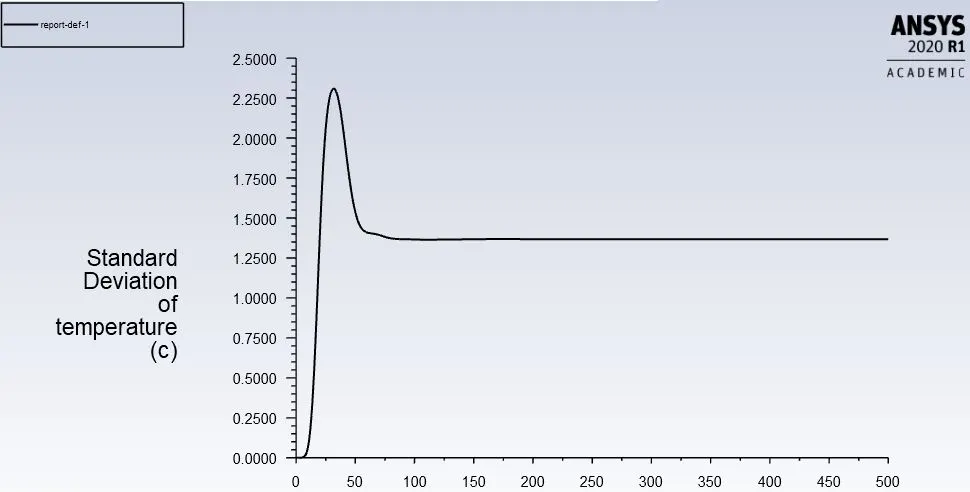
>Standard Deviation of Temperature plot at Outlet:
>Residual Plots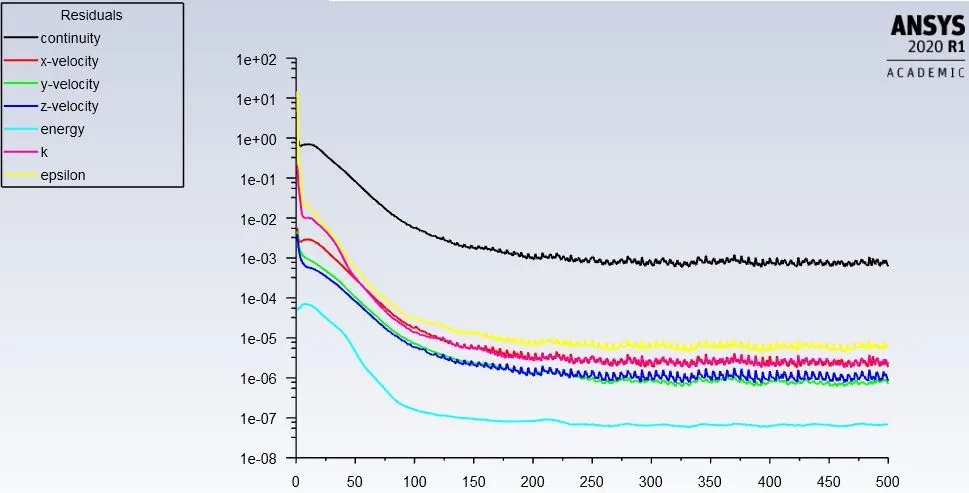 :
:
-Results:
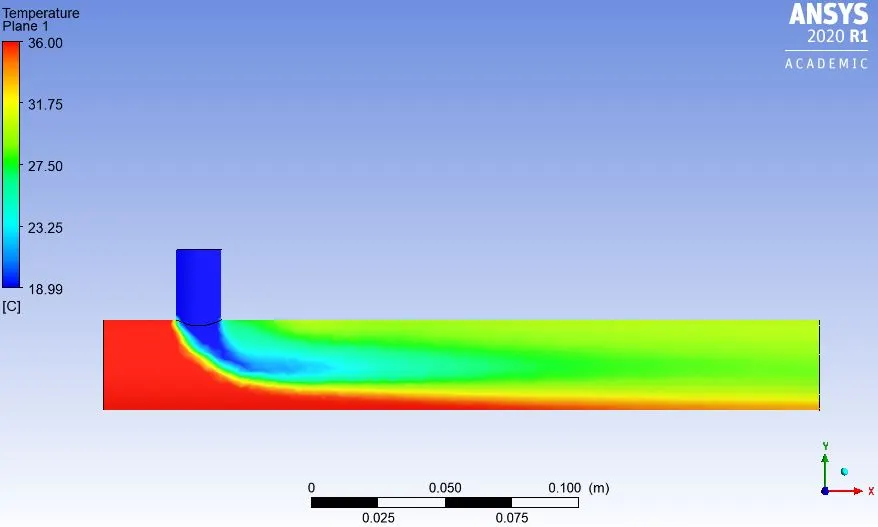
>Temperature Contour Plot on the cut plane along the Pipe:
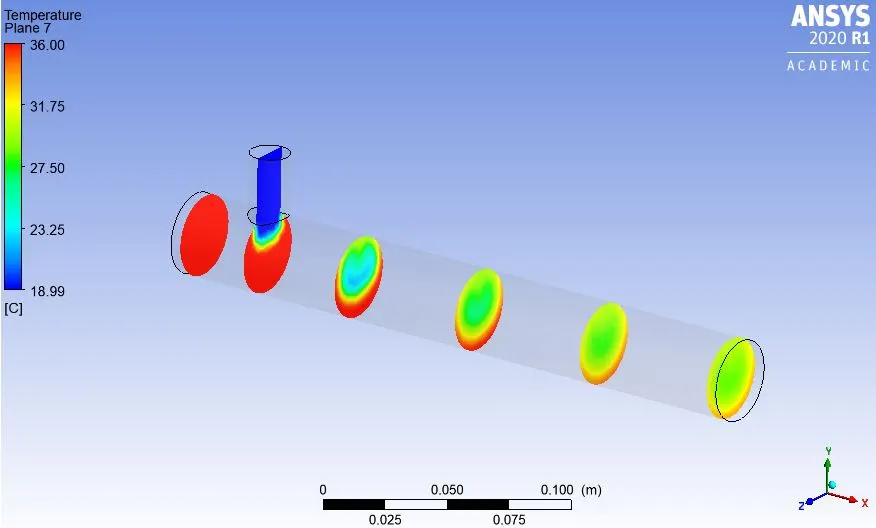
>Temperature Contour Plot on the cut plane across the Pipe:
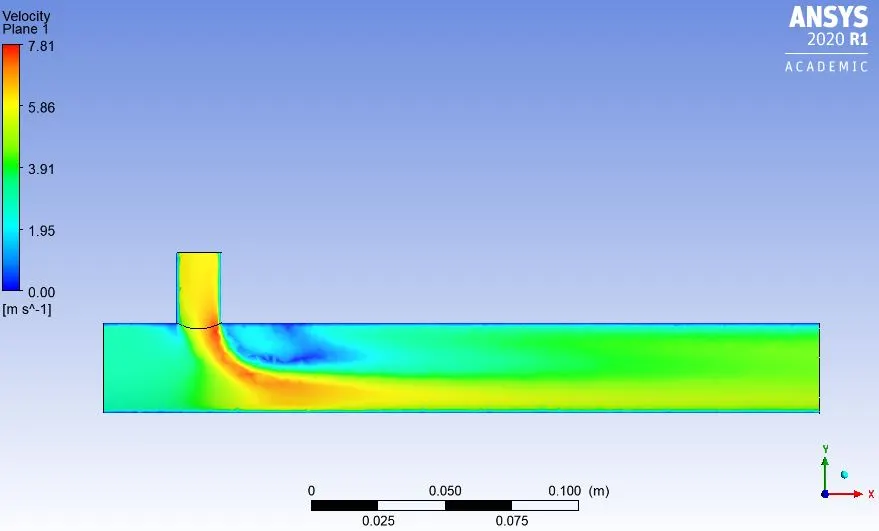
>Velocity Contour Plot on the cut plane along the Pipe:
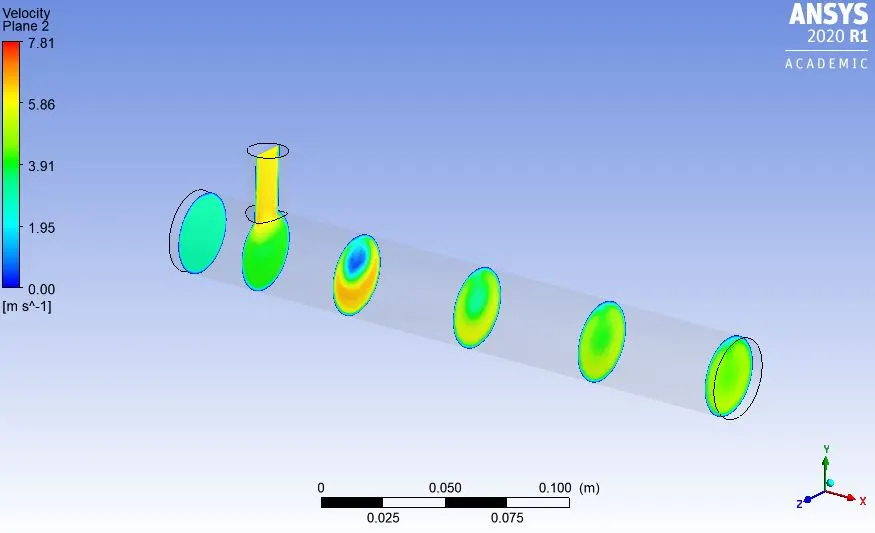
>Velocity Contour Plot on the cut plane across the Pipe:
>Temperature Line Contour along and across the length of pipe:
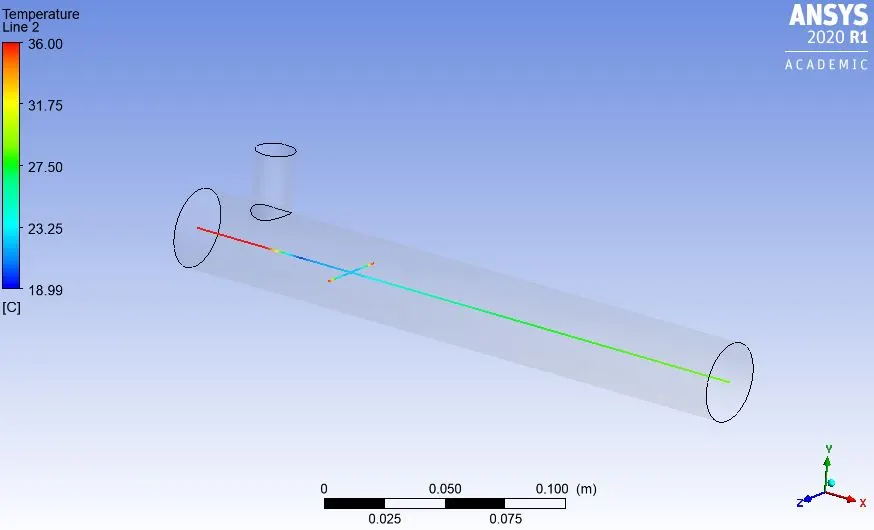
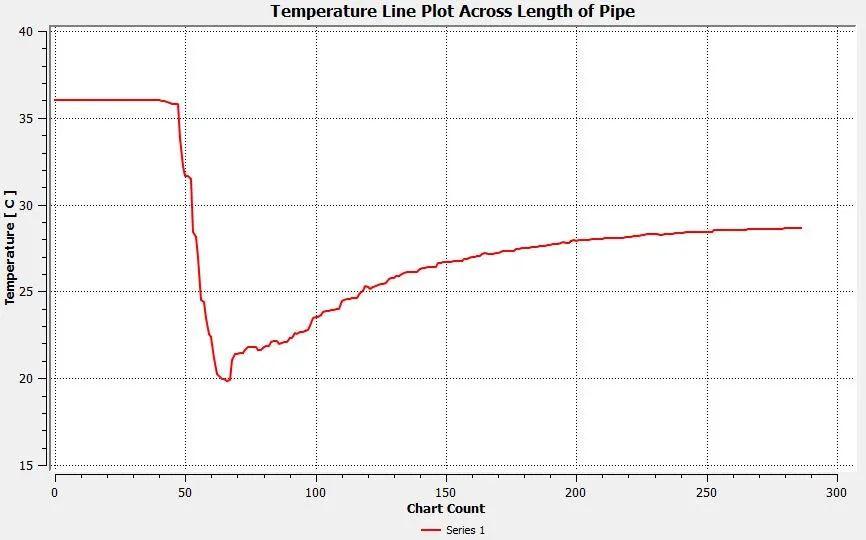
>Temperature Line Plot along the length of pipe:
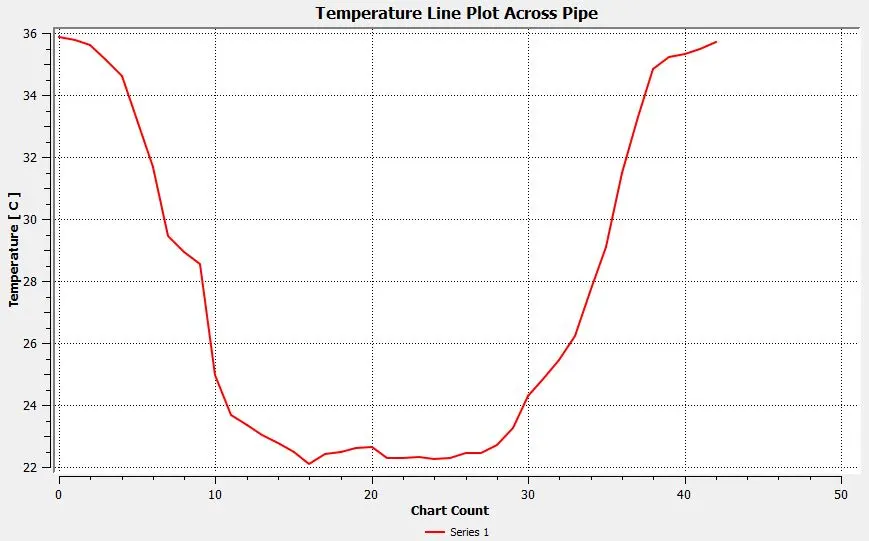
>Temperature Line Plot across the length of pipe:
>Velocity Line Contour along and across the length of pipe:
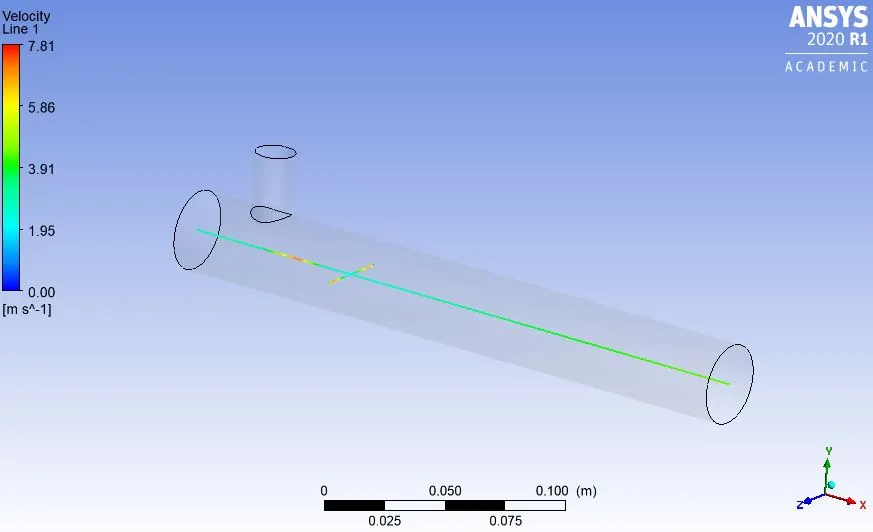
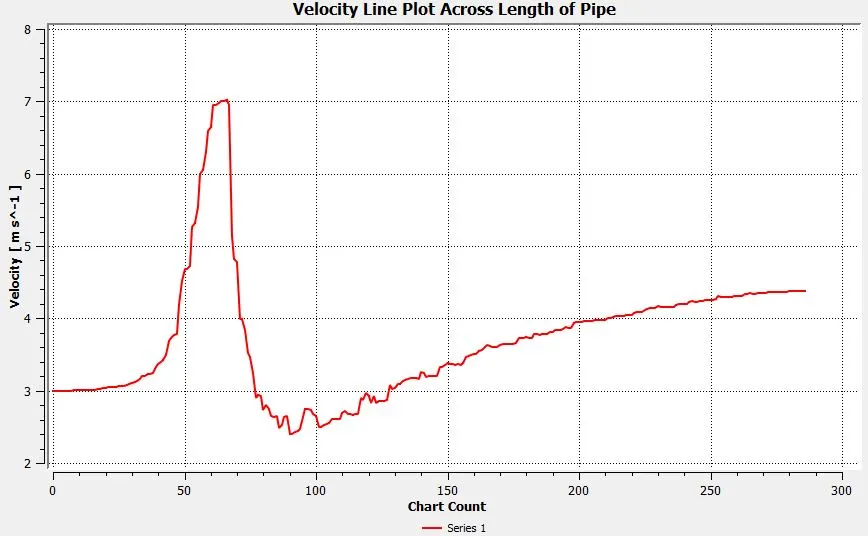
>Velocity Line Plot along the length of pipe:
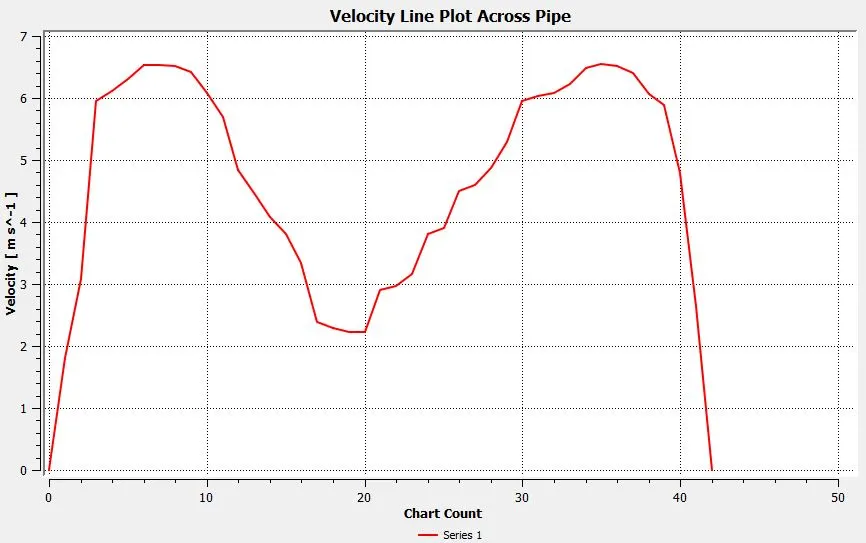
>Velocity Line Plot across the length of pipe:
#Case 2B:
- Long mixing tee with a hot inlet velocity of 3m/s, hot inlet temperature of 360C & the Cold inlet temperature of at 190C.
- Momentum ratio = 4
- K-Epsilon Model
-Solution:
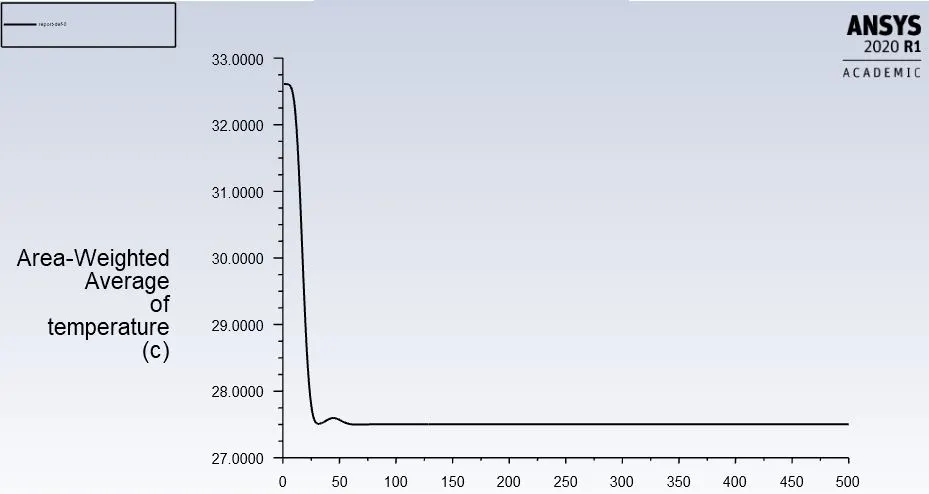
>Area Weighted Average Temperature plot at Outlet:
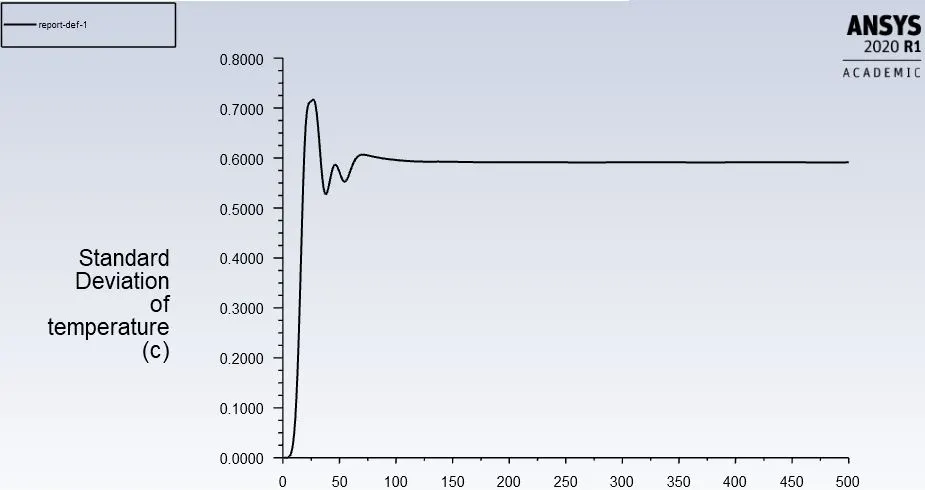
>Standard Deviation of Temperature plot at Outlet:
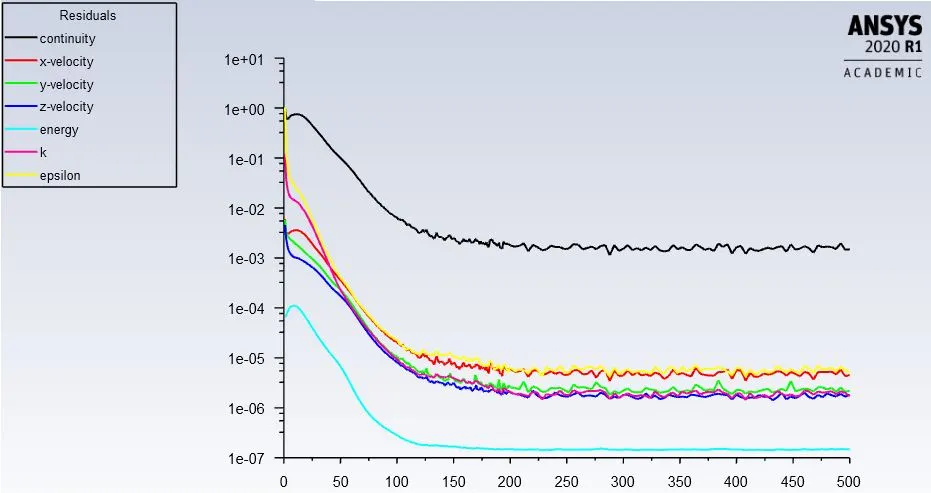
>Residual Plots:
-Results:
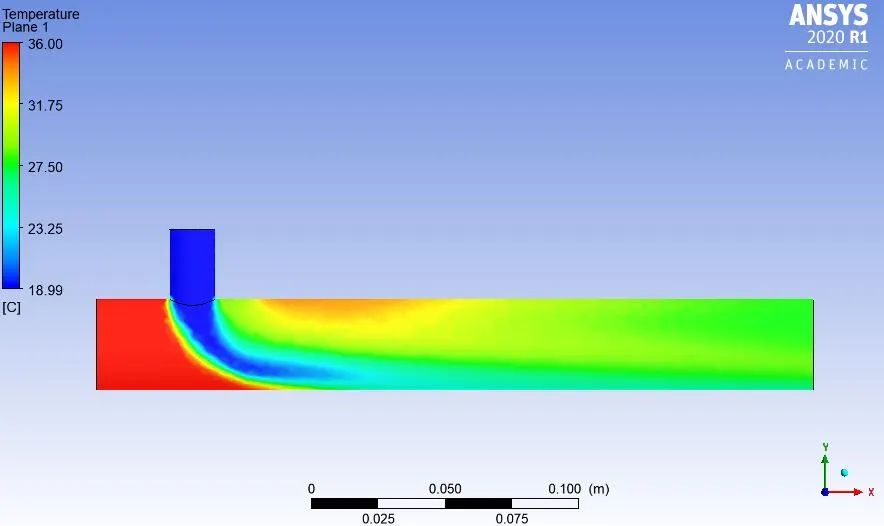
>Temperature Contour Plot on the cut plane along the Pipe:
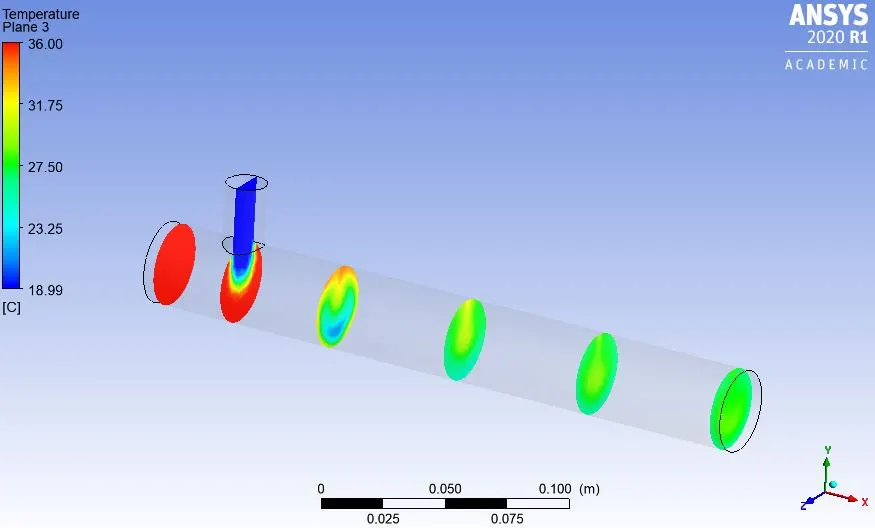
>Temperature Contour Plot on the cut plane across the Pipe:
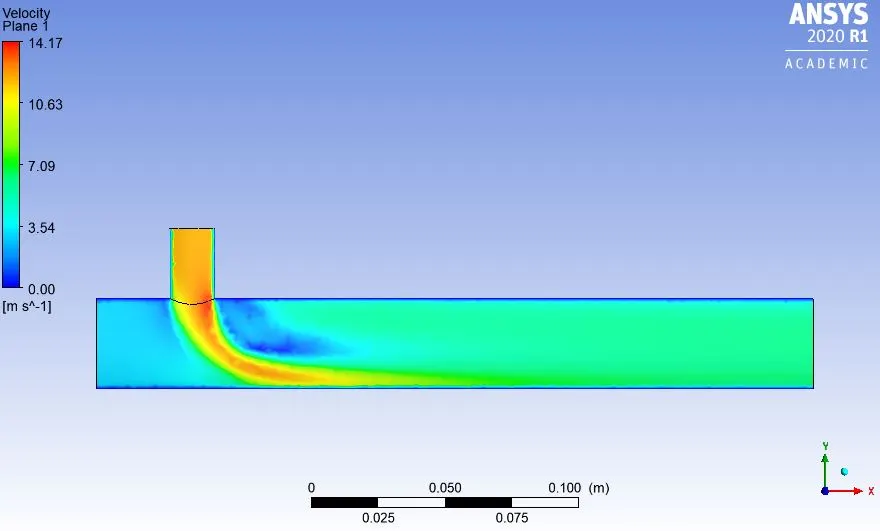
>Velocity Contour Plot on the cut plane along the Pipe:
>Velocity Contour Plot on the cut plane across the Pipe:
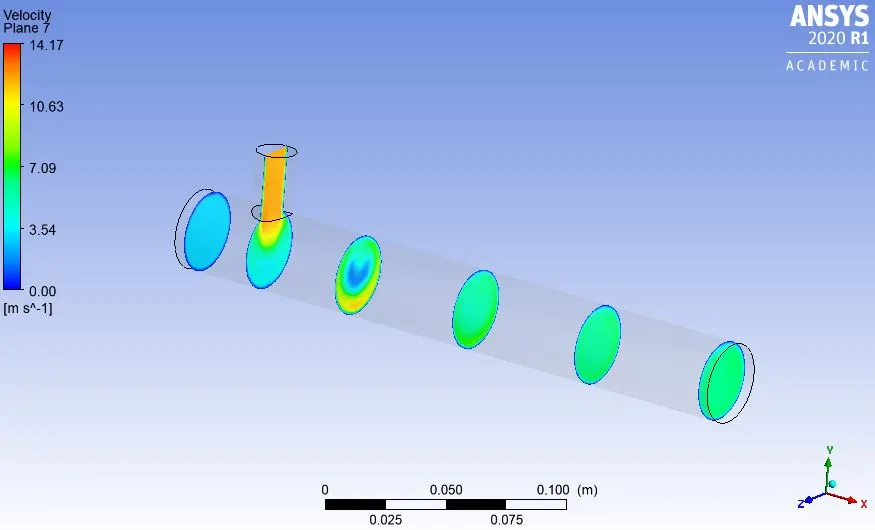
>Temperature Line Contour along and across the length of pipe:
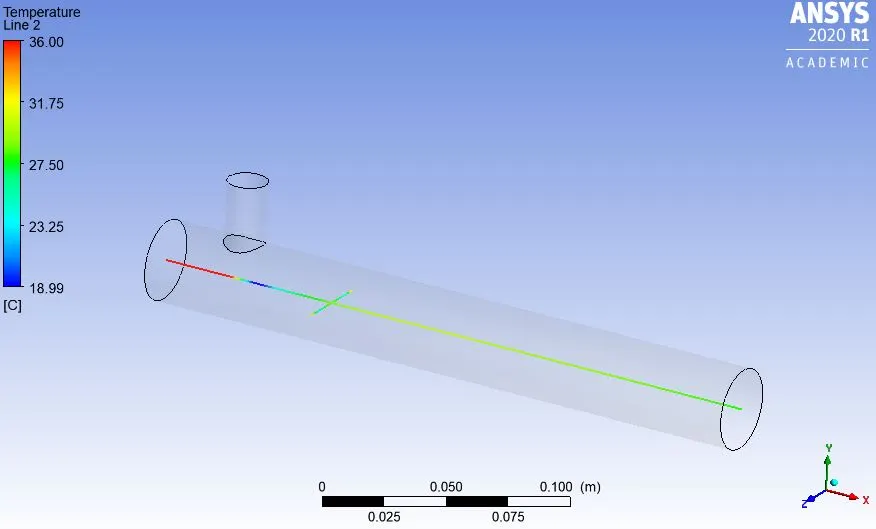
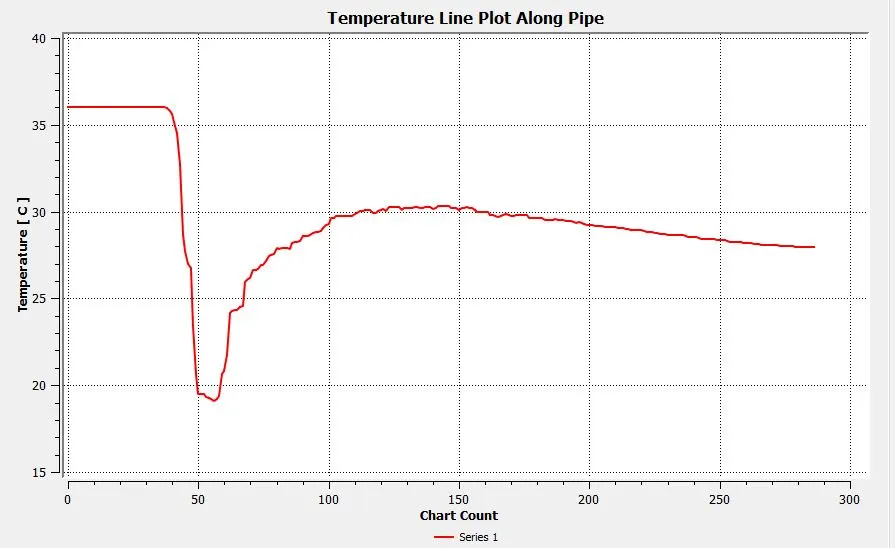
>Temperature Line Plot along the length of pipe:
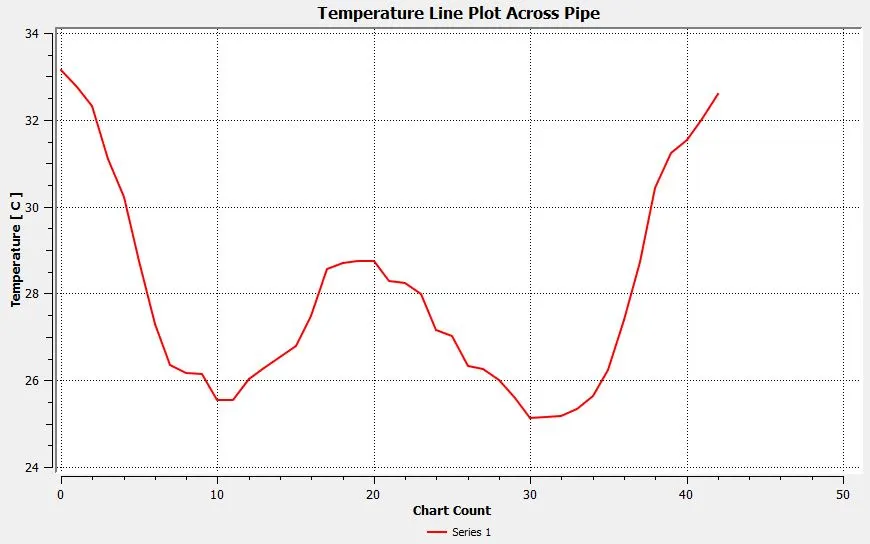
>Temperature Line Plot across the length of pipe:
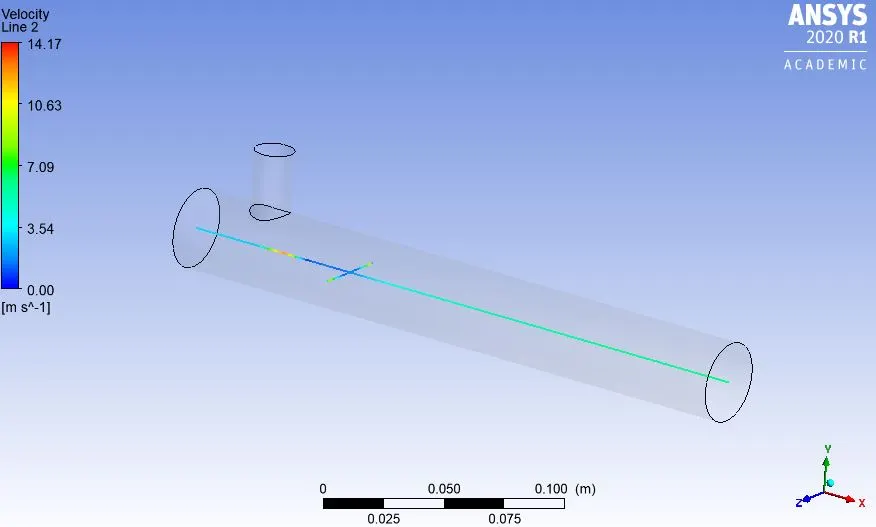
>Velocity Line Contour along and across the length of pipe:
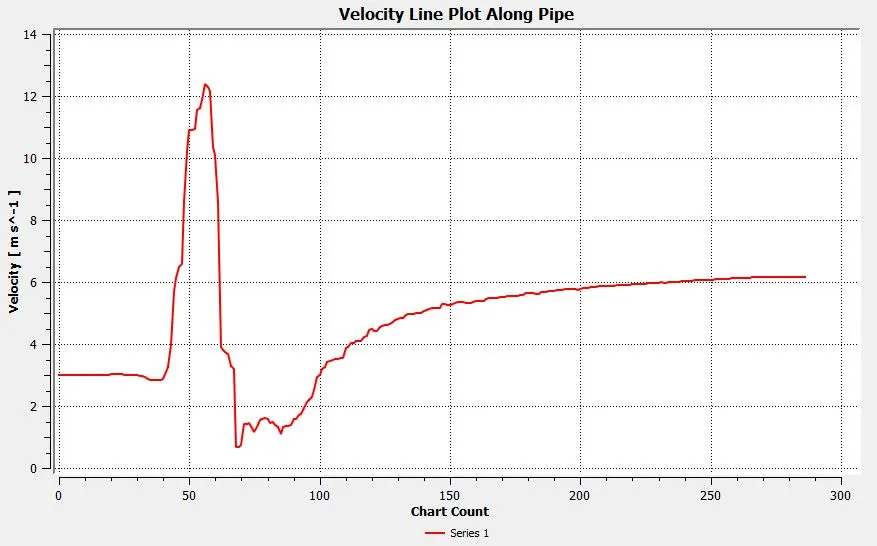
>Velocity Line Plot along the length of pipe:
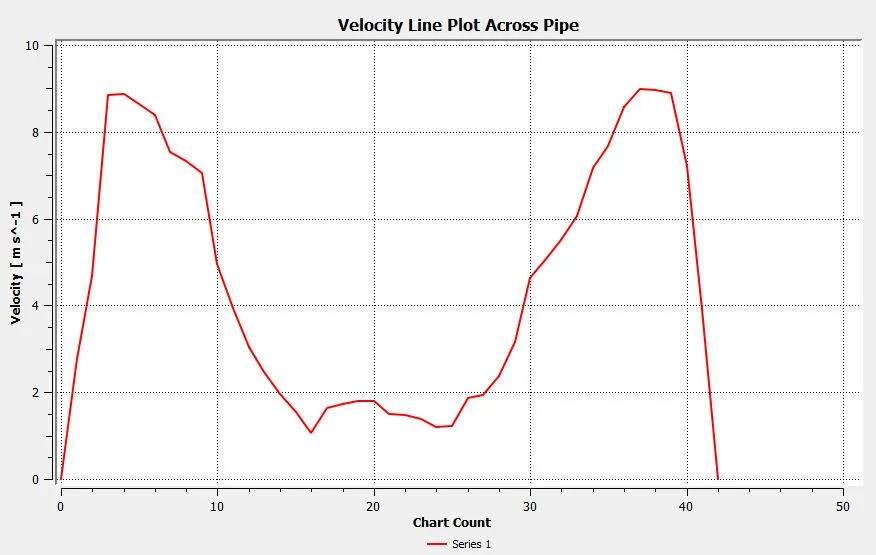
>Velocity Line Plot across the length of pipe:
4) Effect of Length and Momentum Ratio on Results:
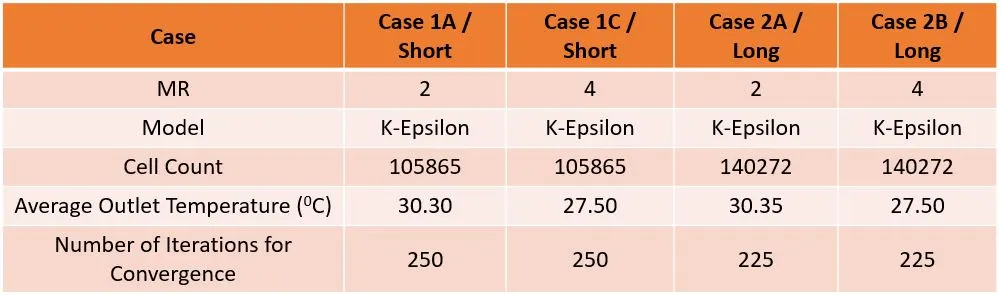
From the above results, we can conclude the following:
a) The length of pipe doesn’t affect the mixing efficiency and outlet temperature.
b) Better mixing efficiency and low temperature of air mixture at outlet can be obtained by increase in velocity at Inlet Y. Hence, increase in momentum ratio enhances the mixing efficiency and outlet temperature of air mixture at outlet of the Tee.
5) Mesh independent study for Case 1A:
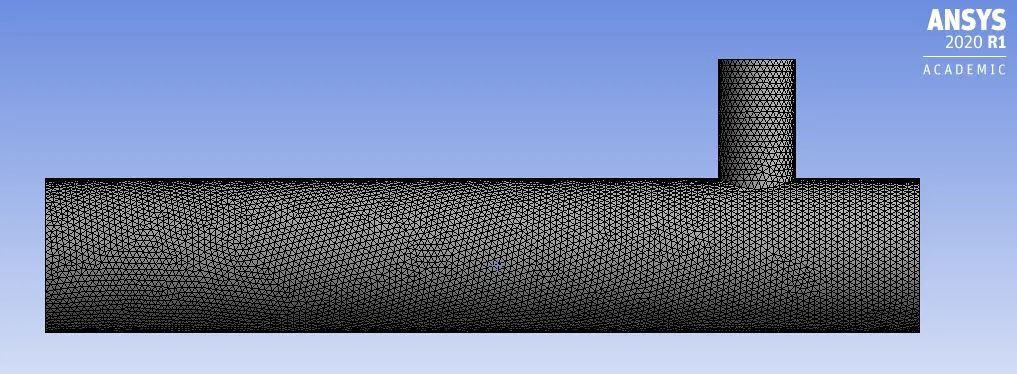
Here, a mesh independent study is performed on Case 1A for three different mesh sizes (0.0015m, 0.0020m and 0.0025m).
#Case 1A:
- Short mixing tee with a hot inlet velocity of 3m/s, hot inlet temperature of 360C & the Cold inlet temperature of at 190C.
- Momentum ratio = 2
- K-Epsilon Model
-Type of Meshing: Tetrahedral
-Mesh Size = 0.0015 m
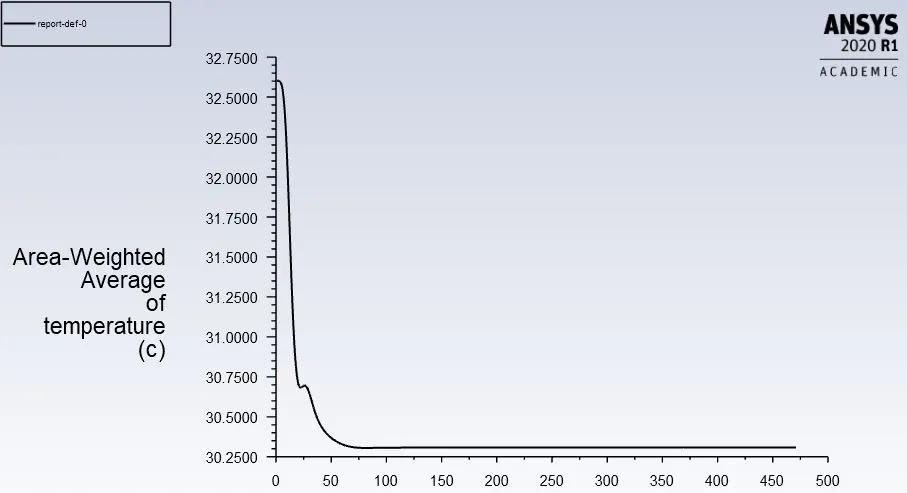
>Area Weighted Average Temperature plot at Outlet:
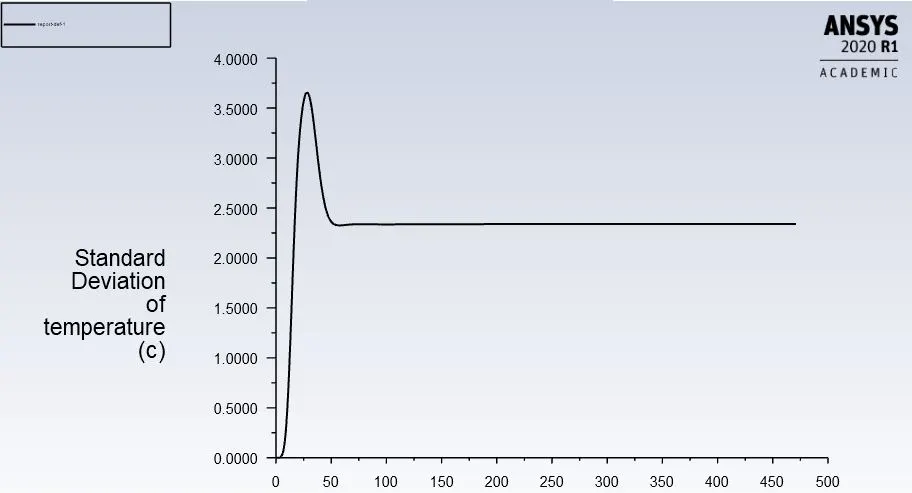
>Standard Deviation of Temperature plot at Outlet:
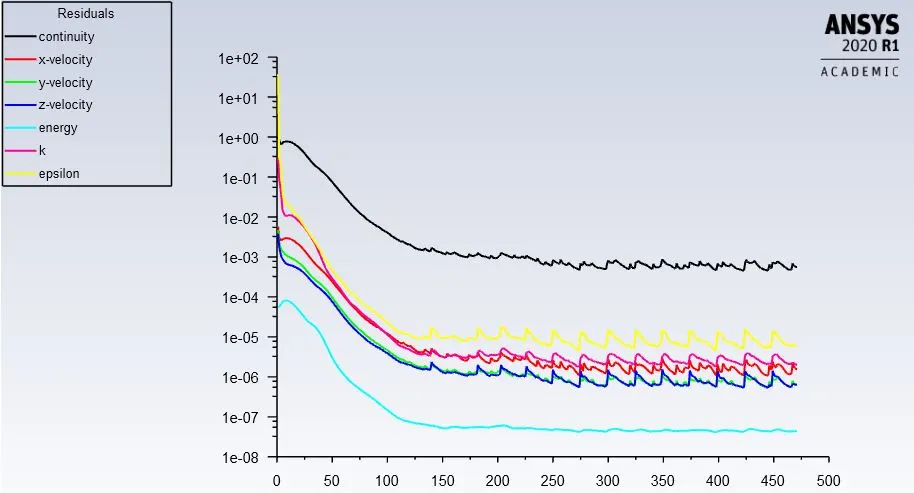
>Residuals Plot:
-Mesh Size = 0.0020 m
>Area Weighted Average Temperature plot at Outlet:
>Standard Deviation of Temperature plot at Outlet:
>Residuals Plot:
-Mesh Size = 0.0025 m
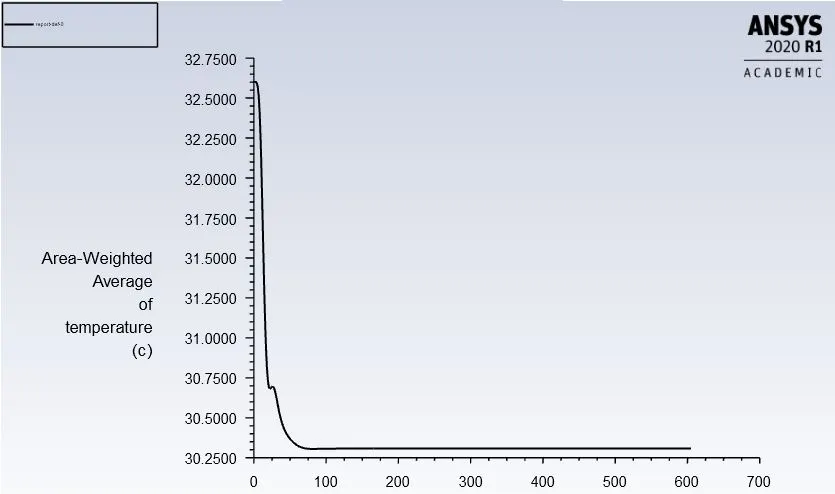
>Area Weighted Average Temperature plot at Outlet:
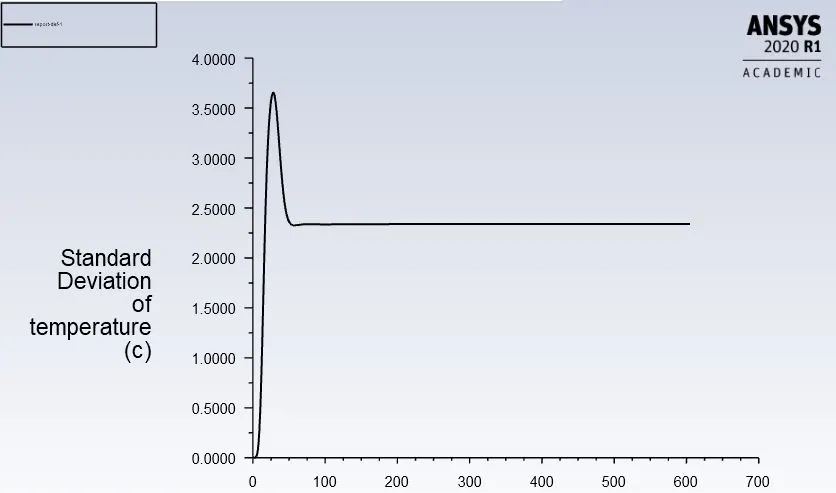
>Standard Deviation of Temperature plot at Outlet:
>Residuals Plot:
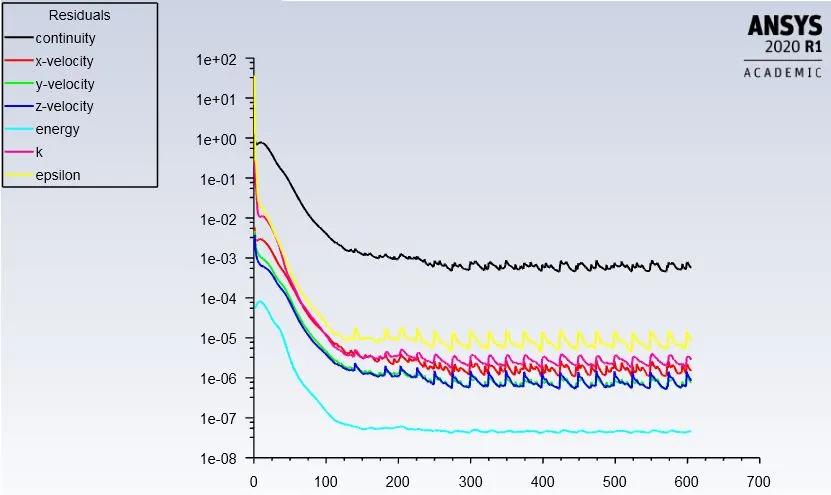
-Results of Mesh Independence Study:
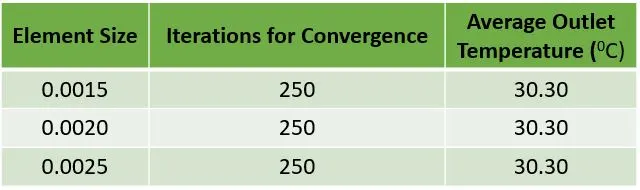
Reviewing the above results, we can conclude that change in mesh size doesn’t affect the results of the simulation.