Inlet Valve Assembly Flow Bench Simulation
AIM: To model and simulate the flow of air-fuel mixture in an inlet valve using flowbench.
OBJECTIVE:
1. To conduct Grid dependence test.
2. For three grids run the simulation at a particular valve lift and explain the results and outcome.
3. To find out the effect of valve lift on mass flow rate
4. Run a parametric sweep to show the effect of valve lift on mass flow rate once the best grid is finalised.
THEORY:
An air flow bench is a device used for testing the internal aerodynamic qualities of an engine component and is related to the more familiar wind tunnel.
It is used primarily for testing the intake and exhaust ports of cylinder heads of internal combustion engines. It is also used to test the flow capabilities of any component such as air filters, carburetors, manifolds or any other part that is required to flow gas. A flow bench is one of the primary tools of high performance engine builders, and porting cylinder heads would be strictly hit or miss without it.
Consider the illustrating digram given below:
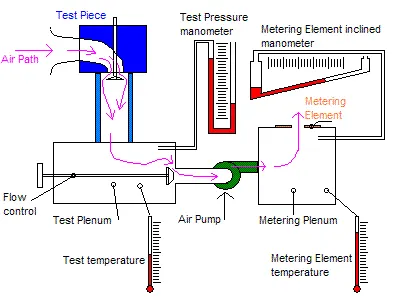
A flow bench consists of an air pump of some sort, a metering element, pressure and temperature measuring instruments such as manometers, and various controls. The test piece is attached in series with the pump and measuring element and air is pumped through the whole system. Therefore, all the air passing through the metering element also passes through the test piece. Because the volume flow rate through the metering element is known and the flow through the test piece is the same, it is also known. The mass flow rate can be calculated using the known pressure and temperature data to calculate air densities, and multiplying by the volume flow rate.
FLOW SIMULATION SETUP:
1. A CAD model of a simple valve having an inlet port is created in Solidworks, by sketching a cylinder and then using the sweep command to create the inlet pipe as well as the port. Now, according to the geometry of the valve, sketch the actual inlet port with a push rod.
2. Enable Flow Simulation from the add-ins menu.
3. After that, the flow simulation wizard is used to set up all the parameters of the mathematical model.
4. Steps for wizard: (Note that gravity is checked, i.e. there is gravity involved in this study)
- Give a suitable project name.
- Select a proper unit system, preferably SI system.
- Select a flow type. In our case, the flow is over the cylinder. Hence, it is an external flow.
- Select the proper fluid that is used in the simulation. In this case, the fluid is air. Also, select the proper flow type, depending on the nature of the flow i.e laminar, turbulent or mixed.
- Set wall conditions as it is. Do not make any changes as far as the challenge is considered.
- Now, set the velocity of the flow of the fluid along the proper direction, in X direction in our case.
5. Since this is an internal flow, the boundary conditions are needed to be set up. The typical boundary conditions used in this simulation are:
- Total Pressure at inlet, equal to 5 bar, i.e 506625 Pa.
- Static pressure at outlet, equal to atmospheric pressure.
- Real wall condition at all the inner walls of the valve and the valve body.
6. Check the computational domain after setting up the flow simulation. If the size of the domain is adequate, leave the size as it is.
7. The next most important step is to check the grid dependency. This basically refers to the mesh size. Finer the mesh, greater is the accuracy of the results of the simulation. Initially, the mesh size is set to 3 and the simulation is run. Similarly, the simulation is run at mesh sizes 4 and 5 respectively. However, at mesh size 5, the computational time required for processing the results was too high as the laptop was not up to those specifications. Hence, the best grid of 4 was selected.
8. After selecting the best grid, the local mesh refinement was done to improve the accuracy of the results.
9. Set the global goals as well as the local goals. In our case, the main goal is to find out the mass flow rate at various positions of the valve, i.e at different valve lifts.
10. Finally, create the lids as the inlet and the outlet must be perfectly closed. The simulation study was conducted for 0.003 seconds approximately.
11. Run the simulation using parametric study as follows:
- Select the governing dimension which controls the valve lift as the input variable.Enter the range of the valve lift(min. 0.001m and max. 0.007m) and the number of iterations for which the simulation must be run.
- ii. Select the output parameter as the main surface goal, i.e the mass flow rate and the required cut plots.
- iii. Check the scenario tab and run the simulation.
OBSERVATION AND RESULTS:
1. At mesh setting of 3:
Velocity contour plot:
Pressure contour plot:
2. At mesh setting of 4:
Velocity contour plot:
Pressure contour plot:
3. At mesh setting of 5:
Velocity contour plot:
At 0.001 m
Pressure contour plot:
At 0.001 m
Due to laptop of lower configuration, the computational time for mesh size 5 was very high. Hence, mesh size 4 was concluded as the best grid.
The velocity plots at the various lift positions between 0.002 m to 0.007 m are shown below:
0.002 m 0.003 m 0.004 m
0.005 m 0.006 m 0.007 m
The pressure plots at the various lift positions between 0.002 m to 0.007 m are shown below:
0.002 m 0.003 m 0.004 m
0.005 m 0.006 m 0.007 m
Flow trajectory at 0.001 m is:
Mass flow rates in kg/s are obtained after running the parametric studies:
The variation of the mass flow rates with change is valve lift is graphically represented as follows:
Animation of trajectory flow:
CONCLUSION:
1. From the velocity plot, we conclude as the valve lift increases, the inlet velocity increases.
2. From the goal plots, we conclude that as the valve lift increases, the mass flow rate also increases but with a negative slope.This indicates that after a particular point, the valve lift would not have any effect on the mass flow rate.
3. After 2 iterations, we can see that the rate of increase of mass flow is very less, i.e. `d/dt((dM)/dt)` is very less.