Independent Research Project: Seattle Building Energy Benchmarking - Data Analysis
Motivation for the project and its engineering significance:
In the context of energy-saving, energy management is the process of monitoring, controlling, and conserving energy in a building or an organization. There is a global need to save energy and this need affects energy prices, emission targets, and legislation. According to the United Nations Environment Program, buildings and their construction account for 36% of global energy use and 39% of energy-related carbon dioxide emissions. Controlling and reducing a building's energy consumption has several benefits including reduced costs, reduced carbon emissions, and reduced risk. Energy management in buildings starts with metering energy consumption & collecting the data and finding & quantifying opportunities to save energy. As a mechanical engineer specializing in Energy & Sustainability, I chose this project to analyze the energy data of buildings using Python and benchmark their performance so as to find potential opportunities for improvement.
Dataset used:
2018 Building Energy Data - Seattle : Source - https://catalog.data.gov/
All our findings are based on the above dataset.
In order to benchmark the property's energy use, we use the U.S. EUI by Property Type Technical Reference from ENERGY STAR.
ENERGY STAR Technical Reference : Source - https://portfoliomanager.energystar.gov/
Seattle Building Energy Benchmarking - Data Analysis
Aim:
The project aims to write a program in Python:
- To show the variation of Source EUI WN corresponding to the different property types using a boxplot
- To determine the summary statistics to better understand the given data
- To benchmark the performance of different properties/ buildings so as to find potential opportunities for improvement.
Background:
EUI
Energy Use Intensity (EUI) expresses a building's energy use as a function of its size or other characteristics. In our case, the EUI is calculated by dividing the total energy consumed by the building in one year (kBtu) by the total gross floor area of the building (sf).
EUI = Annual Energy consumption / Gross floor area (Units: kBtu/sf)
There are two types of EUI, namely Site EUI and Source EUI. Site EUI is the amount if heat and electricity a building consumes as reflected in utility bills. Source EUI traces heat and electricity use back to the original raw input creating a more holistic understanding of a building's energy use.
Source EUI WN is the Weather Normalized Source EUI which includes the relationship between temperature and energy exhibited by the property.
ENERGY STAR Portfolio Manager Technical Reference
ENERGY STAR is a program run by the U.S. Environmental Protection Agency (EPA) and the U.S. Department of Energy (DOE) that aims to help consumers, businesses, and industry save money and protect the environment by the adoption of energy efficient products and practices. ENERGY STAR Portfolio Manager is a no-cost, interactive energy management tool that allows secure tracking and assessment of energy and water consumption across the building portfolio. The reference table provided by ENERGY STAR is designed to assist in the comparison of a property's energy use to the national median energy use of similar properties.
Boxplot
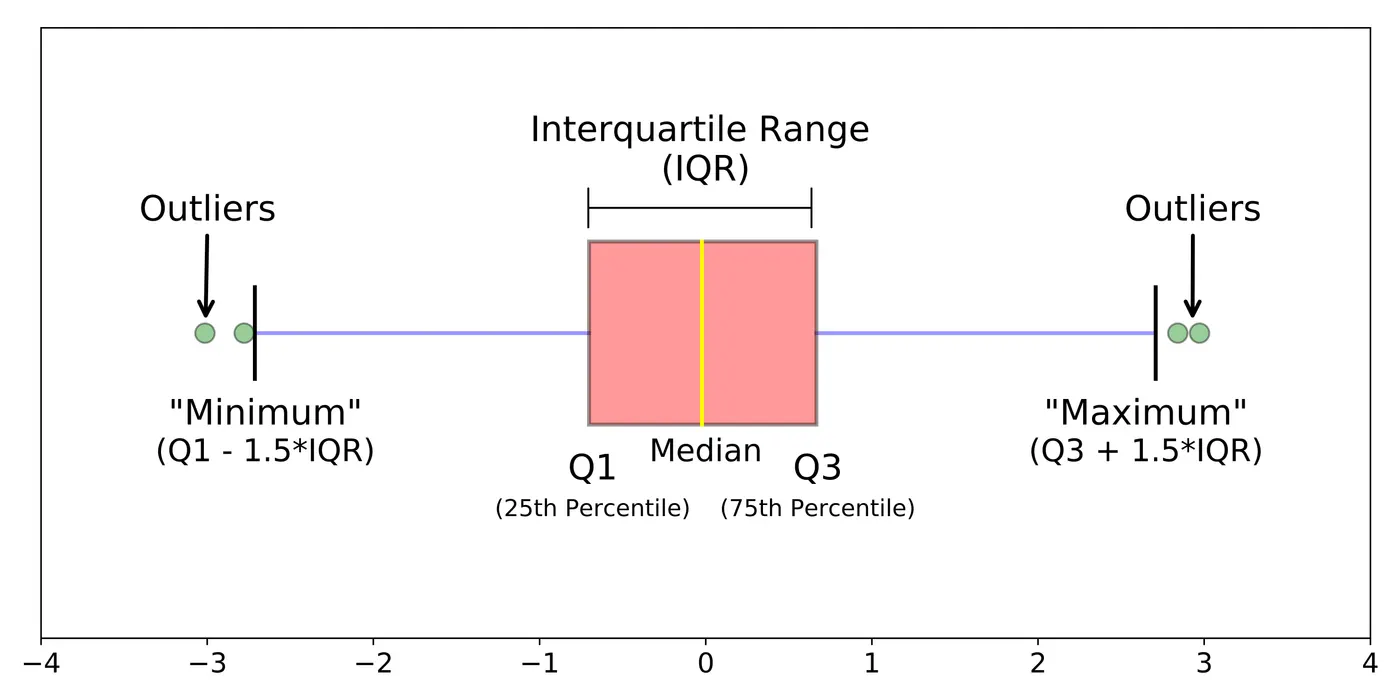
Image Source: https://towardsdatascience.com/
A boxplot is a type of chart used in data analysis to visualize the distribution of numerical data and skewness through displaying the quartiles and whiskers. They show the five-number summary of a set of data which includes the minimum score (Min), first quartile (Q1), median, third quartile (Q3), and maximum score (Max).
Procedure:
The stepwise procedure is shown in the Python code below.
Python Code: (with explanation)
# Title: Seattle Building Energy Benchmarking - Data Analysis

#Importing required libraries
import matplotlib.pyplot as plt
import numpy as np
import pandas as pd

# Reading the csv data using pandas library and storing it
seattle_df = pd.read_csv('2018_Building_Energy_Data_Seattle.csv')
# Dropping rows from the dataframe with NaN values in the columns of interest
seattle_df = seattle_df.dropna(subset = ['SourceEUIWN(kBtu/sf)', 'PrimaryPropertyType'])
# Counting the number of values under each category in the column 'PrimaryPropertyType'
count = seattle_df['PrimaryPropertyType'].value_counts()
print(count, 'n n n')
# Creating a list property_types after selecting ten different property types from the dataframe
property_types = ['Multifamily Housing', 'Office', 'K-12 School', 'Hotel', 'Retail Store', 'Worship Facility', 'Senior Care Community', 'Self-Storage Facility', 'College/University', 'Supermarket/Grocery Store']
# Creating a new dataframe with rows and columns corresponding to the chosen ten property types
seattle_df_1 = seattle_df[seattle_df.PrimaryPropertyType.isin(property_types)]
# Counting the number of values under each category in the column 'PrimaryPropertyType' in the newly created dataframe - seattle_df_1
count1  = seattle_df_1['PrimaryPropertyType'].value_counts()
print(count1, 'n n n')

# Horizontal Boxplot of Weather Normalised EUI for each category under 'PrimaryPropertyType' column
seattle_df_1.boxplot(column = 'SourceEUIWN(kBtu/sf)', by = 'PrimaryPropertyType', vert = False)
plt.title('Boxplot of SourceEUI for different property types')
plt.suptitle('')
plt.xlabel('Weather Normalised Source EUI in kBtu/sf')
plt.show()


# Creating a new list of the selected property types
[t1, t2, t3, t4, t5, t6, t7, t8, t9, t10] = [['Multifamily Housing'], ['Office'], ['K-12 School'], ['Hotel'], ['Retail Store'],  ['Worship Facility'], ['Senior Care Community'], ['Self-Storage Facility'], ['College/University'], ['Supermarket/Grocery Store']]
# Creating a list of SourceEUI values for each property type based on median values from ENERGY STAR Portfolio Manager Technical Reference - U.S. EUI by Property Type
[eui1, eui2, eui3, eui4, eui5, eui6, eui7, eui8, eui9, eui10] = [118.1, 116.4, 52.9, 146.7, 120.0, 58.4, 213.2, 47.8, 180.6, 444.0]

# Creating a dataframe for each of the ten property types as shown below, a numpy array to store the corresponding SourceEUI values, computing summary of statistics pertaining to the dataframe column 'SourceEUIWN(kBtu/sf)', counting the number of values under each property types which have SourceEUI value greater than that of the U.S. National Median Reference Value

# 1. Multifamily Housing
df1 = seattle_df_1[seattle_df_1.PrimaryPropertyType.isin(t1)]
print(df1['SourceEUIWN(kBtu/sf)'].describe(), 'n')
a1 = np.array(df1['SourceEUIWN(kBtu/sf)'])
b1 = np.count_nonzero(a1[a1 > eui1])
print('Non-compliant', t1[0], 'count:' , b1, 'n n n')

#2. Office
df2 = seattle_df_1[seattle_df_1.PrimaryPropertyType.isin(t2)]
print(df2['SourceEUIWN(kBtu/sf)'].describe(), 'n')
a2 = np.array(df2['SourceEUIWN(kBtu/sf)'])
b2 = np.count_nonzero(a2[a2 > eui2])
print('Non-compliant', t2[0], 'count:' , b2, 'n n n')

#3. K-12 School
df3 = seattle_df_1[seattle_df_1.PrimaryPropertyType.isin(t3)]
print(df3['SourceEUIWN(kBtu/sf)'].describe(), 'n')
a3 = np.array(df3['SourceEUIWN(kBtu/sf)'])
b3 = np.count_nonzero(a3[a3 > eui3])
print('Non-compliant', t3[0], 'count:' , b3, 'n n n')

#4. Retail Store
df4 = seattle_df_1[seattle_df_1.PrimaryPropertyType.isin(t4)]
print(df4['SourceEUIWN(kBtu/sf)'].describe(), 'n')
a4 = np.array(df4['SourceEUIWN(kBtu/sf)'])
b4 = np.count_nonzero(a4[a4 > eui4])
print('Non-compliant', t4[0], 'count:' , b4, 'n n n')

#5. Hotel
df5 = seattle_df_1[seattle_df_1.PrimaryPropertyType.isin(t5)]
print(df5['SourceEUIWN(kBtu/sf)'].describe(), 'n')
a5 = np.array(df5['SourceEUIWN(kBtu/sf)'])
b5 = np.count_nonzero(a5[a5 > eui5])
print('Non-compliant', t5[0], 'count:' , b5, 'n n n')

#6. Worship Facility
df6 = seattle_df_1[seattle_df_1.PrimaryPropertyType.isin(t6)]
print(df6['SourceEUIWN(kBtu/sf)'].describe(), 'n')
a6 = np.array(df6['SourceEUIWN(kBtu/sf)'])
b6 = np.count_nonzero(a6[a6 > eui6])
print('Non-compliant', t6[0], 'count:' , b6, 'n n n')

#7. Senior Care Community
df7 = seattle_df_1[seattle_df_1.PrimaryPropertyType.isin(t7)]
print(df7['SourceEUIWN(kBtu/sf)'].describe(), 'n')
a7 = np.array(df7['SourceEUIWN(kBtu/sf)'])
b7 = np.count_nonzero(a7[a7 > eui7])
print('Non-compliant', t7[0], 'count:' , b7, 'n n n')

#8. Self-Storage Facility
df8 = seattle_df_1[seattle_df_1.PrimaryPropertyType.isin(t8)]
print(df8['SourceEUIWN(kBtu/sf)'].describe(), 'n')
a8 = np.array(df8['SourceEUIWN(kBtu/sf)'])
b8 = np.count_nonzero(a8[a8 > eui8])
print('Non-compliant', t8[0], 'count:' , b8, 'n n n')

#9. College/University
df9 = seattle_df_1[seattle_df_1.PrimaryPropertyType.isin(t9)]
print(df9['SourceEUIWN(kBtu/sf)'].describe(), 'n')
a9 = np.array(df9['SourceEUIWN(kBtu/sf)'])
b9 = np.count_nonzero(a9[a9 > eui9])
print('Non-compliant', t9[0], 'count:' , b9, 'n n n')

#10. Supermarket/Grocery Store
df10 = seattle_df_1[seattle_df_1.PrimaryPropertyType.isin(t10)]
print(df10['SourceEUIWN(kBtu/sf)'].describe(), 'n')
a10 = np.array(df10['SourceEUIWN(kBtu/sf)'])
b10 = np.count_nonzero(a10[a10 > eui10])
print('Non-compliant', t10[0], 'count:' , b10, 'n n n')
Results:
- Boxplot of Source EUI WN for different property types:
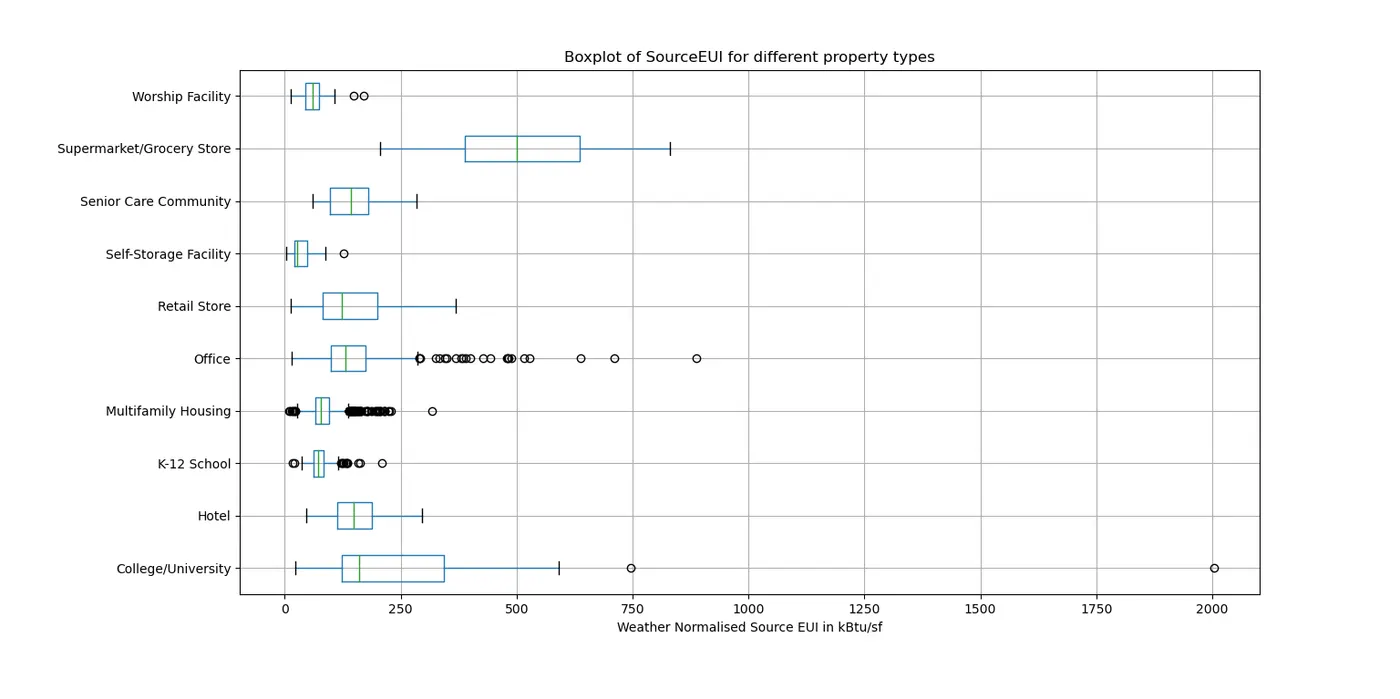
The above boxplots display the distribution of Weather Normalized Source EUI data for each property type based on the five number summary shown below.
- Summary Statistics:
| S.No | Property Type | Mean | Min | Q1 | Median | Q3 | Max |
| 1 | Multifamily Housing | 84.00 | 8.30 | 66.93 | 78.70 | 95.20 | 318.50 |
| 2 | Office | 150.62 | 14.50 | 99.20 | 131.85 | 174.23 | 887.10 |
| 3 | K-12 School | 76.59 | 16.30 | 62.28 | 71.10 | 84.20 | 210.30 |
| 4 | Hotel | 150.45 | 46.00 | 113.45 | 148.40 | 186.95 | 295.60 |
| 5 | Retail Store | 142.59 | 12.60 | 82.40 | 122.55 | 200.15 | 368.60 |
| 6 | Worship Facility | 62.50 | 13.90 | 44.88 | 60.70 | 73.23 | 169.60 |
| 7 | Senior Care Community | 146.67 | 60.60 | 97.13 | 143.05 | 180.38 | 284.00 |
| 8 | Self-Storage Facility | 36.72 | 3.50 | 20.80 | 26.60 | 48.90 | 126.80 |
| 9 | College/University | 271.97 | 22.80 | 122.50 | 160.20 | 343.65 | 2003.10 |
| 10 | Supermarket/Grocery Store | 504.37 | 205.50 | 388.70 | 499.45 | 636.43 | 830.90 |
- Benchmarking the performance of different property types:
| S.No | Property type | Building count | Energy Star compliant building count | Energy Star non-compliant building count | Energy Star compliant building percentage | Energy Star non-compliant building percentage |
| 1 | Multifamily Housing | 1742 | 1594 | 148 | 91.50 | 8.50 |
| 2 | Office | 464 | 169 | 295 | 36.42 | 63.58 |
| 3 | K-12 School | 136 | 12 | 124 | 8.82 | 91.18 |
| 4 | Hotel | 79 | 38 | 41 | 48.10 | 51.90 |
| 5 | Retail Store | 76 | 38 | 38 | 50.00 | 50.00 |
| 6 | Worship Facility | 68 | 31 | 37 | 45.59 | 54.41 |
| 7 | Senior Care Community | 44 | 38 | 6 | 86.36 | 13.64 |
| 8 | Self-Storage Facility | 41 | 30 | 11 | 73.17 | 26.83 |
| 9 | College/University | 39 | 22 | 17 | 56.41 | 43.59 |
| 10 | Supermarket/Grocery Store | 38 | 14 | 24 | 36.84 | 63.16 |
As seen from the above results, out of the selected ten property types, Multifamily Housing, Senior Care Community, and Self-Storage Facility perform well since majority of the buildings are ENERGY STAR compliant. However, property types such as Office, K-12 School, and Supermarket/Grocery Store along with other remaining property types are majorly ENERGY STAR non-compliant and are potential opportunities for implementing energy conservation measures in the city of Seattle, WA.