Response characteristics analysis and stability optimization of heavy vehicle suspension systems
AIM:
This project presents a method for systematic investigations on static and dynamic roll behavior and improvement to the stability dynamics based on increasing roll stiffness of the suspension. One of the major differences of this study from previous work is that it includes parametric sensitivity analysis in order to increase the safety margin from the roll angle threshold using the static and dynamic tests and it compares the results within themselves. As the physical tilt table test cannot be continued until vehicle rollover actually occurs, this test was performed in a simulation with a verified vehicle model using Adams/Car. Three different front anti roll-bar and two different front leaf springs were used during the tests in order to perform parametric sensitivity analysis and examine the effect of components on the stability performance.
In summary, within the scope of this work, experiments involving physical tests (i.e. tilt table, fishhook and cornering) and numerical calculations are included. In addition, verification of the virtual model, parametric sensitivity analysis and the comparison of the virtual test and the physical test is performed. Because of the vigorous verification, sensitivity analysis and validation process, the results can be more reliable compared to previous studies.
INTRODUCTION:
Heavy commercial vehicles may have stability problems when the driver must perform a quick maneuver to avoid an unexpected obstacle in the road.
Studies have shown that most of the severe roll-over accidents have been caused by poor dynamics which may be characterized by non-optimized roll stiffness and roll steer coefficient. The main group of vehicles which are more prone to rollover-accidents are buses and heavy-vehicles. Therefore, in this study, a virtual model of the midi bus (e.g. a heavy vehicle) is used to evaluate the stability based on roll stiffness and roll steer coefficient. In contrast to passenger cars, in midi-buses, the height of the centers of gravity and sprung mass are higher. Therefore, the design improvement for the stability characteristic of the midi bus is considered as a necessity.
In previous studies, the type of suspension and its subsystems were identified as critical in the overall stability of the vehicle. Studies have shown that mechanical suspension containing leaf spring positively affected the stability of the vehicle because the roll stiffness of the suspension is higher than the traditional suspension systems containing air bellow. Air suspension was identified as negatively impacting on stability. Therefore, if the suspension allows more roll to occur (low roll stiffness), the yaw-roll dynamic mode of the vehicle becomes weak and the tendency of vehicles to roll over increases. For this reason, the stability of the vehicle will be improved by increasing the roll stiffness of the suspension.
The stability of the vehicle is determined by toruqe values acting about the ground plane. To determine the stability characteristics of the vehicle, information related to the vehicle behavior during cornering, the main features of the vehicle such as center of gravity, track width and weight parameters should be considered as well as static stability factor (SSF).
As mentioned in the previous section, the lateral force that can be generated during cornering produces an overturning torque. Therefore, it tends to force the body to roll over. Lateral force at the center of gravity (CoG) can be translated to the roll center if the appropriate forces and moments are known. On the other hand, roll-center can be defined as a function of the load transfer characteristics of a suspension system. The suspension plays an important role in handling and stability through its effects on the body roll. In a similar way, suspension causes the center of gravity of the body to roll outward in a turn relative to the axle. Therefore, the characteristics of the suspension including roll stiffness take an important role in the stability because the roll stiffness is the most dominant parameter affecting the sprung mass movement. Suspension determines how sprung mass moves around the axis of rotation.
Roll stiffness is the torsional stiffness determined by the stiffness of the suspension measured about the roll center. If the suspension system has very stiff springs and anti-roll bars on one side, they cause less movement on the side they are assembled. Anti-roll bars are used in vehicles in order to provide roll-stiffness to enhance vehicle handling and stability during fast cornering. In previous studies, it was possible to obtain a considerable gain in reducing rolling when using the anti-roll bar . If the anti-roll bar diameter is changed, the stiffness of the anti-roll bar also changes. Using this simple relation, in this study, roll angle is reduced as much as possible by increased anti-roll bar and leaf spring stiffness via changing the diameter. Then the results are verified using static and dynamic tests. Stiffness of the anti-roll bar is calculated according to the SAE standards in each experimental analysis .
The anti-roll bar and leaf spring characteristics have been determined according to the design criteria that is created in benchmarking phase. If stiffness of the front anti-roll bar was increased more, this situation caused the understeer behavior to increase eventually leading the understeering characteristics to reach a dangerous limit. Therefore, the front anti-roll bar stiffness is limited to three different diameters in the parametric sensitivity analysis. The front leaf spring is chosen based on the allowable bearing capacity of the front axel and the ride height of the vehicle. Therefore, the stiffness of the front leaf spring is limited to two different stiffness values in the parametric sensitivity analysis. Studies have shown that there is a very strong link between static stability factor (SSF) of the heavy vehicle and the actual occurrence of rollover in accidents. SSF determines the rollover threshold of vehicle during steady speed cornering. SSF is a function of both the center of gravity height and vehicle track width and it is described by Eq. (1)
SSF = Tmin / 2.Hcg ...(1)
where,
Tmin = Minimum track width – (mm).
Hcg = The vertical distance between the roll center of the suspension and center of gravity of the vehicle (mm).
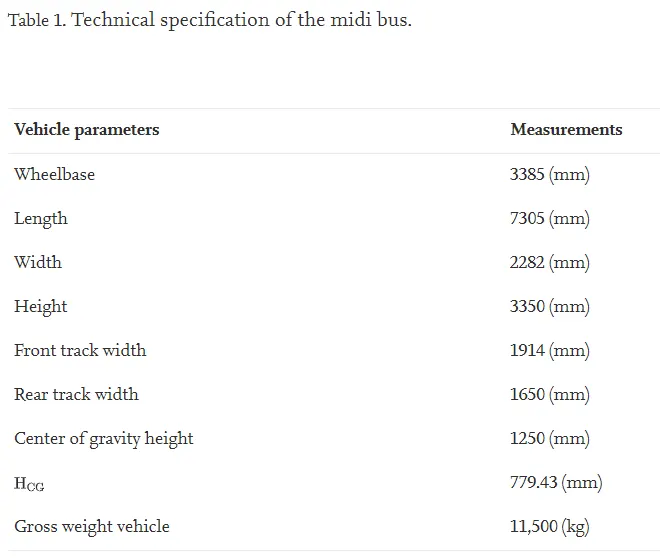
SSF is dependent on a number of unsprung mass properties containing shock absorber, leaf spring and air spring. Using the parameters used for SSF in the Table 1, it is calculated as 1.058 for the particular midi-bus examined in this work.
Vehicles are usually scaled based on a particular vehicle’s SSF by the NHTSA. Calculating the SSF is a very compact and meaningful way of indicating rollover risk in single-vehicle crashes. As shown in Fig. 1, the lowest-rated vehicles (1 star) are at least four times more likely to roll over than the highest-rated vehicles (5 stars) when involved in a single vehicle crash [7].
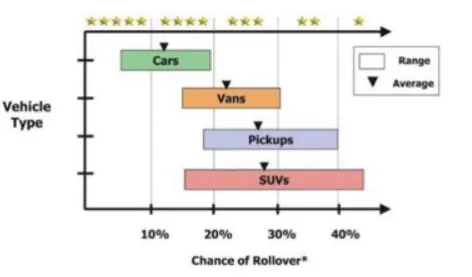
Fig. 1. SSF score of the vehicle
The possibility of rollover is expressed by the formula as seen in Eq. (2) by NHTSA

According to Eq. (2), the possibility of rollover of the midi bus is calculated in percentage as 40.32%. This number clearly shows that midi bus has a high probability of rollover.
One of the better known static rollover tests is the tilt table test. This test is used to measure the SSF, level of the lateral acceleration needed to roll over the vehicle and finally to estimate the static stability limit. In this study, the tilt table tests were used to compare the measured SSF with that of the simulation from the Adams/Car. This approach allowed a sound comparison between the actual tilt table tests and perform the sensitivity analyses.
Tilt table test was also performed in accordance with the SAE heavy vehicle tilt table testing recommended practice J2180. As it is recommended a minimum of three tilt tests were conducted. The tilt rate was set to be no greater than 0.25°/s and the tilt angle alignment at each axle group was not less than ±0.1° [8].
The relative rollover condition can be reached when tires on a single track of a vehicle lose the road contact. Although SSF has a strong correlation with vehicle rollover, the dynamic behavior of vehicle is not taken into account. The National Academy of Sciences recommended that dynamic maneuver tests can be used as a supplement rather than replacing Static Stability Factor [9]. Dynamic test series are very important and they represent different driving maneuvers and provide information based on real-world an operation in which rollover is inevitable.
For selecting the representative dynamic tests, previous studies and standards are examined. Amongst the standard testing maneuvers, the fishhook maneuver was the most repeatable of all rollover resistance maneuvers performed in the study [10]. Cornering represents a dangerous situation when a vehicle attempts to a turn a corner too quickly. Therefore, in this study, parametric sensitivity analysis was performed using fishhook and cornering maneuvers. This represents a worst-case scenario and sensitivity analysis reveals the limits of the fidelity of the model. There are also studies with computer simulations using mathematical models to predict vehicle behavior associated with rollover [11]. However, computer simulations are usually performed without model validation. In such cases, there is no guarantee that the virtual model would act like the actual vehicle. Therefore, to improve the fidelity, virtual model was verified using static and dynamic actual tests in this paper.
Actual tests take great amount of time and effort to set up and perform, and if there are vehicle parameters that need to be changed between tests, even more time is necessary. In contrast, changing vehicle and suspension characteristics are simple and efficient if a software simulation such as Adams/Car is used. Some of the advantages of simulating such tedious tests with software are the low-cost, driver safety, test repeatability and observation of vehicle parameters in a continuum.
VIRTUAL MODEL ON ADAMS PLATFORM:
Adams/Car software program was chosen to simulate static and dynamic tests because of the high level of computational ability as well as the detailed animation capability [12]. A midi bus with 7 m length has been modeled using Adams/Car software program in order to obtain virtual vehicle for further stability analyses.
When virtual vehicle is modeled, each sub-system is considered separately. The suspension system is modeled with rubber bushing, bump stop/ rebound stop elements, anti-roll bars, shock absorbers, leaf springs, air springs and connections to the axes and sprung mass [21]. Furthermore, parameters have been defined as the non-linear functions such as damping characteristics of the shock absorbers, spring stiffness, bump stop/rebound stop damping and translational/torsional stiffness of the bushings. After the nonlinear function definition, they are integrated into the Adams/Car simulation.
The nonlinear kinematics and compliances of the steering system were also integrated into the model. One of the most important features in a simulation is the tire model. The tire parameters involving Pacejka’s Magic Formula parameters were taken from the supplier of the tire [17], [23].
In the simulation, front suspension attachments points containing two leaf springs, shock absorbers and anti-roll bar are accurately represented. The standard front suspension models of the Adams/Car are shown in Fig. 2. In addition to the standard model, leaf spring properties which are taken from supplier are modeled as non-linear characteristics.
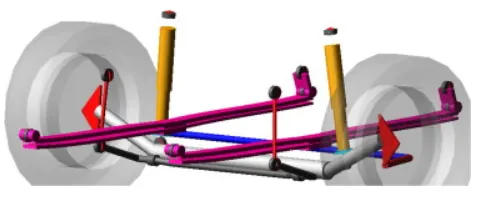
Fig. 2. Front suspension model of the Adams/Car.
Front shock absorber is modeled and its compliance/impedance characteristics are as shown in Fig. 3.
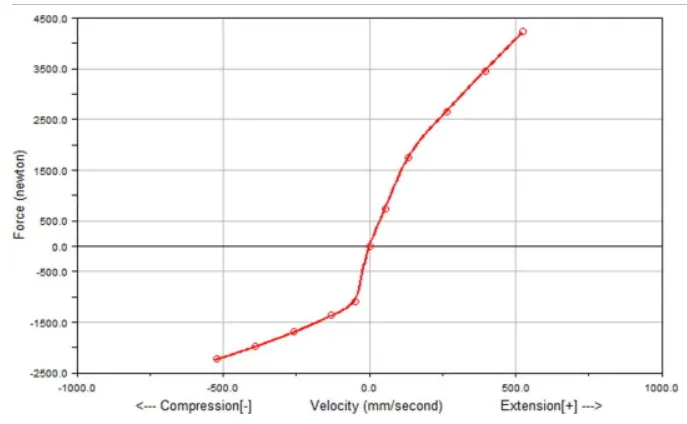
Fig. 3. Front shock absorber force – velocity curves.
Rear suspension model of the Adams/Car containing two air springs instead of leaf spring, shock absorbers, trailing arm and Panhard rod is shown in Fig. 4.
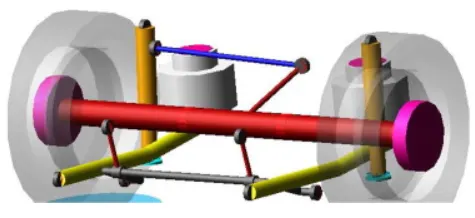
Fig. 4. Rear suspension model of the Adams/Car.
Panhard rod is located on the rear axle is treated as a lever with the intermediate support at the rear axis and it prevents movement of the rear axle from right to left.
Rear shock absorber is modeled and its compliance/impedance characteristics are as shown in Fig. 5.The steering system is one of the important sub-systems because it has significant impact on vehicle handling characteristics. It has been modeled using two gear housing. The first change is only in the direction of rotation from the steering and the other is to change the direction of translation rate as well. Gearbox conversion rate of the vehicle integrated into the Adams/Car model is taken as 21:1. Steering system models of the actual and virtual vehicle were compared as shown in Fig. 6.
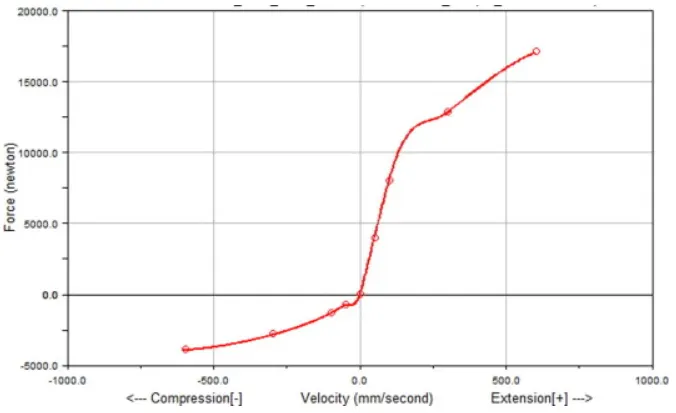
Fig. 5. Rear shock absorber force – velocity curves.
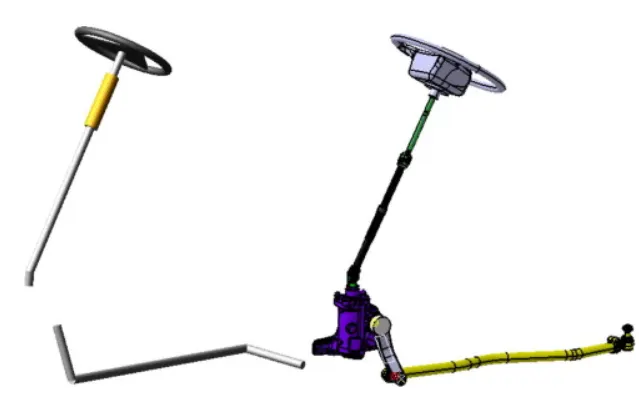
Fig. 6. Steering system models of the vehicle and Adams/Car.
Other sub-systems such as engine, brakes, anti-roll bar, chassis and body are also modeled in accordance with actual geometry and non-linear characteristics. Since they are not directly related to rollover-dynamics, they are not detailed herein.
The resulting multi-body system is connected by joints (translation and rotational motion), springs, dampers, and rubber bushings. These components are acted upon by external forces and moments or external control movements and can be described mathematically by a system of differential-algebraic equations (DAE). Full virtual vehicle model shown in Fig. 7 has 487 DoF.
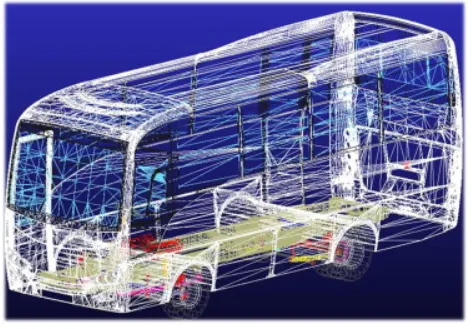
Fig. 7. Virtual vehicle model of the Adams/Car.
The inertial properties of the virtual vehicle such as the location of center-of-gravity and the inertias are provided to match the actual vehicle. In this way, variable parameters containing force, torque, displacement and acceleration can be integrated to one of the subsystem.
VERIFICATION OF THE MODEL:
This section will illustrate the various simulation tests that were performed to ensure that the model responses in an expected and predictable manner. Verification of the virtual model is essential in the development of analytical simulation models because virtual model is providing accurate results. Methodology of the verification of the Adams/Car model involves performing both static and dynamic cases. Furthermore, suspension and steering sub system models are validated prior to overall simulation. Therefore, the virtual model used in this work provides very accurate results.
1.) Verification of the virtual model as a static
Wheel travel analysis in Adams/Car can be used for comparing the suspension response with test data. Hard-point locations of tie-rod, Panhard rod, and trailing arm should be adjusted to produce similar results. Furthermore, a wheel-travel analysis allows us to look at how the characteristics of a suspension change throughout the vertical range of motion of the suspension. The location of hard points determines static values and change in wheel travel for these suspension parameters. Hard points are the most elementary building blocks in Adams/Car that define and parameterize all key locations in the model [13], [16].
The first step of the virtual model verification is to specify a shock absorber for the vehicle. The minimum and maximum wheel travels are important in order to define what size of shock absorbers are suitable. In this model, the lengths of an already installed parts were given by the manufacturer, which was 142 mm for the front spring/dampers and 161 mm for the rear spring/dampers.
Parallel wheel travel test were available in Adams/Car that allowed the research team to analyze the characteristics of a suspension change throughout the vertical range of motion. The damper/shock absorber lengths of the rear and front suspensions were analyzed under the simulation test of parallel wheel travel. Parallel wheel travel test rigs are shown for front and rear suspension in Fig. 8, Fig. 9.
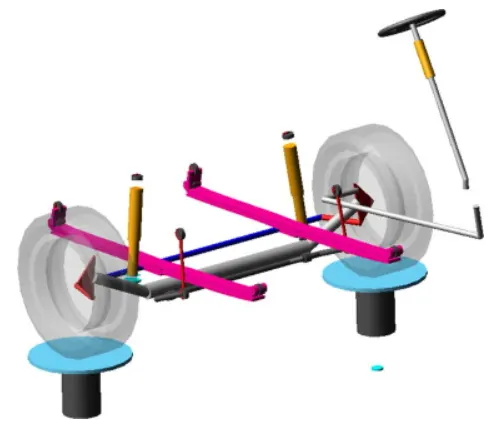
Fig. 8. Front suspension parallel wheel travel test rig.
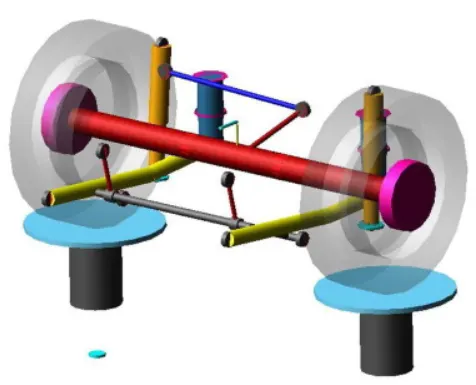
Fig. 9. Rear suspension parallel wheel travel test rig.
The rebound of a suspension is the maximum downward displacement at ride height, and likewise, the jounce (4th derivative of position) of a suspension is the maximum upward displacement. The upper limit of wheel-center displacement relative to the input position is 70 (mm) and the lower limit of wheel-center displacement relative to the input position is −90 as shown in Fig. 10. The horizontal scale (x axis) represents the response of the rebound and jounce values. The vertical scale (y axis) represents response of the damper length.
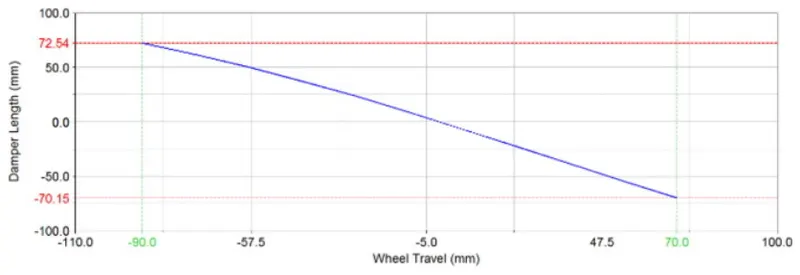 Fig. 10. Damper length of the front suspension.
It is shown that damper length is measured as +72.54 mm when vehicle is acting under jounce condition and is measured as −70.15 mm when vehicle is acting under rebound condition. Front axle damper length of the actual vehicle is restricted as 142 mm. Since the measured values and predicted values agree well, the model is validated and it gives accurate predictions.
The upper limit of wheel-center displacement relative to the input position is 90 (mm) and the lower limit of wheel-center displacement relative to the input position is -88 as shown in Fig. 11.
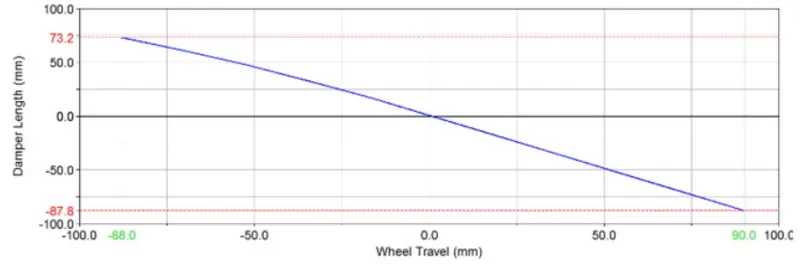
Fig. 11. Damper length of the rear suspension.
It is shown that damper length is measured as +73.20 mm when vehicle is acted under jounce condition and is measured as −87.80 mm when vehicle is acted under rebound condition. Rear axle damper length of the actual vehicle is restricted as 161 mm. the same accuracy level is obtained for the rear suspension model as it was previously obtained for the front suspension model.
As the results show, wheel travel and damper length parameters of the virtual model were validated by the data obtained from the parallel wheel travel test rig.
The front and the rear axle loads were measured at the stage of determining axle loads separately. The vehicle center of gravity “x and y” axes coordinates were identified by measuring of each wheel using load pads. Then, additional loads of each 2450 kg were attached above the seats to reach the gross vehicle weight.
Finally, gross weight of the vehicle was measured at each wheel again. In this way, the coordinates of the center of gravity provide very accurate results. These steps were performed in order to determine the axle loads of the actual vehicle and verify axle loads of the virtual vehicle model. Axle loads of the actual and virtual vehicle were compared based on curb and gross weight vehicle conditions as shown in Table 2.
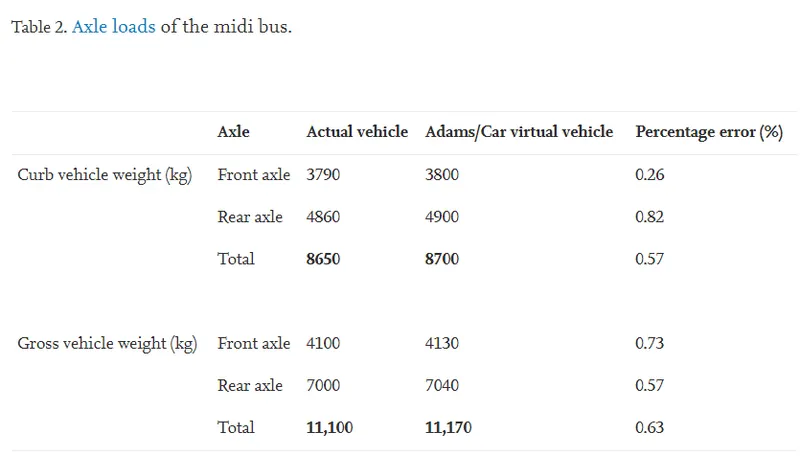
It is seen that from Table 2, the difference between the simulated and measured values are less than 1% for all axle loads; the simulation model is considered as well-correlated and valid to apply for static tests. Parametric sensitivity analysis and all verification tests are performed when vehicle is loaded with gross vehicle weight. If the loading condition is like this, rollover threshold of the vehicle diminishes. When cornering, lateral load transfer ratio is increased and lateral acceleration acting on the CoG forces the vehicle to roll over. Therefore, the vehicle loaded with gross vehicle weight can be recognized as the worst case.
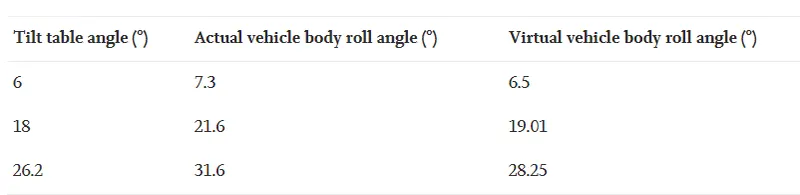
Tilt table test was performed with actual vehicle in order to measure the roll angle at the center of gravity corresponding to the tilt table angle in the last stage. Furthermore, the roll angle of the virtual model was measured in the same region as shown in Fig. 12.
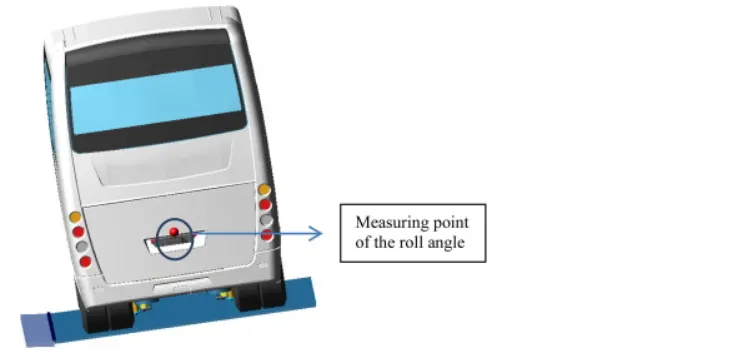
Fig. 12. Virtual model tilt table test rig.
While the tilt table test was performed, the front leaf spring had 20 (kg/mm) as stiffness value and the front anti-roll bar were selected to be Ø38. Body roll angles of the actual and virtual vehicle were compared as shown in Table 3.
2.) verification of the virtual model as a dynamics
The maneuver with passing over the speed bumper was performed to evaluate the actual and virtual vehicle responses in terms of vertical acceleration and displacement.
In this validation method, overall results such as accelerations and displacements were analyzed instead of a detailed examination of each parameter such as toe, camber caster and kingpin inclination angles. The purpose of compliance design was to correlate the virtual suspension compliance response with the test data. Stiffness of the leaf springs, air springs and damping of the shock absorbers in specific orientations were tuned to achieve reasonable correlation.
While actual vehicle was driven over the speed bumper, vertical accelerations and displacements were measured on the wheel hubs. Next, actual test results were compared with the results of virtual test results previously calculated. Accelerometers and displacement transducers were placed in the corresponding points on the actual test vehicle listed as follows:
- Four 3D accelerometers on wheel hubs.
- Four 3D accelerometers on rigid brackets on the chassis above wheel hubs.
- 3D accelerometer on COG of test vehicle.
- Four displacement transducers between wheel hubs and rigid brackets on the chassis.
After the instrumentation of the vehicle, two real rigid speed bumper models were made as shown in Fig. 13.

Fig. 13. Rigid speed bumper models.
The actual and virtual vehicle is driven over the speed bumper 3 times with a vehicle speed 20 km/h under the same conditions as shown in Fig. 14.
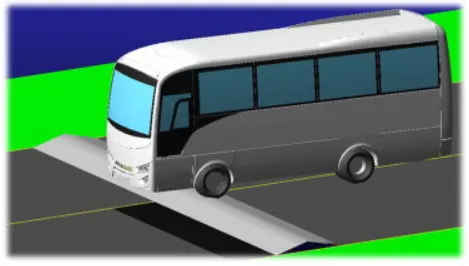
Fig. 14. Virtual model passed over the speed bump.
The suspension parameters of the simulation model are correlated using the actual test data. Vertical accelerations measured on the wheel hubs were compared as shown in Fig. 15.
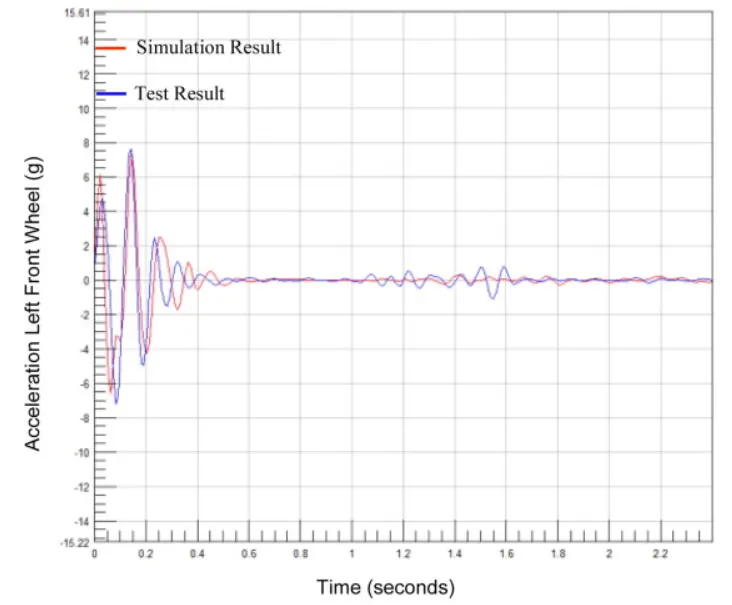
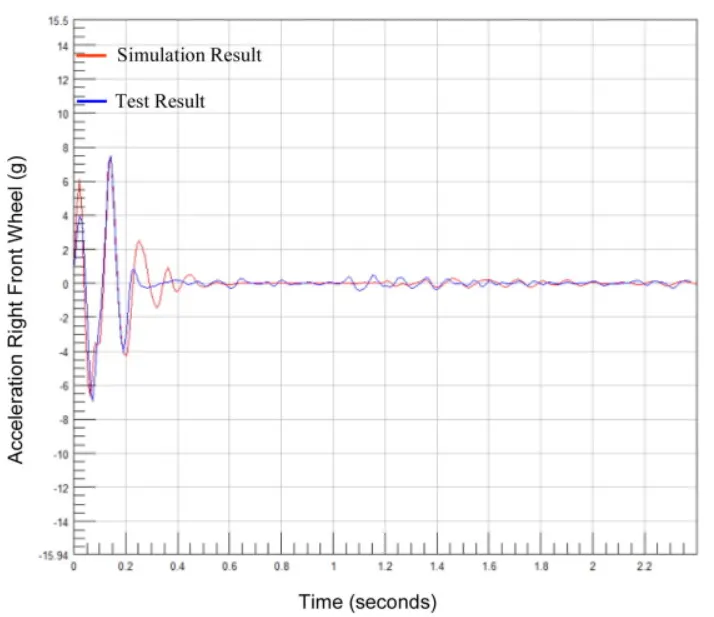
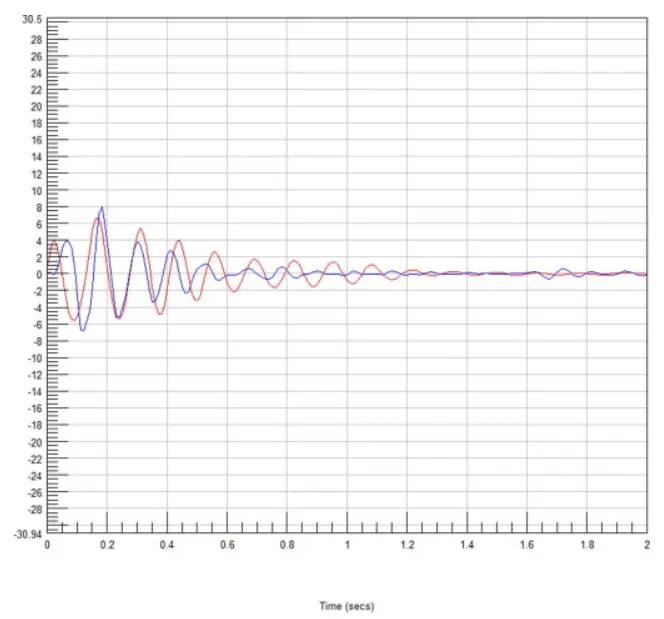
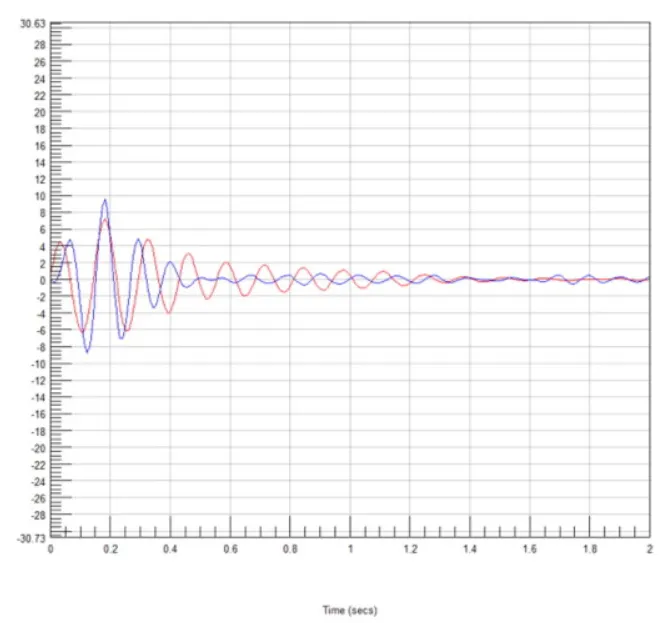
Fig. 15. Comparison of the vertical accelerations on virtual and actual bus.
Red line represents simulation results and blue line represents actual test results. It is observed that virtual model provide very accurate results when compared to the results of actual measurements. Simulation results shows 0.1% deviation from the actual test results in the best case and shows 1.1% deviation from the actual test results in the worst case.
Some of the significant parameters affecting the vehicle rollover threshold are lateral acceleration and roll rate. Therefore, these parameters of the virtual model should be verified. ISO lane change maneuver was performed in order to verify lateral acceleration and roll rate parameters. In this maneuver, the vehicle is driven at a speed of 40 km/h.
Two parameters were measured at the time of lane change. Bushings and rebound stop and bump stop parameters of the virtual model were tuned to achieve reasonable correlation. Roll rate measured on the wheel hubs were compared as shown in Fig. 16.
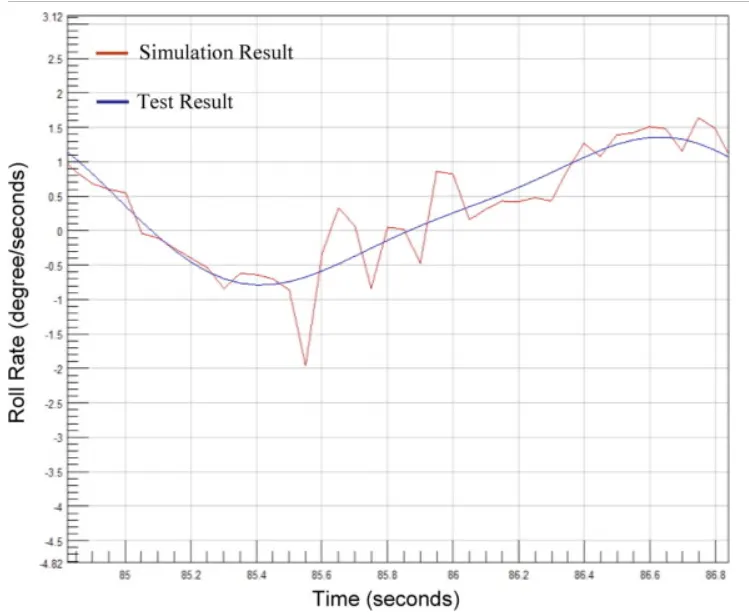
Fig. 16. Comparison of the roll rate on virtual and actual bus.
Lateral acceleration measured on the CoG were compared as shown in Fig. 17.
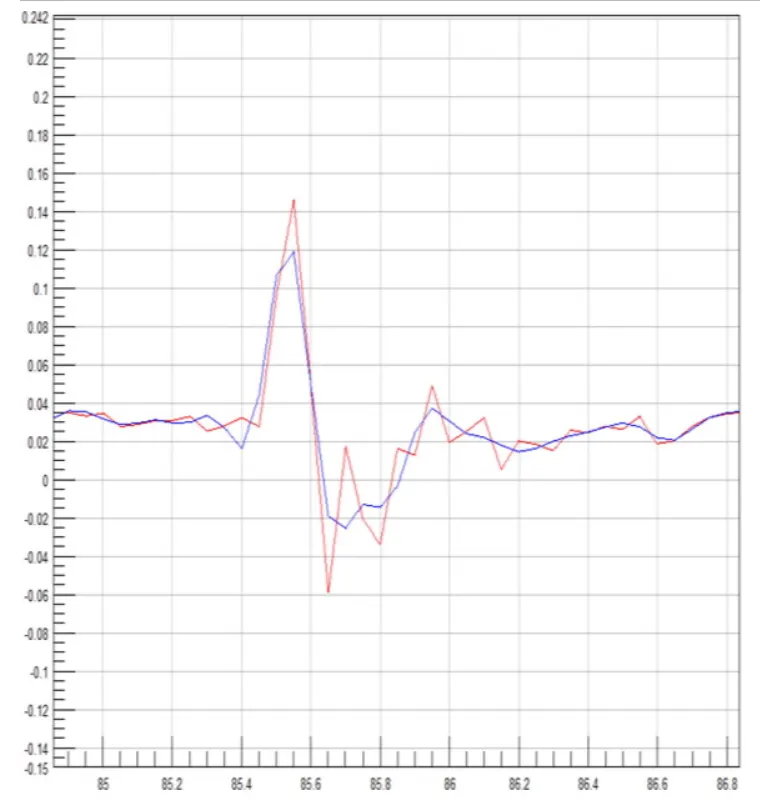
Fig. 17. Comparison of the accelerations on virtual and actual bus.
Red line represents actual test results and blue line represents simulation results. However, actual vehicle data were not passed through the filter. As a result of this, white noise increased throughout the data of the test, especially at the peak points. It is observed that virtual model behaves like an actual vehicle.
Multi body dynamic system analysis validated by the physical test is performed using Adams/Car software program using two different methods. One of these methods is based on static test simulation and the other is based on dynamic test simulation. Static test is chosen as tilt table test and dynamic test is selected as cornering and fishhook test maneuvers.
PARAMATRIC SENSITIVITY ANALYSIS BASED ON STATIC TEST:
Sensitivity analysis approach is applied to efficiently tune the stiffness of the anti-roll bar and leaf spring at each axle in order to maximize rollover threshold. Studies are shown that suspension roll stiffness and roll center height are the most effective parameters for determining rollover behavior of the vehicle and roll angle threshold can be reduced by 8.3749% if the rear suspension geometry is optimized [6].
The tilt table test provides a measure of the level of lateral acceleration needed to lift the inside wheels off the ground and overturn a vehicle. In this analysis, one of the goals is to increase the rollover threshold value using static tilt table test. When tested using the existing parts, it was observed that right rear tire initially lifted off the table during the tilt table test as shown in Fig. 18.
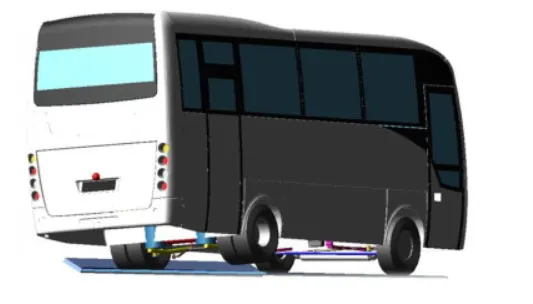
Fig. 18. Adams/Car tilt table test.
As it is seen that from Fig. 16, we can say that the roll stiffness of the rear suspension is higher than the front suspension because the point of roll instability of the rear suspension has not yet been reached. It was concluded, therefore, the front and rear roll stiffness should be balanced in order to have both wheels on the same side lift at the same time [9].To achieve the intended design feature, we have to increase the roll stiffness of the front suspension in order to increase static stability factor because there is a linear relation between these two parameters.
As described in the previous sections, suspension parameters including leaf spring and anti-roll bar actually affect the magnitude of the necessary lateral acceleration to produce rollover. Therefore, front leaf springs and front anti-roll bar were selected as design parameters. Three different diameters of the front anti-roll bar such as Ø38, Ø40 and Ø42 were selected as the first three set values of this parameter. If stiffness of the front anti-roll bar was more increased, this situation caused to increase in understeering. In a similar way, the front leaf spring is determined by the allowable bearing capacity of the front axle, ride height of the vehicle with the purpose of the ride comfort in mind as well. Therefore, the stiffness of the front leaf spring is limited to two different stiffness in the parametric sensitivity analysis such as 20 and 23 (kg/mm).
RESULTS OF THE SENSITIVITY ANALYSIS:
Front leaf springs and front anti-roll bar were changed one by one in each experiment, so the combinations gave totally six different simulations. Moreover, validated Adams/Car virtual model was used in the parametric sensitivity analysis.
Front leaf spring and front anti-roll bar were selected like shown below as initial condition.
- The front leaf spring is selected as 20 (kg/mm).
- The diameter of the front anti-roll bar is selected as Ø38.
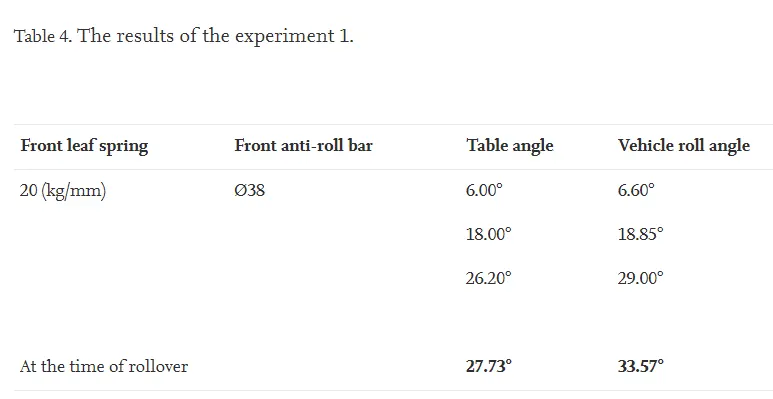
The roll angle of the vehicle is obtained as 33.57° shown in Table 4 when the vehicle rolls over. Front leaf spring and front anti-roll bar used in this test is currently existing parts located on the vehicle. Therefore, the roll angle of the vehicle measured in subsequent tests will be compared with the results of this test.
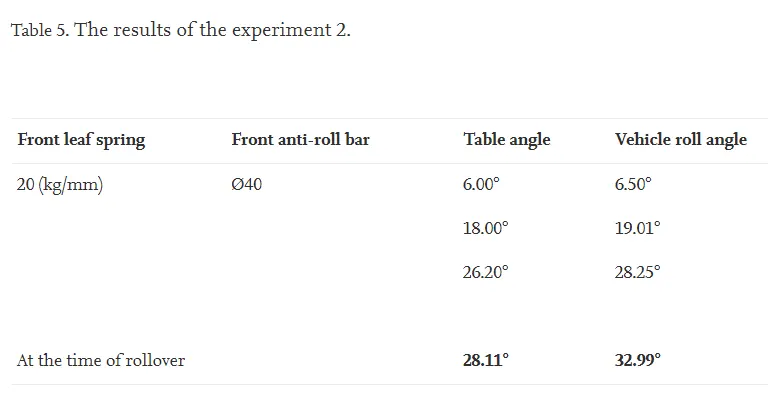
- The front leaf spring is selected as 20 (kg/mm).
- The diameter of the front anti-roll bar is selected as Ø40.
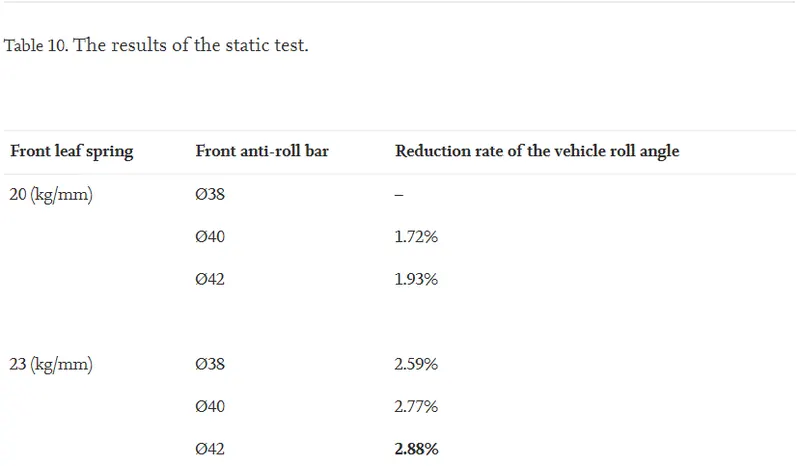
The roll angle of the vehicle is obtained as 32.99° shown in Table 5 when the vehicle rolls over. If it is compared with the results of the test-first test, table angle is increased while decreasing the vehicle roll angle by 1.72%.
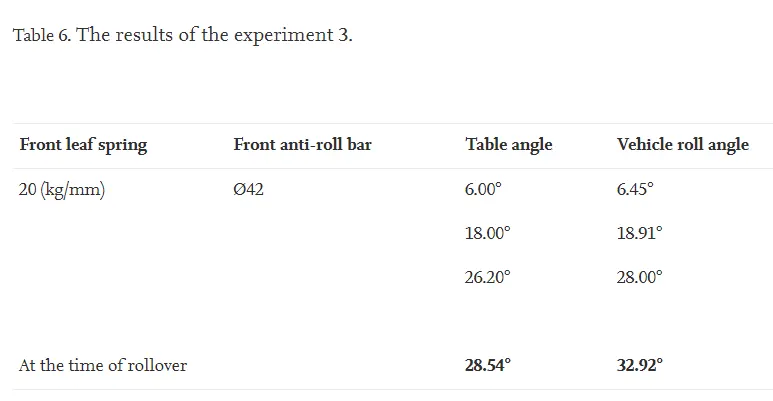
- The front leaf spring is selected as 20 (kg/mm).
- The diameter of the front anti-roll bar is selected as Ø42.
The roll angle of the vehicle is obtained as 32.92° shown in Table 6 when the vehicle rolls over. If it is compared with the results of the test-first test, table angle is increased while decreasing the vehicle roll angle by 1.93%.
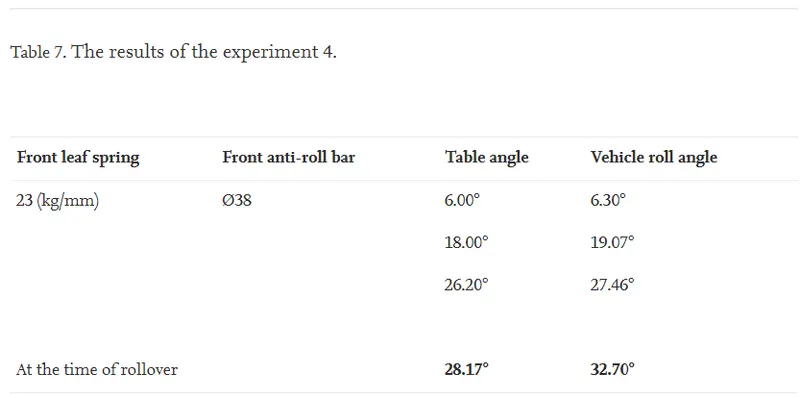
- The front leaf spring is selected as 23 (kg/mm)
- The diameter of the front anti-roll bar is selected as Ø38
The roll angle of the vehicle is obtained as 32.70° shown in Table 7 when the vehicle rolls over. If it is compared with the results of the test-first test, table angle is increased while decreasing the vehicle roll angle by 2.59%.
- The front leaf spring is selected as 23 (kg/mm).
- The diameter of the front anti-roll bar is selected as Ø38.
The roll angle of the vehicle is obtained as 32.64° shown in Table 8 when the vehicle rolls over. If it is compared with the results of the test-first test, table angle is increased while decreasing the vehicle roll angle by 2.77%.
- The front leaf spring is selected as 23 (kg/mm).
- The diameter of the front anti-roll bar is selected as Ø42.
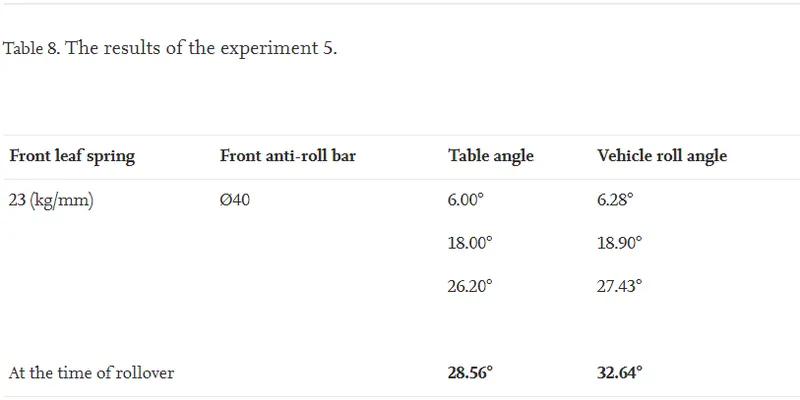 Table angle represents the rollover threshold. Therefore, increasing of the table angle means a certain amount of increase of the vehicle rollover threshold. In another sense, it means the vehicle will be rollover within later time. During this time, the roll angle of the vehicle decreases because, vehicle acts more stiff through tuned suspension roll stiffness. The roll angle of the vehicle is obtained as 32.60° shown in Table 9 when the vehicle rolls over. If it is compared with the results of the test-first test, table angle is increased while decreasing the vehicle roll angle by 2.88%.
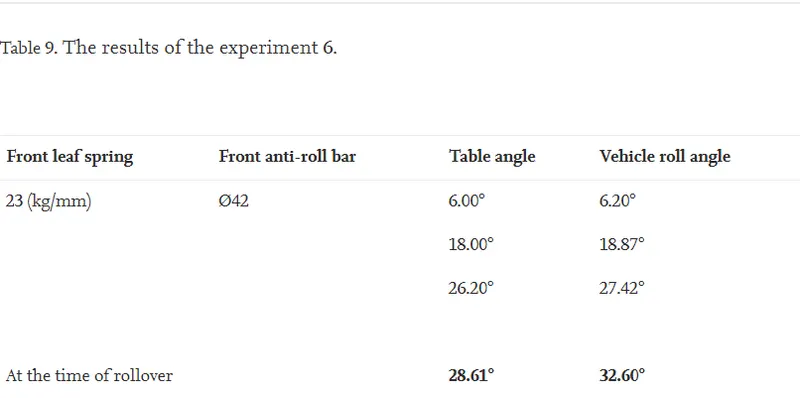
The technical approach, from a suspension aspect, is to improve stability by increasing the roll stiffness of the suspension system in both static and dynamic response. Therefore, the vehicle rollover threshold can be increased maximum as 2.88% from their nominal value as shown in Table 10 using static tilt table test.
Since static tests ignores the effects of tires and suspensions, a better model would include the possibility of the sprung mass because SSF ratings do not take the dynamic behavior of vehicles into account. If all parameters are grouped as a percentage of their own, efficiency percentages of the variable parameters are shown in percentage as seen in Fig. 19.
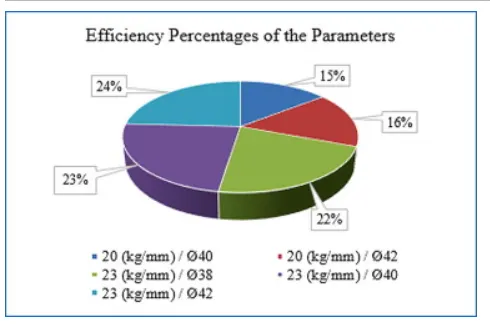
Fig. 19. Weight ratio of the parameters for Static Test.
It illustrates that the largest efficiency percentage is calculated as 24% If the stiffness of the front leaf spring is selected as 23 (kg/mm) and the diameter of the front anti-roll bar is selected as Ø42. Furthermore, it is observed that percentage distribution of each parameters is homogeneous. Therefore, the effect of parameter changes cannot be clearly seen.
PARAMETRIC SENSETIVITY ANALYSIS BASED ON DYNAMIC TEST
The objective of this stage is to investigate the rollover threshold as function of anti-roll bar and leaf spring stiffness. Dynamic test series represents a different set of driving maneuvers and provides information based on real-world operations in which rollover is inevitable. Some of these maneuvers such as the fishhook and cornering used in this work are described here.
1.) cornering maneuver
Cornering is a dynamic test series that simulates a common vehicle maneuver. During cornering, weight is shifted to the outside wheels. As this happens, the center of gravity of the vehicle also moves toward the outside. As the sprung mass begins to roll due to cornering, and the CoG beings to shift, the moment arm from the point of contact between the road and outside wheel and the CoG begins to shorten. This effect tends to increase the vehicle’s rollover propensity [11]. In this maneuver, the vehicle is driven at a speed of 40 km per hour in a straight line then entered a 150 meter radius of the corner.
Fig. 20 illustrates the stiffness values as function of the roll angle from simulation iterations of the sensitivity analyses. In other words, rollover threshold can be decreased with increasing suspension roll stiffness.
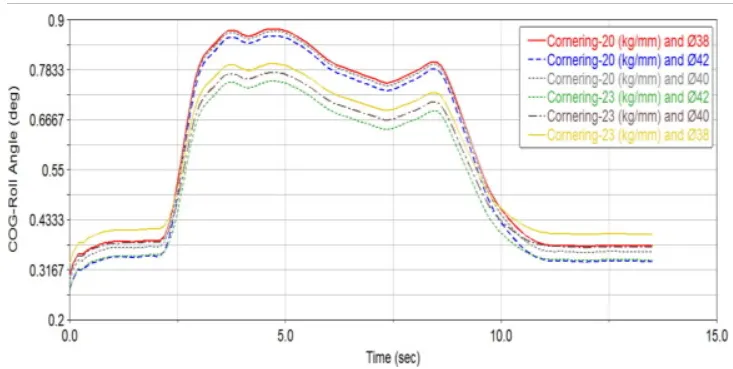
Fig. 20. The roll angles when cornering maneuver.
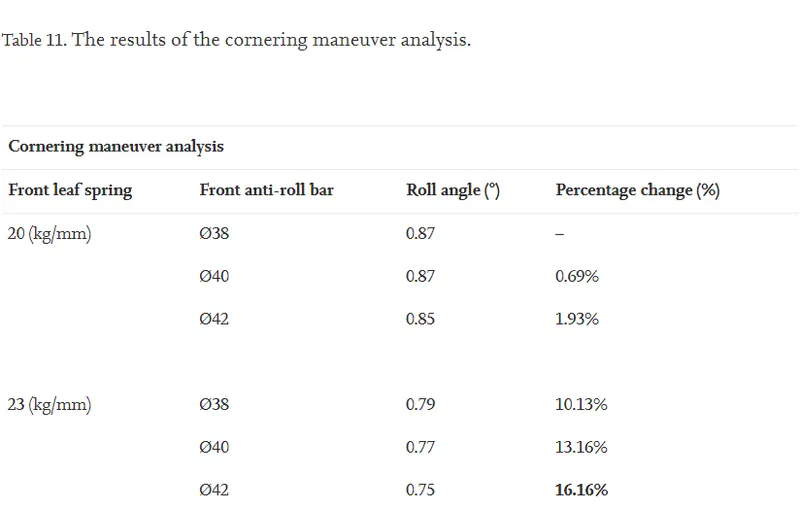
In contrast to effects of parameters that are found using static test, we can see that parameters have more influence in the dynamic test as shown in Table 11.
The vehicle rollover threshold can be reduced by 16.163% at maximum compared to the nominal value by increasing the roll stiffness of the suspension system. Moreover, it is observed that only changing the diameter of the front anti-roll bar is not sufficient to reduce rollover threshold because rollover threshold can be reduced at maximum by 1.931% from their nominal value by this method. As described in the previous sections, the use of the stiffer anti-roll bar in front suspension increase the necessary steering wheel angle as shown in Fig. 21.
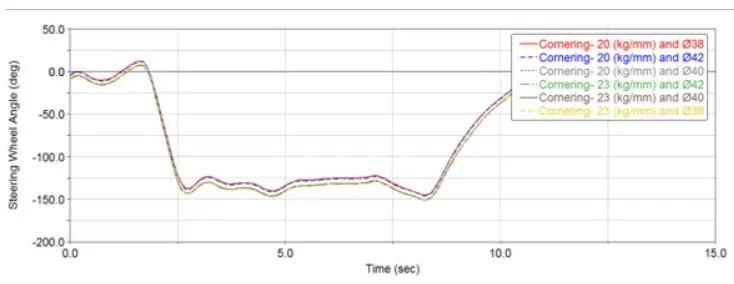
Fig. 21. The steering wheel angles when cornering maneuver.
The front anti-roll bar stiffness is limited to three different diameters because understeering characteristics must not reach a predetermined boundary conditions. If a vehicle has understeer, the front wheels have a greater steer angle than the rear wheels. Understeer effects require the driver to turn the wheel more than the amount which would be required in the neutral steer case. Fig. 22 shows the comparison of steer angle versus lateral acceleration.
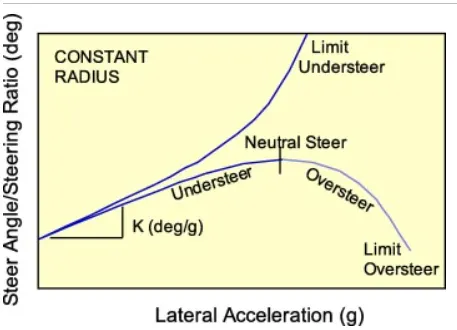
Fig. 22. Steer angle versus lateral acceleration [10].
From the Fig. 22, the plots comparing the characteristics for steering wheel angle divided by lateral acceleration show an understeer gradient (K). Virtual model is run using sweep steering test in order to determine understeer gradient of the vehicle. Understeer gradient of the developed vehicle must not be different from the current vehicle. Understeer gradient of the developed vehicle were compared with the results of current vehicle as shown in Fig. 23.
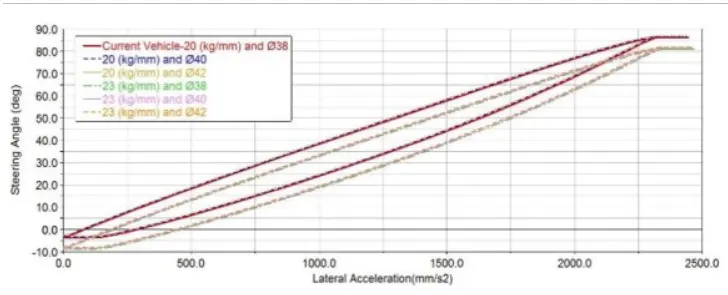
Fig. 23. Understeer gradient of the developed vehicle.
When the understeering characteristics of the vehicle were investigated, front leaf spring stiffness used 23 (kg/mm) decrease the understeer gradient. It is outside of specified limits if used 23 (kg/mm). On the other hand, the understeer gradient varies very little if front anti roll bar stiffness was increased.
RESULTS OF THE PARAMETRIC SENSITIVITY ANALYSIS
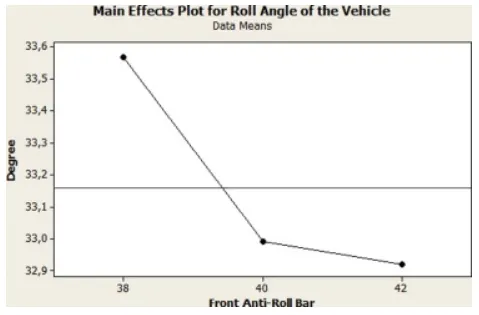
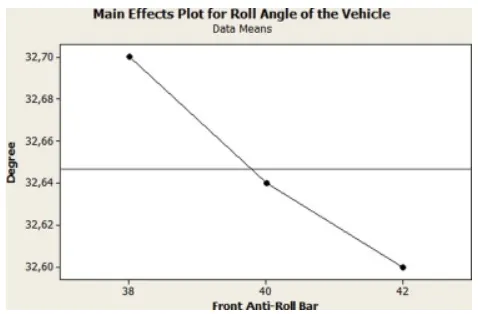
From this observation, we can conclude that if the front leaf spring is selected as 20 or 23 (kg/mm) and front anti-roll bar diameters are increased on the x axis, roll angle of the vehicle decreases. However, increase in roll angle is small when switching from Ø40 to Ø42 in diameter.
It is seen that from Fig. 27, Fig. 28, front anti-roll bar has the largest positive effect on the roll angle of the vehicle. Interaction effects herein represent the combined effects of factors on the dependent measure. Interaction may arise when considering the relationship between each of the factors in pairs. Therefore, interactions that can occur are two-factor experiment that can be analyzed using Analysis of Variance (ANOVA).
Interaction between the front leaf spring and front anti-roll bar illustrates the front anti-roll bar impact on the front leaf spring shown as in Fig. 29. Legend of plot displays the levels of front leaf spring stiffness in units of (kg/mm). The horizontal scale (X axis) shows the levels of the front anti-roll bar diameter in (mm). The vertical scale (Y axis) shows the levels of the roll angle in (°).
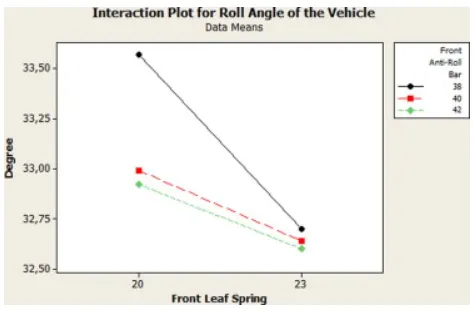
Fig. 29. Interaction between front anti roll bars and leaf springs.
Black, red and green lines with considerably different slopes indicate an interaction between the two factors. As seen from the results in Fig. 29, where roll angle of the vehicle is reduced, the diameters of the front anti-roll bars and stiffness of the leaf springs were increased. On the other hand if the front leaf spring is selected with stiffness value of 23 (kg/mm) and the front anti-roll bar is selected as Ø42 in diameter, roll angle of the vehicle is obtained as 32.60° to match the result yielded in simulation 6.
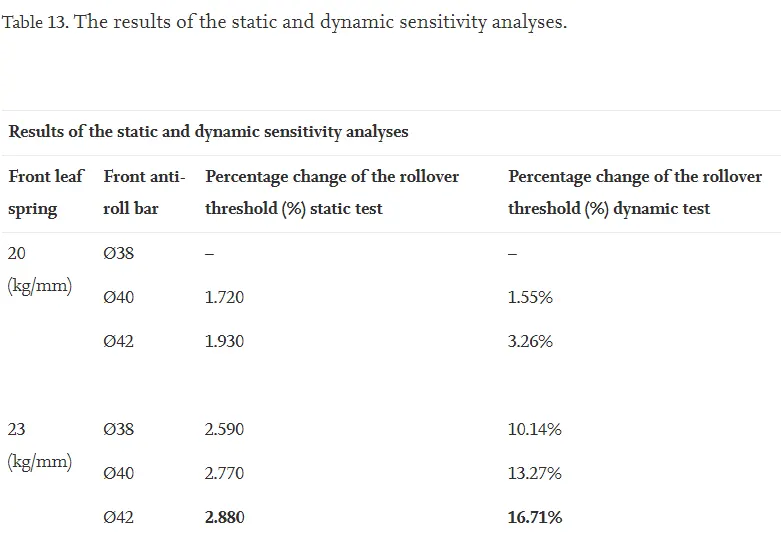
Static test results were compared with the dynamic test results as shown in Table 13. If one wants to improve vehicle stability significantly, it may not be effective enough to only change the anti-roll bar stiffness. Other factors may need to be accounted for, such as the leaf spring stiffness. Static test result is not sufficient in order to observe the effect of the parameters because threshold of the vehicle rollover can be reduced by 2.88% at maximum from their nominal value.
CONCLUSION:
This paper discusses the benefits of midi bus simulation for stability tuning at product development and demonstrates that it can greatly inform the designer. Virtual simulation can guide the designers to reach optimum suspension parameters for the vehicle.
Using the parameters in the Table 1, SSF of the vehicle is calculated as 1.058. The possibility of rollover of the midi bus is calculated as 40.32%. It is indicated that midi bus has a high probability of rollover. In order to decrease the propensity of the rollover for the vehicle, soft suspension (front suspension) was optimized using vehicle parameters in order to reduce the risk of rollover. Furthermore, the effect of improved parameters were investigated using both static and dynamic tests. The analysis shows that it is possible to maximize rollover threshold and increase vehicle stability by tuning suspension parameters so much so that rollover threshold can be increased by 16.71% at maximum from the nominal value using three different diameters of the front anti-roll bar and two different stiffness of the front leaf spring.
Front leaf spring stiffness used 23 (kg/mm) decrease the understeer gradient as shown in Fig. 23. It will be outside of predetermined boundary conditions, if used 23 (kg/mm). On the other hand, the understeer gradient varies very little if front anti roll bar stiffness was increased. The use of the optimum spring stiffness found in the analysis is not appropriate since it is not a standard value. Therefore, rollover threshold can be only increased as 3.26%. In addition to the results presented in this work, the following conclusions can be reached;
- When validating a virtual vehicle dynamics model using Adams/car software, virtual model can provide very accurate results when compared to the results of actual measurements.
- After validating the vehicle dynamics model, it can be applied to enhance the vehicle static stability factor (SSF) in a more accurate manner.
- The vehicle SSF is not sensitive enough for stability enhancement because SSF is restricted by static tests such as tilt table test used in this study. However, dynamic tests such as fishhook and cornering maneuvers are suitable for stability enhancement.
- Vehicle rollover threshold can be improved through tuned soft suspension and increased stiffness of the anti-roll bar and leaf spring.