Gate Valve Parametric Study
INTRODUCTION
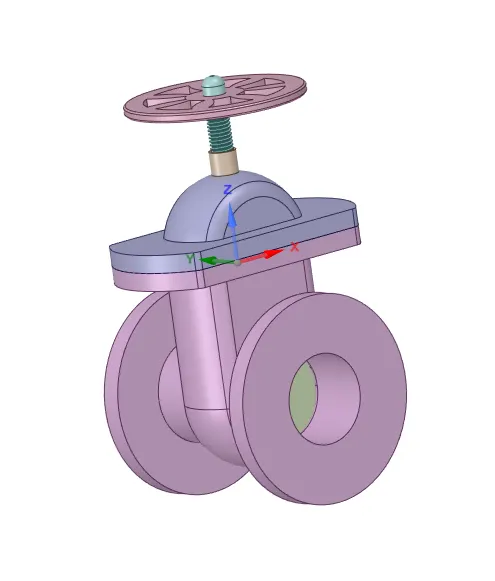
Valves are one of the most important and commonly used control devices in the industry. It is very important to know the flow characteristics inside a valve. The recent advancement in computational techniques paved the way for simulating complex flow problems. The flow through a valve can be easily simulated using fluid flow simulation packages such as ANSYS FLUENT and the performance can be easily accessed. Different types of valves can be easily designed using the available CAD packages and the performance of such designs can be analyzed using any CFD tool to create better products. Computational techniques can be used to complement the experimental techniques in studying the performance of valves since the flow visualization using experimental techniques is very difficult in complex flow passages such as that inside a gate valve.
In this paper, we are simulating 3D flow through a gate valve for different lifts of the gate disc. The mass flow rate through the gate valve is calculated for different lifts. The flow coefficient and flow factor are also calculated for each opening.
The objective of this study is to familiarize me with the parametric methods of simulation in ANSYS FLUENT. The input parameters and the output parameters were defined. The design point is set as the lift of the gate disc and by changing the design point the simulation is carried out.
OBJECTIVE
The objective of carrying out this study is to:
- Obtain the mass flow rates at the outlet for each design point.
- Calculate the flow coefficient and flow factor for each opening and plot the graph.
- Discuss the results of the mass flow rate and flow coefficient.
- To carry out a parametric study by creating input and output parameters.
THEORY
The steady flow of a Newtonian fluid is assumed, the solution of the Navier-Stokes equation and the continuity equation is solved using the commercial CFD solver ANSYS FLUENT. The equations are shown below:
\begin{equation}
\frac{\partial u}{\partial x}+\frac{\partial v}{\partial y}+\frac{\partial w}{\partial z}=0
\end{equation}
\begin{equation}
\rho\left(\frac{\partial V}{\partial t}+(v \cdot \nabla)_{V}\right)=-\rho g \nabla h-\nabla p+\nabla \tau^{*}
\end{equation}
where `V =ui +vj+wk` and `\nabla \tau^{*}`stands for the divergence of the stress tensor. The turbulence is modelled using using the realisable `k-\epsilon` model.
The flow is simulated to visualize the flow structure inside the gate valve for different valve opening and also to calculate the flow coefficient and the flow factor. The flow coefficient(`C_v`) is also known as the valve flow coefficient. It is an imperial measurement and is defined as the flow of water through a valve at 60°F in US gallons per minute (GPM) at a pressure drop of 1 lb/in².
\begin{equation}
C_v = Q\times \sqrt{\frac{SG}{\Delta P}}
\end{equation}
where `SG` is the specific gravity `Q` is the discharge in US GPM and `\Delta P` is the pressure drop in psi.
The flow factor (`K_v`) is the metric equivalent of the flow coefficient. It is defined as the flow of water in cubic meters per hour (m³/hr) at a pressure drop of the bar.
\begin{equation}
K_v = Q\times \sqrt{\frac{SG}{\Delta P}}
\end{equation}
where `SG` is the specific gravity, `Q` is the discharge in `m^3/(hr)`and `\Delta P` is the pressure drop in bar.
The relationship between `C_v` and `K_v` is `C_v = 1.156K_v`
GEOMETRY AND MESH
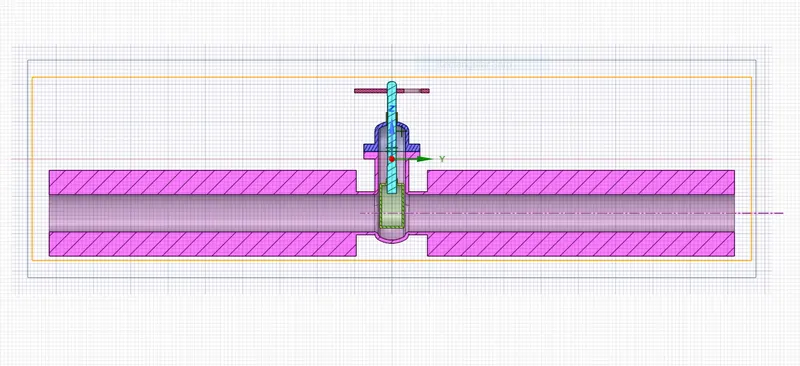
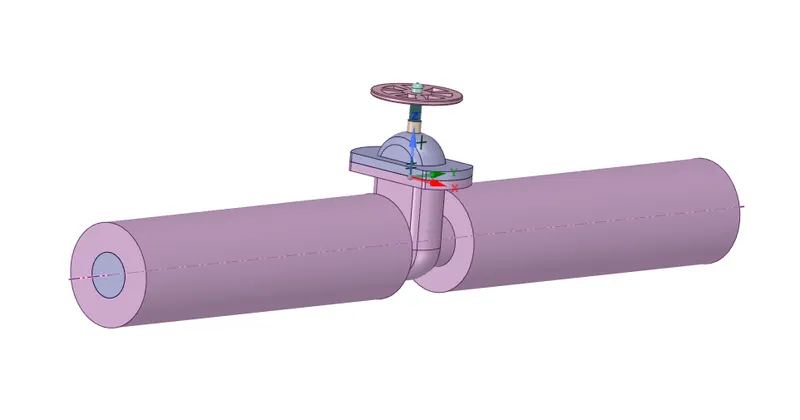
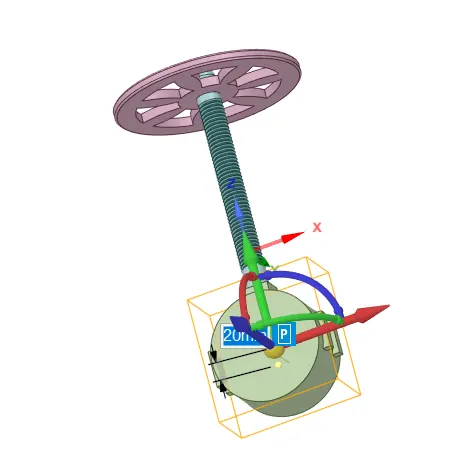
The geometry of the valve and pipe assembly is shown below, the cut section of the assembly for the lift of the gate disc for 20 mm and the valve and the pipe assembly is shown.
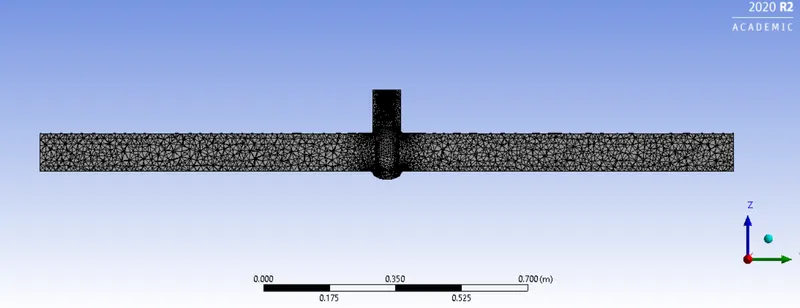
The mesh for a 10 mm lift is shown below:
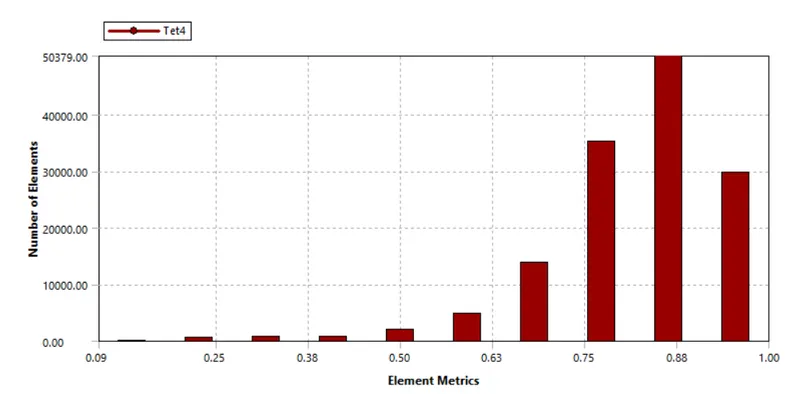
The mesh metric for the above mesh is given below:
SOLUTION OF THE PROBLEM
The problem needs to be solved for 10-80% of the valve opening. The inner diameter of the pipe is 100 mm. So 10% valve opening implies a 10 mm lift of the gate disc. Similarly, 80% opening of the gate valve implies 80 mm lift of the gate disc. The simulation is run for an increment of 10 mm lift till 80 mm. The lift of the gate disc is parameterized by adding a group in the SpaceClaim using the parameter option.
The realizable `k-\epsilon` turbulence model is employed to calculate the turbulence with scalable wall functions. The fluid used is the water in the liquid state.
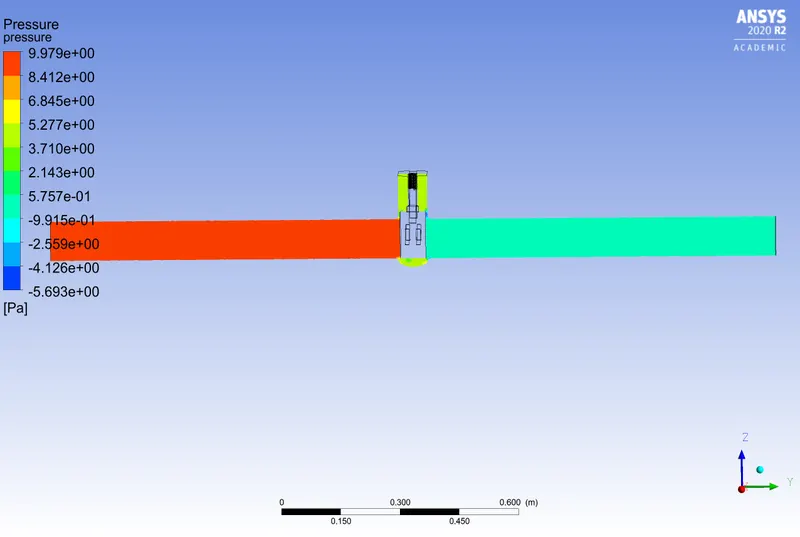
The boundary conditions were pressure inlet and pressure outlet. The pressure inlet is set as 10 Pa gauge and 0 Pa gauge at the outlet.
RESULTS AND DISCUSSION
The parameter window is shown below:
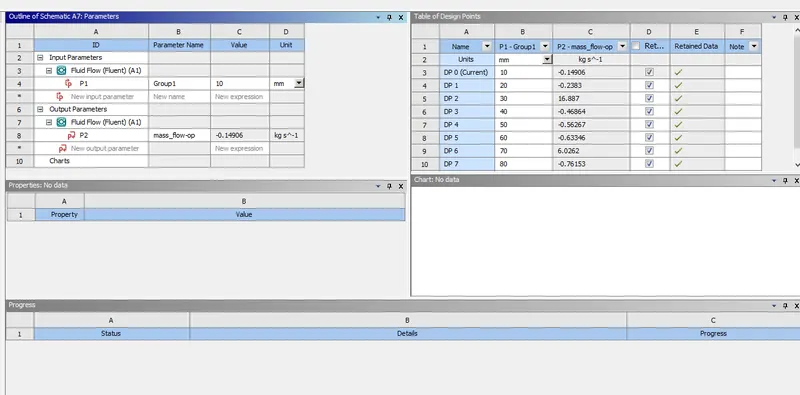
It can be seen that the DP2 and DP6 show anomalous values for discharge. It is some bug in the Ansys Workbench. All the other cases are used for the calculation. The velocity, pressure contours, and the streamline plots for different values of the lift of the gate valve is shown below:
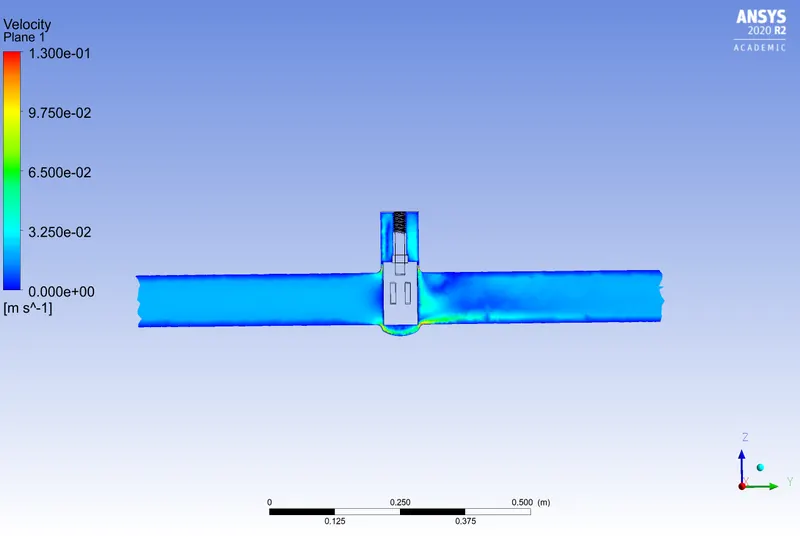
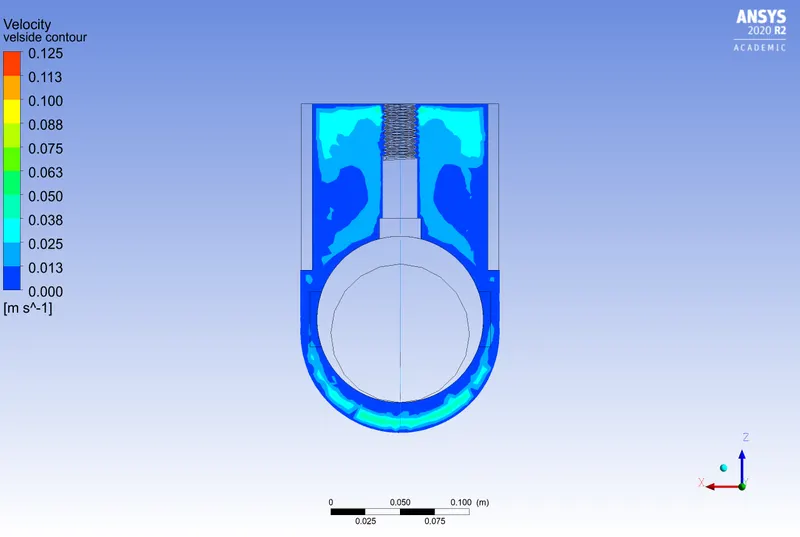
For a 10 mm lift the velocity contours are shown below:
The streamline plot is also shown below:
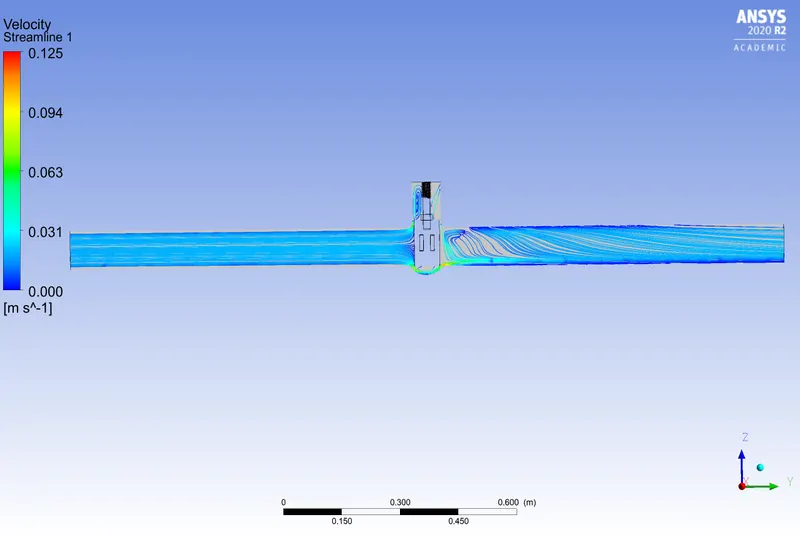
From the velocity contours and the streamline plot, it can be seen that the velocity of flow is very low through the pipe and hence the flow is less.
The pressure contour is shown as below:
The velocity contour for 20 mm lift of the gate disc is shown below:
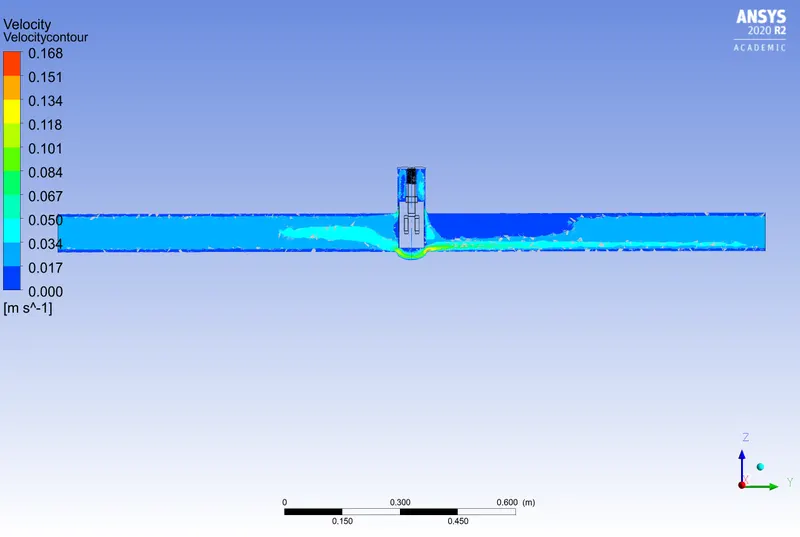
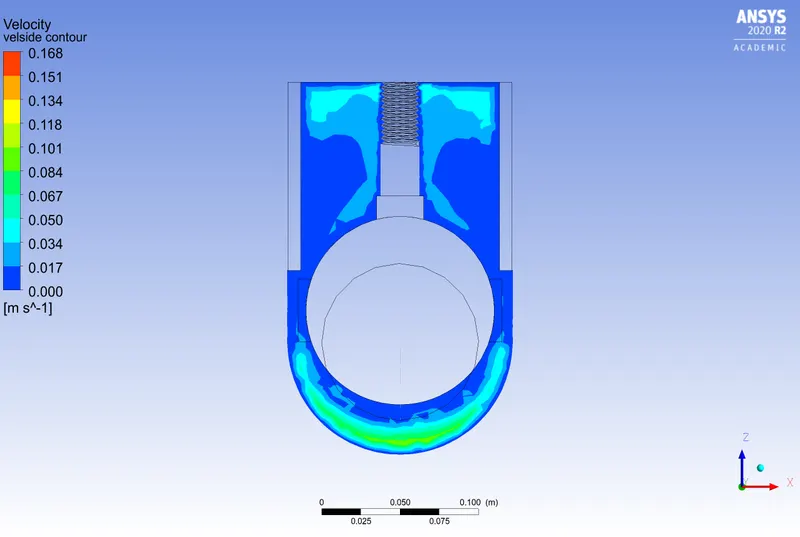
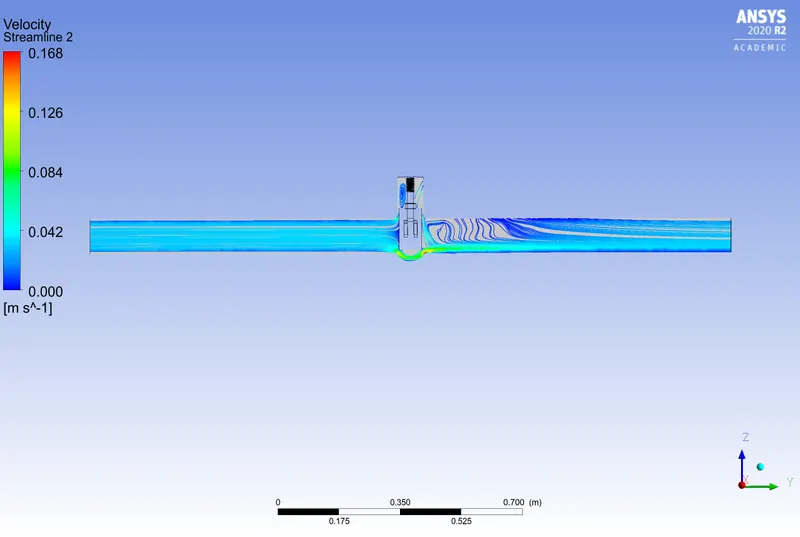
The velocity profiles and the streamline for a 20 mm lift also show that the flow velocity is less and therefore the flow rate will also be small. The pressure contour for the same case is shown below:
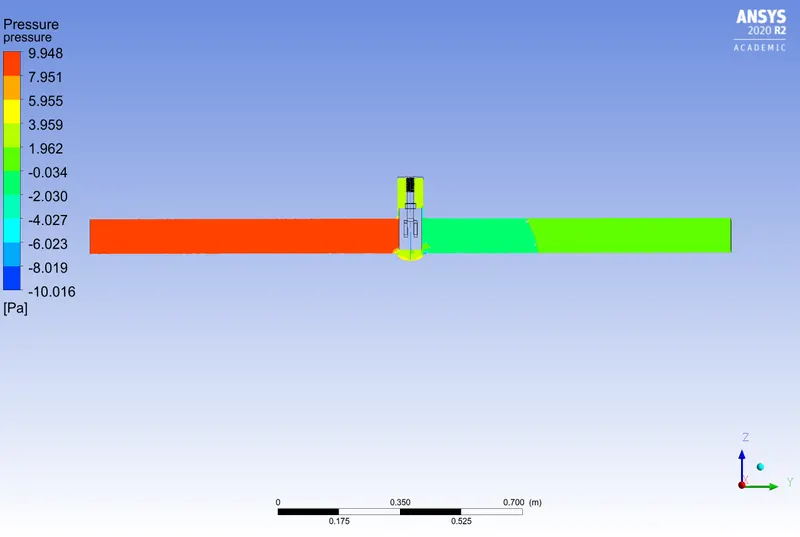
The 30 mm lift of the gate disc case results were an anomaly due to some bugs in the software package used. The case of the 40 mm lift is shown below, the velocity contours and the pressure contours.
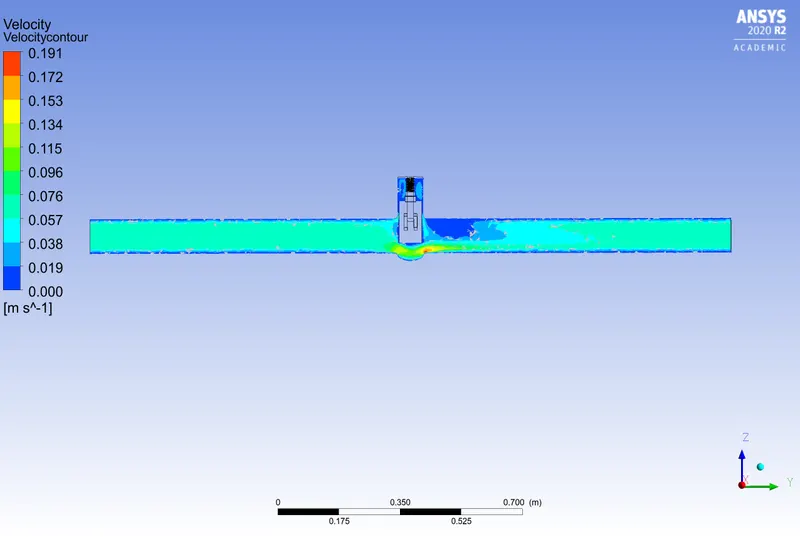
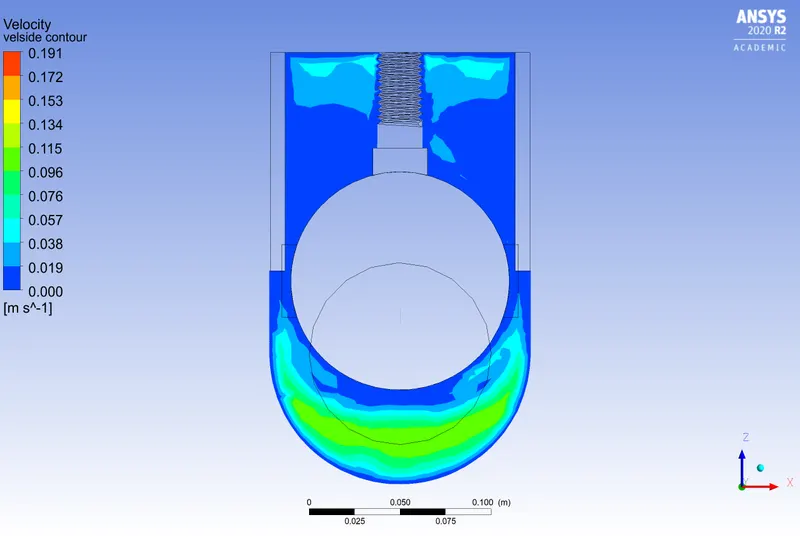
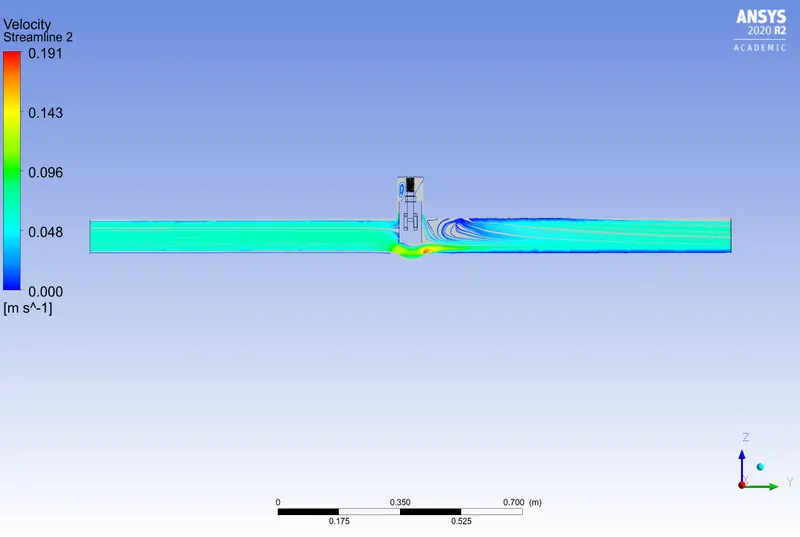
It can be observed that as the lift is increasing the velocity of flow through the pipe is increasing. The pressure contour is also shown below:
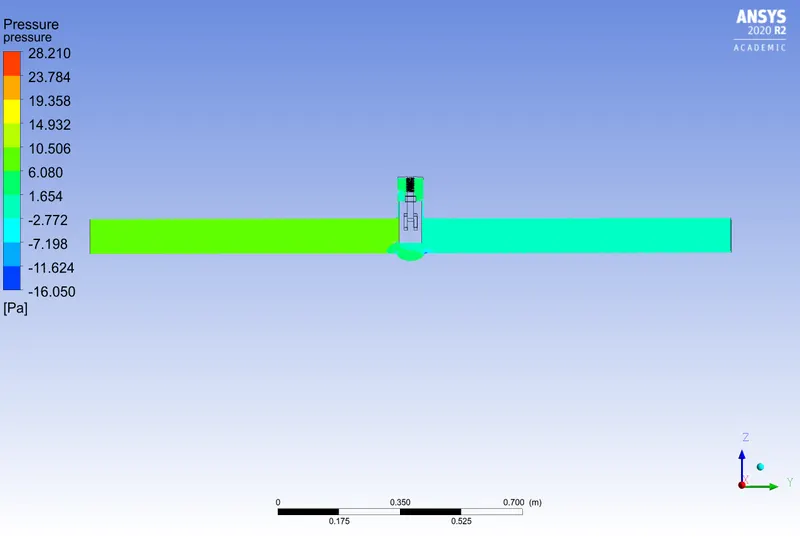
The contours of velocity and the streamline plot for 50 mm lift is shown below:
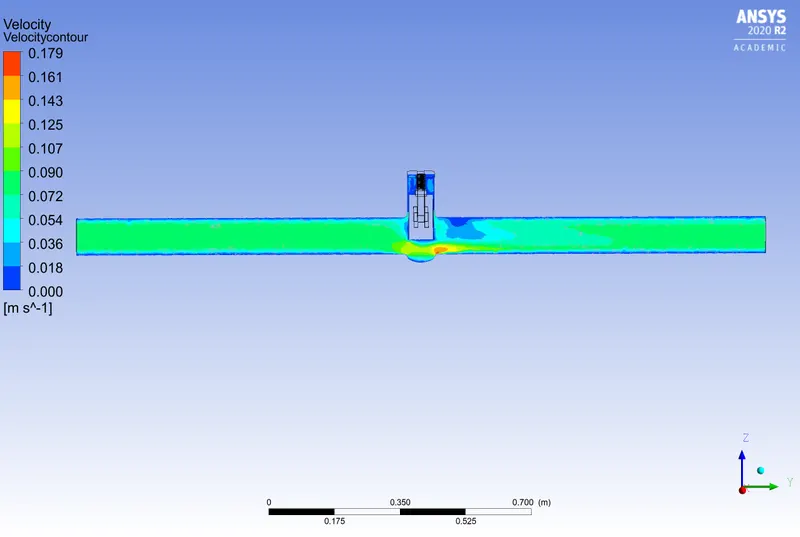
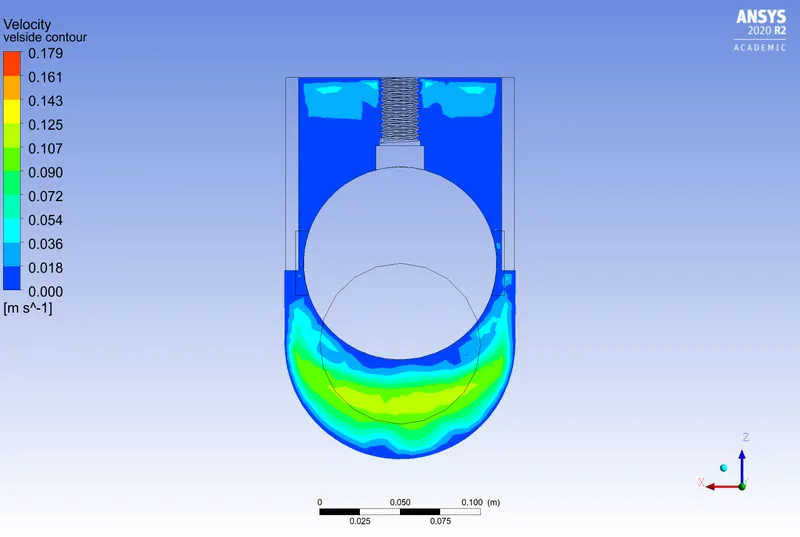
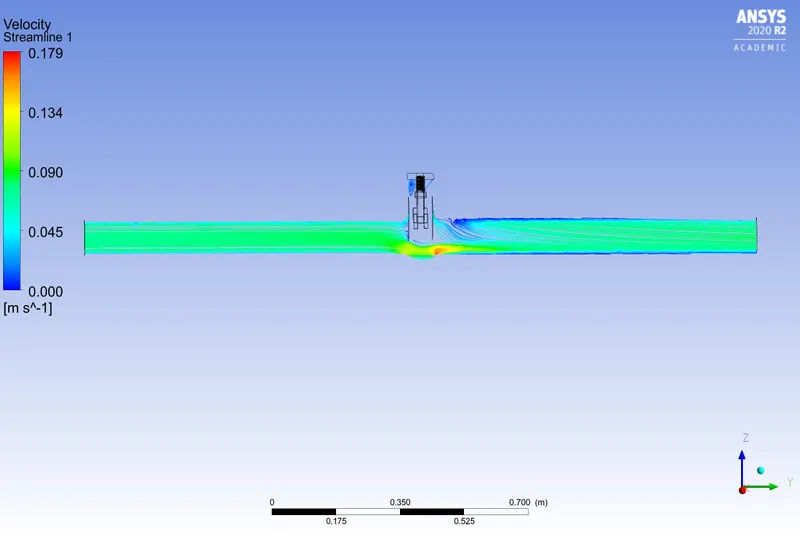
The pressure contour for the above case is shown below:
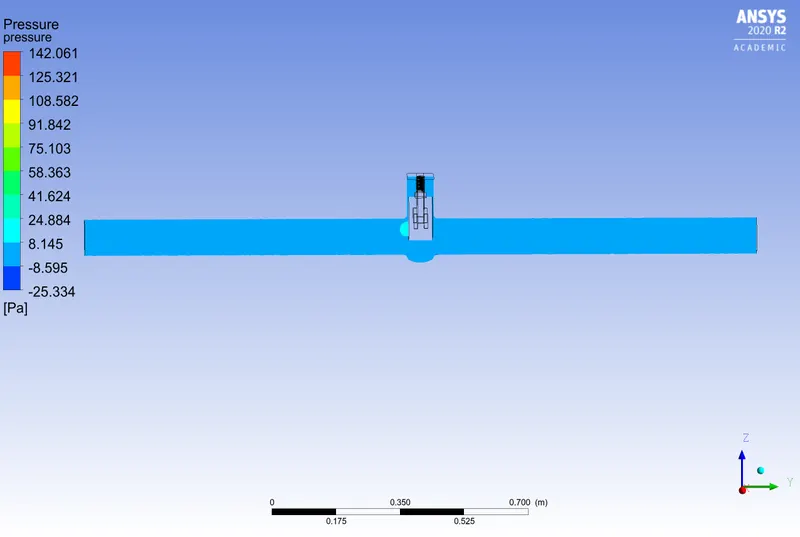
The velocity, pressure contours, and the streamline plots for a lift of 60 mm is also shown below:
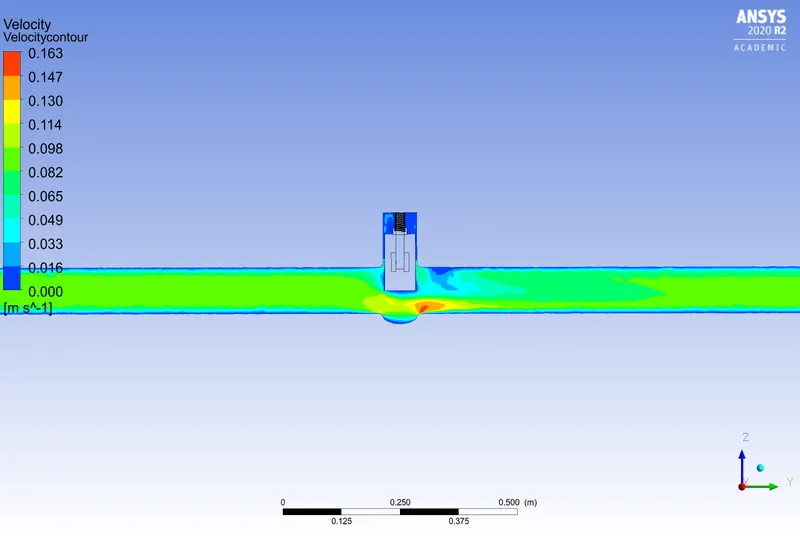
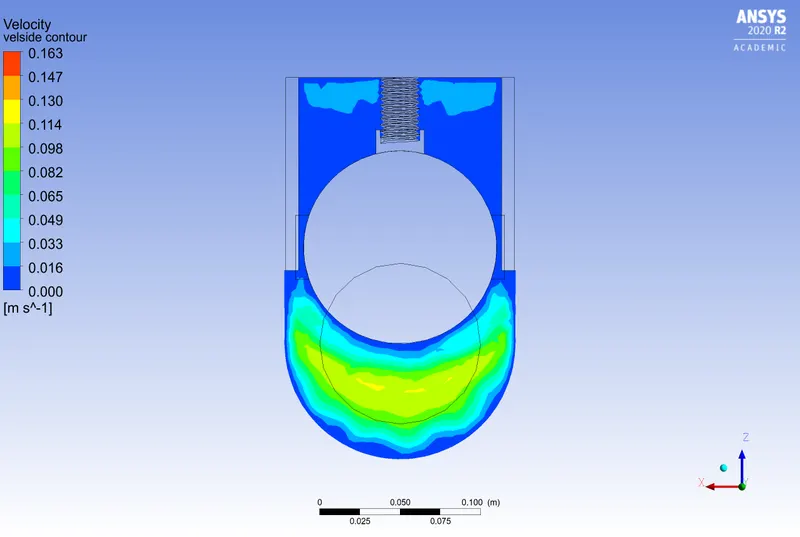
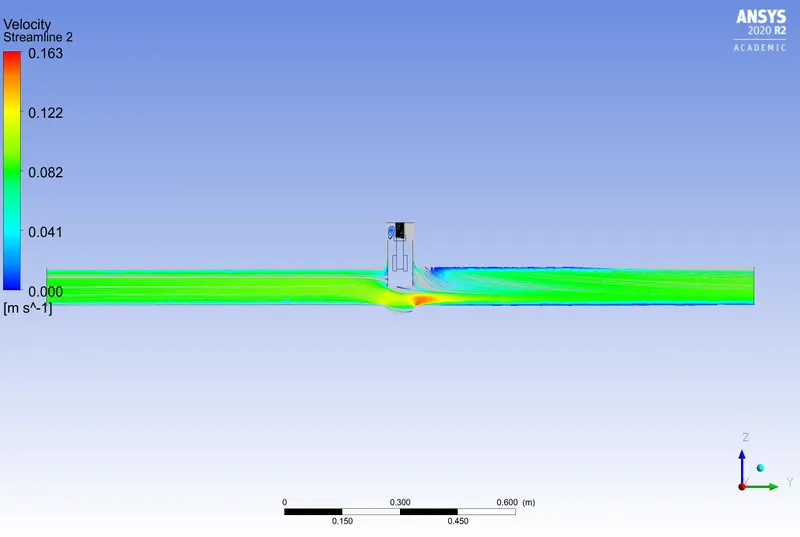
By analyzing the above plot it is seen that the velocity is increasing and hence the flow rate. The pressure contour is also shown below:
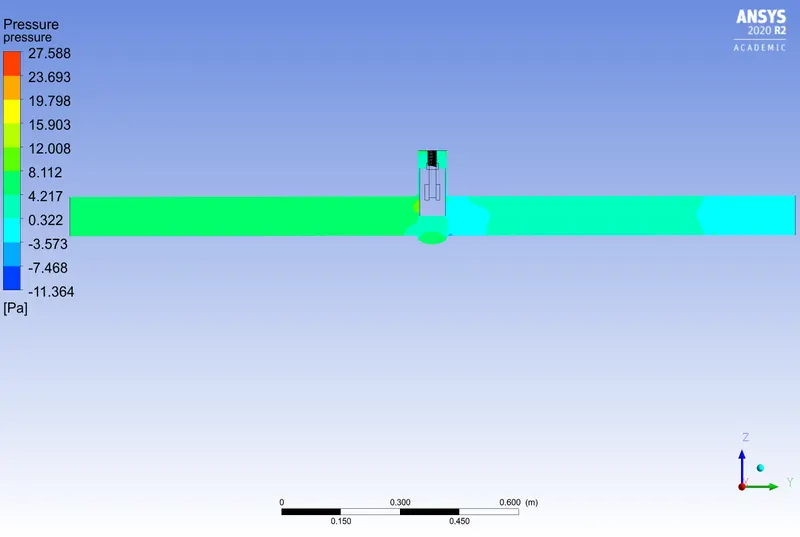
The results for the 70 mm lift were anomalous due to some bugs in Ansys Workbench. So the results for 80 mm lift are presented below.
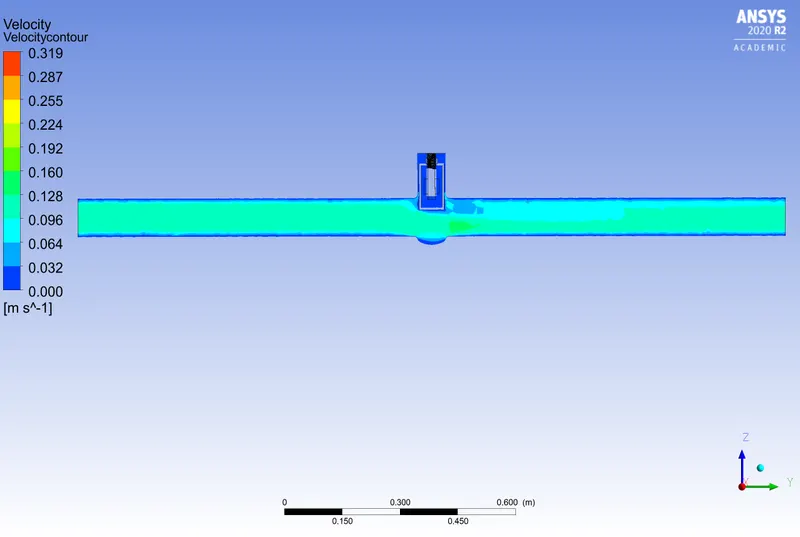
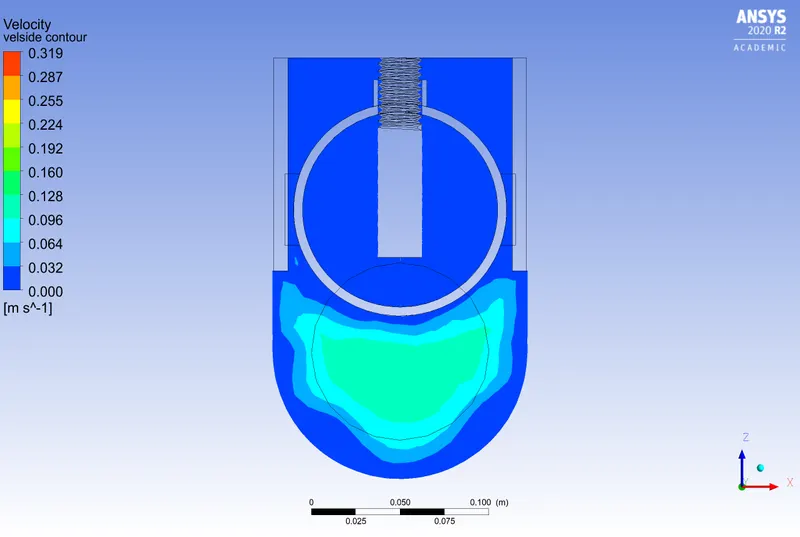
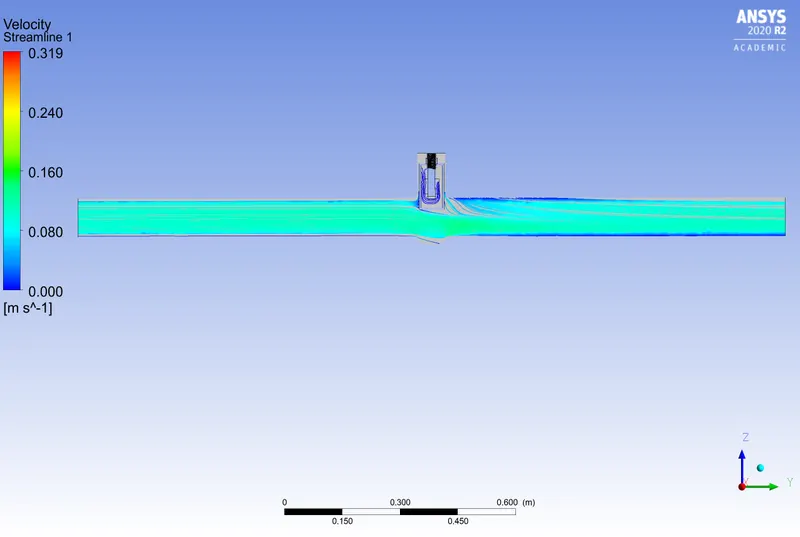
As the lift is 80 mm it can be seen that the velocity is further increased and thus the flow rate also is increased.
The pressure contour for the above case is shown below:
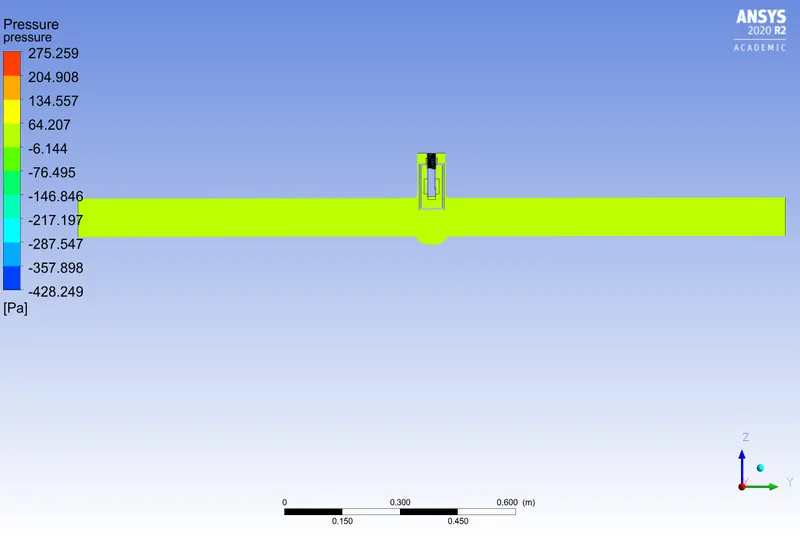
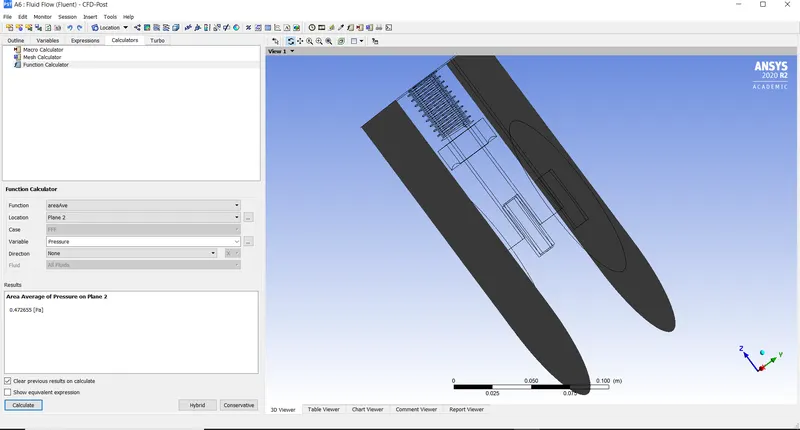
The valve flow coefficients can be calculated using the discharge value and the pressure differential across the gate valve. The pressure differential can be calculated using the CFD post, two planes are created near the gate valves and the pressure is calculated on those planes for each of the cases.
The pressure extracted for a lift of 50 mm of the gate disc is shown below:
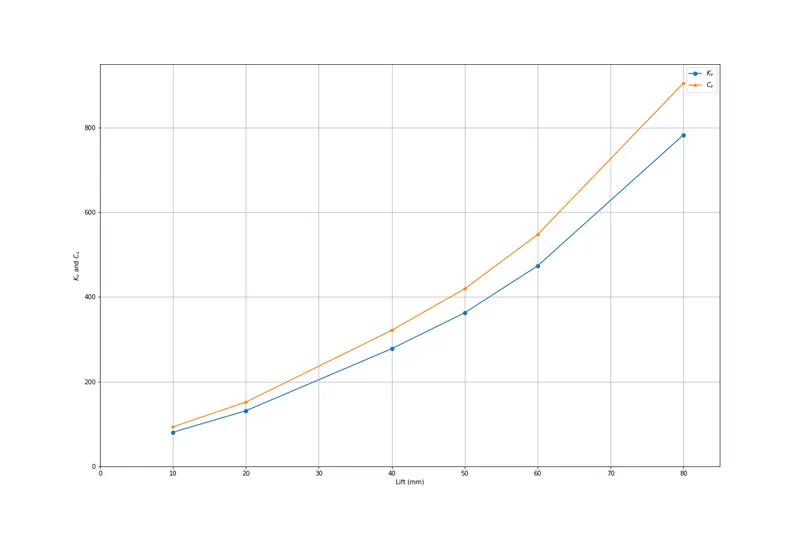
The flow coefficients for different values of lift is calculated and plotted. The figure is shown below:
The python code used to plot the above figure is shown below:
import math
import matplotlib.pyplot as plt

Q = [.14906,0.2383,0.46864,0.56267,0.63346,0.76153]

delp = [4.42178e-5,4.270515e-5,3.685506e-5,3.121335e-5,2.32038e-5,1.22664e-5]


SG =1
lift =[10,20,40,50,60,80]
K_v =[]
C_v =[]
for i in range(0,len(Q)):
    k_v = Q[i]*3.6*math.sqrt(SG/delp[i])
    c_v = 1.156*k_v
    K_v.append(k_v)
    C_v.append(c_v)
print(K_v)

plt.figure(figsize=(18,12))
plt.plot(lift,K_v,'-o', label=r'$K_v$')
plt.plot(lift,C_v,'-*',label=r'$C_v$')
plt.xlim(0,85)
plt.ylim(0,950)
plt.xlabel('Lift (mm)')
plt.ylabel(r'$K_v$ and $ C_v$')
plt.legend()
plt.grid()
plt.savefig('parametric_valve.png')
While looking at the parameter window it can be seen that there is reverse flow in the two design points which is caused due to some bugs in the software.
It can be also noted that as the lift is increased the flow coefficient and the flow factor is also increasing.
CONCLUSION
In this study, a parametric analysis of a gate valve is carried out. The input and output parameters were set and the analysis is carried out. It is an easy way to study the effect of change in some variable on the system. The output parameter is also created which changes with the input values.
The flow factor and the flow coefficient is calculated for different values of the lift of the gate disc. As expected the flow rate increases as the lift of the gate disc increases.