Fuel Cell
What is a Fuel cell:
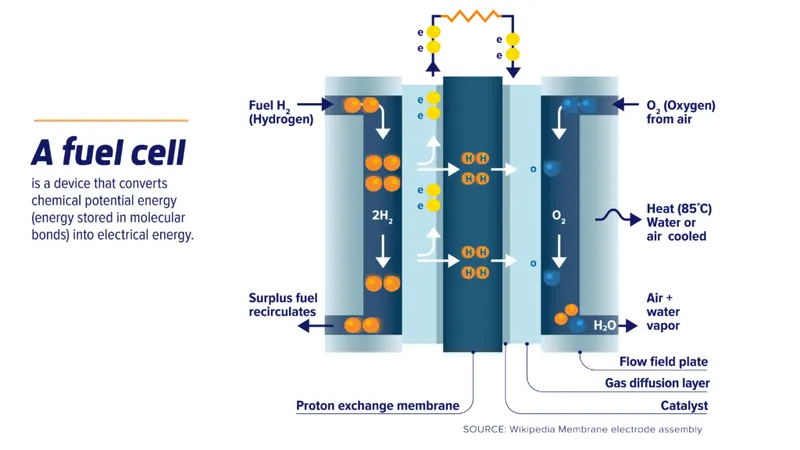
A fuel cell is an electrochemical cell that converts the chemical energy of a fuel (often hydrogen)
and an oxidizing agent(often oxygen) into electricity through a pair of redox reactions. Fuel cells cleanly and efficiently convert chemical energy from hydrogen-rich fuels into electrical power and high-quality heat via an electrochemical process that is efficient and emits water rather than pollutants as there is no burning of the fuel.
Working of a fuel cell:
Fuel cells are different from most batteries in requiring a continuous source of fuel and oxygen (usually from
air) to sustain the chemical reaction, whereas in a battery the chemical energy usually comes from metals and their ions or oxides that are commonly already present in the battery, except in flow batteries. Fuel cells can produce electricity continuously for as long as fuel and oxygen are supplied.
Fuel cells work like batteries, but they do not run down or need recharging. They produce electricity and heat as long as fuel is supplied. A fuel cell consists of two electrodes—a negative electrode (or anode) and a positive electrode (or cathode)—sandwiched around an electrolyte.
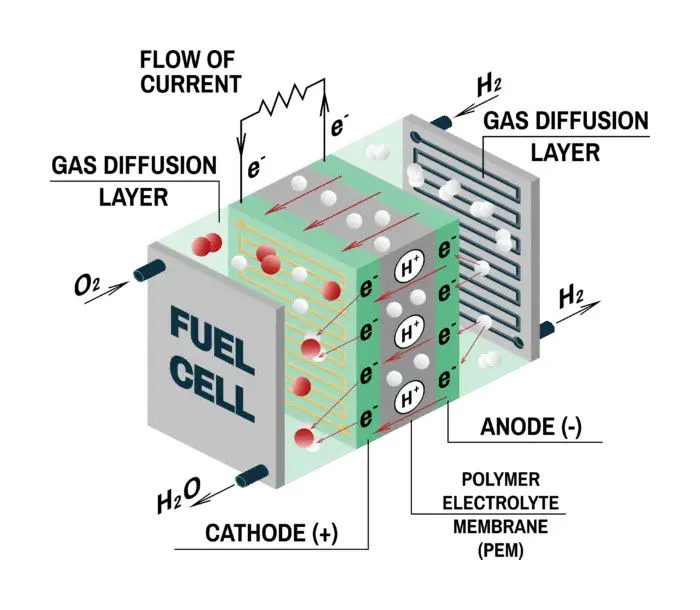
A fuel, such as a hydrogen, is fed to the anode, and the air is fed to the cathode. In a hydrogen fuel cell, a
catalyst at the anode separates hydrogen molecules into protons and electrons, which take different paths to the cathode. The electrons go through an external circuit, creating a flow of electricity. The protons migrate through the electrolyte to the cathode, where they unite with oxygen and the electrons to produce water and heat.
Fuel cell electric vehicle work using hydrogen:
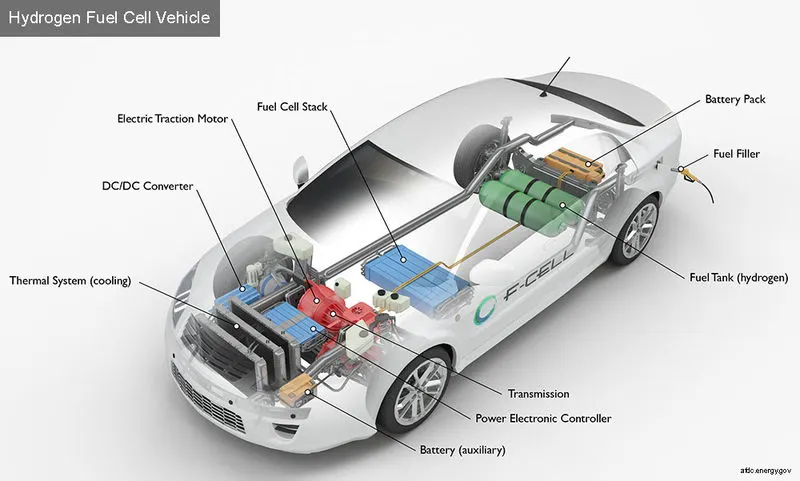
Although automakers could design an FCEV with plug-in capabilities to charge the battery, most FCEVs today use the battery for recapturing braking energy, providing extra power during short acceleration events, and to smooth out the power delivered from the fuel cell with the option to idle or turn off the fuel cell during low power needs. It can be seen through the above diagrams that when the fuel is supplied at the anode or positive electrode, where electrons are released from fuel under catalyst. The positive electrons pass through the electrolyte where are negative once passes through the external circuit and perform the work.
On the other side, as there is a continuous flow of oxygen these hydrogen atoms combine with the oxygen and form water ( H2O ), and this water comes as an exhaust. There are no exhaust gases in this case.
Anode --> H2→2H++2e−
Cathode --> 2e−+2H++12O2→H2O
Cell --> H2+12O2→H2O
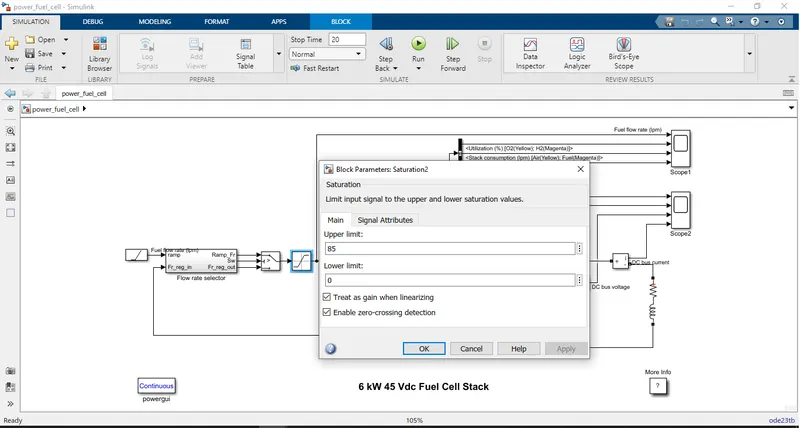
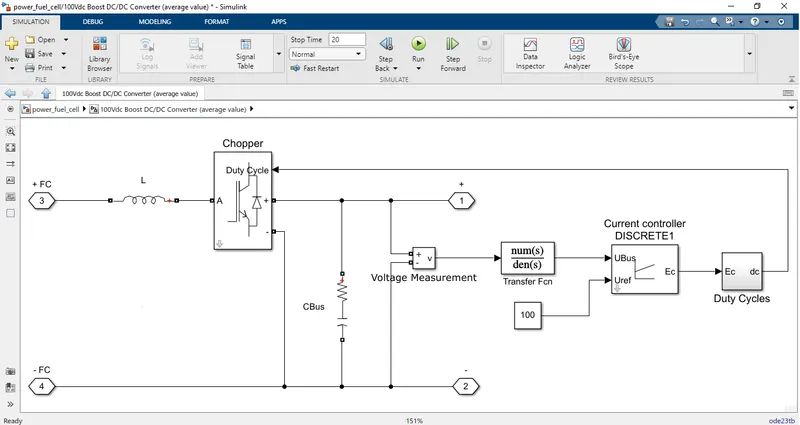
In the below images input parameters can be seen.
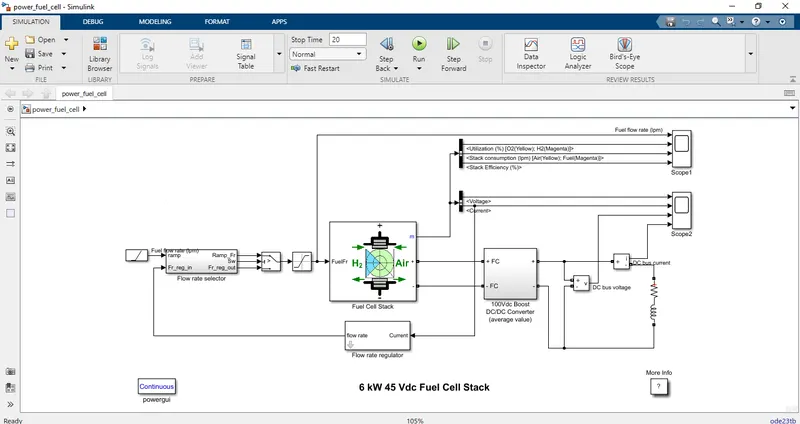
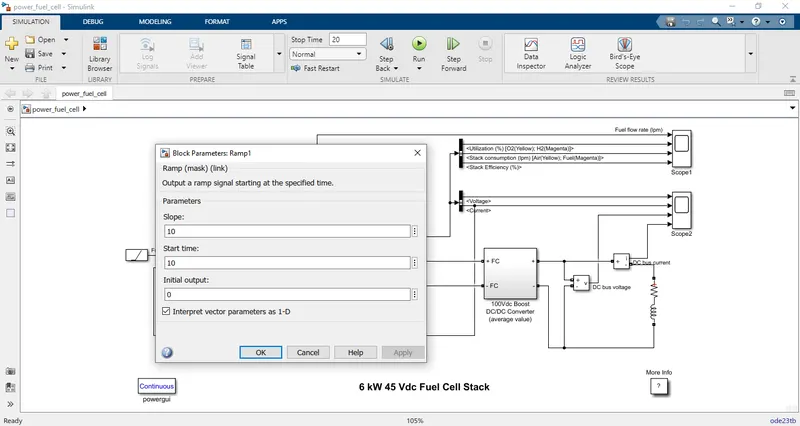
First of all, the ramp block as an input is used which has the input values as shown.
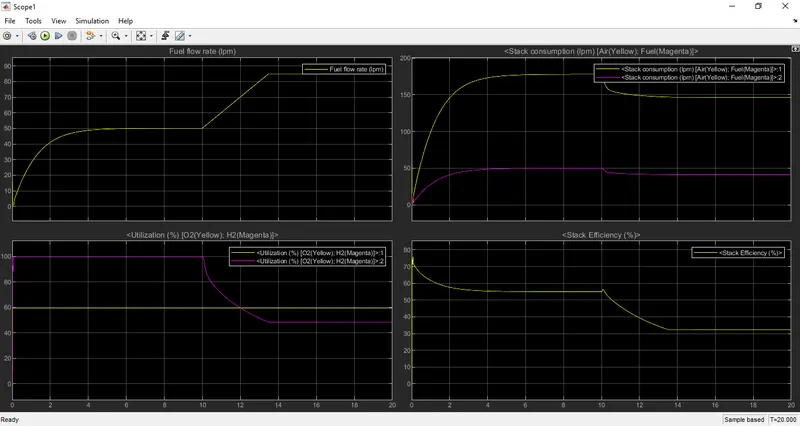
Fuel flow rate: The fuel flow rate of the fuel cell stack has been plotted on the basis of the drive cycle given to it as a reference with the time and speed of the vehicle. so in this case fuel flow rate of the fuel cell stack is started from the initial point 0 to the final point 50 and fluctuations in between up and down according to the speed and time reference allotted in the drive cycle.
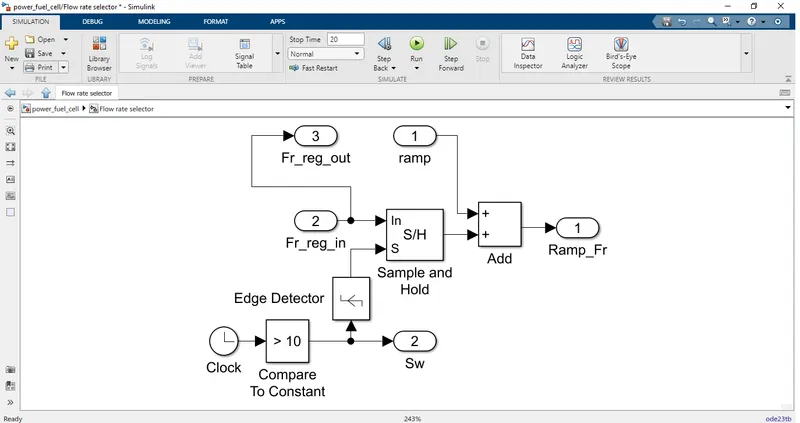
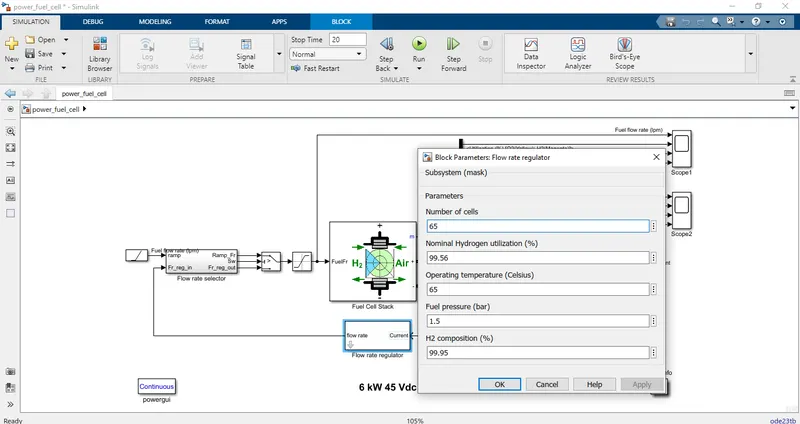
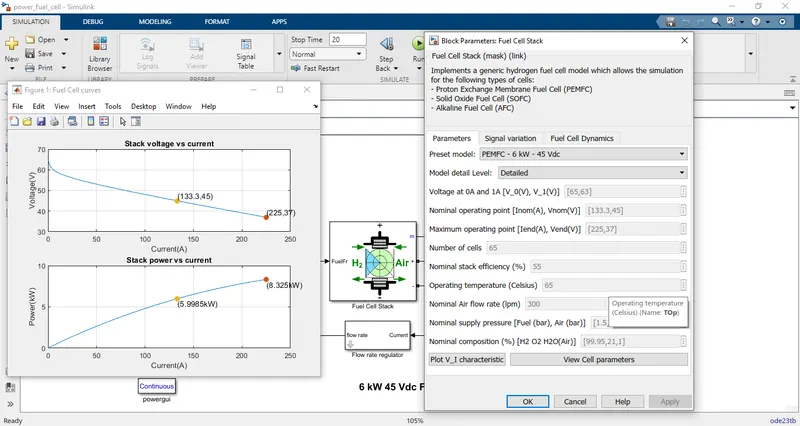
As per the requirement, the preset model is taken as 50 KW and 625Vdc. All the other input parameters are taken as it is. The necessary parameters are also mentioned in the block. There are a number of different model parameters available however, the OEM is always recommended as that is the most standard model currently used.
From the below chart the behavior of current and voltage, and, current and power can be seen.
Hydrogen and Oxygen Used in %: The hydrogen and oxygen utilization is based on the drive cycle given to it as a reference with and time and speed. whereas in this case oxygen is utilized more compared to hydrogen. oxygen has started initially from the point 100 and fluctuated in between and reached a final position at a point of 90. whereas in the case of hydrogen it was constant throughout the utilization with a
stable point of 60 from the initial to the final.
Stack consumption of Air and fuel: Here in the case of stack consumption of air and fuel the stack consumption of fuel flow rate is more compared to the stack consumption of the air with the reference of the drive cycle data of time and speed given to it.
The following graphs show the fuel flow rate, H2, and O2 utilization percent, stack consumption, and overall efficiency.
The plots below show the voltage and current behavior.
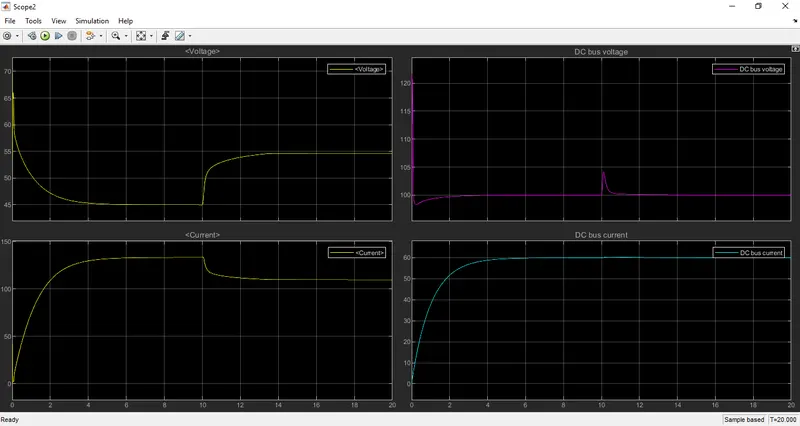
From the plot, it can be seen that, as the voltage increases the current value changes accordingly. The moment the voltage shifts suddenly, there is a slight change in bus voltage which increases for a short period of time and again comes to its original value.
Reference: