Frequency Analysis of a rotating shaft
Abstract:-
The aim of this project is to perform a frequency analysis on a rotating shaft, from there we need to determine the critical frequencies and the mode shapes. 5 Mode Shapes were simulated and analysed.
Introduction:-
Frequency is the number of occurrences of a repeating event per unit of time. The formula of frequency (f) is:
 , where T is the period.
When a system is initially disturbed by displacement, velocity, the system begins to vibrate with a constant amplitude and frequency depend on its stiffness and mass. During vibration, the system is not subjected to any external force and that is why it is called free vibration. This frequency is called as natural frequency, and the form of the vibration is called mode shapes.
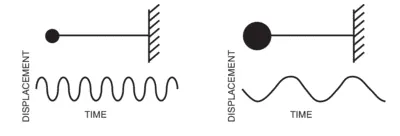
Figure 1 Figure 2
Figure 1 A lower mass increases the natural frequency.
Figure 2 A higher mass lowers natural frequency.
Resonance: When the force/excitation frequency is increased and reaches natural frequency, amplitudes will dangerously increase in this region. If an external force applied to a linear system, the system will follow the force with the same frequency.
Modelling:-
The model was created via SolidWorks, the two steps of creating the 3D model are:
1. Sketch the model with appropriate dimensions, the dimensions are shown in Figure 3.
Figure 3: a two-dimensional sketch of the model (units in mm)
2. Use the "Revolved Boss/Base" feature to form the 3D sketch, this is shown in Figure 4.
Figure 4: Three-dimensional model of the rotating shaft
Simulation of the model:-
Before starting the simulation, A material was applied to the shaft, Alloy steel was chosen, Figure 5 shows its properties
Figure 5: Alloy Steel properties
The next step of the simulation is to apply a bearing fixture on the stepped face of the rod at the two ends, Figure 6 shows the fixtures
Figure 6: bearing fixtures added on the model
After applying the fixtures to the rotating shaft, a mesh will be applied. Figure 7 shows the properties of the mesh used for both plates.
Figure 7: mesh parameters
Figure 8 shows the rotating shaft being meshed.
Figure 8: The meshed model of the shaft
Results:-
Mode 1 shape is plotted in figure 9
Figure 9: Mode 1 shape plot of the shaft
Mode 2 shape is plotted in Figure 10
Figure 10: Mode 2 shape plot of the shaft
Mode 3 shape is plotted in Figure 11
Figure 11: Mode 3 shape plot of the shaft
Mode 4 shape is plotted in Figure 12
Figure 12: Mode 4 shape plot of the shaft
Mode 5 shape is plotted in Figure 13
Figure 13: Mode 5 shape plot of the shaft
The resonance frequencies for different mode shapes are shown in table 1
| Mode Number | Frequency (Hertz) | Frequency (rad/s) | Period (seconds) |
| 1 | 0.015425 | 0.096918133 | 64.8298217 |
| 2 | 166.54 | 1046.40168 | 0.000955656 |
| 3 | 166.54 | 1046.40168 | 0.000955656 |
| 4 | 763.13 | 4794.887198 | 0.001310393 |
| 5 | 763.14 | 4794.95003 | 0.001310376 |
Table 1: Frequency and period values in each Mode shape number
The plot for natural frequency vs mode number is shown in figure 14.
Figure 14: Natural frequency vs Mode number graph plot
Conclusion:-
The Resonance frequencies that are obtained are provided in table 1. This indicates that the rotating shaft should not be operated at these frequencies since this would result in failure of the shaft. This can be avoided by adding dampers to the system. The material also impacts the values of the resonance frequency. The frequency of a given structure made from different materials depends on the mass density and stiffness properties of the material. A material with higher density results in a lower frequency, however a material with high stiffness results in a higher frequency of the structure.