Modelling and Simulation of flow through a Flowbench
Aim:
To run flow analysis on a 3D model of a flow bench in order to obtain a plot of valve lift vs mass flow rate by:
(a) Grid dependence test to find the best mesh size for simulation,
(b) Parametric sweep to show the effect of valve lift on mass flow rate.
Introduction:
An air flow bench is a device used for testing the internal aerodynamic qualities of an engine component and is related to the more familiar wind tunnel.
It is used primarily for testing the intake and exhaust ports of cylinder heads of IC engines. It is also used to test the flow capabilities of any component such as air filters, carburetors, manifolds or any other part that is required to flow gas. A flow bench is one of the primary tools of high performance engine builders, and porting cylinder heads would be strictly hit or miss without it.
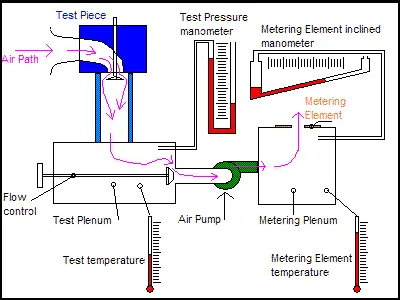
Source: https://en.wikipedia.org/wiki/Air_flow_bench
The air flow bench can give a wealth of data about the characteristics of a cylinder head or whatever part is tested. The result of main interest is bulk flow. It is the volume of air that flows through the port in a given time.
Valve lift can be expressed as an actual dimension in decimal inches or mm. It can also be specified as a ratio between a characteristic diameter and the lift L/D. Most often used is the valve head diameter.
Mass air flow (or) Mass flow rate is the weight of air that flows through the port in a given time. Expressed in pounds per minute/hour or kilograms per second/minute.
With the information gathered on the flow bench, engine power curve and system dynamics can be roughly estimated by applying various formulae. With the advent of accurate engine simulation software, however, it is much more useful to use flow data to create an engine model for a simulator.
Determining air velocity is a useful part of flow testing. Once velocity has been calculated, the volume can be calculated by multiplying the velocity by the orifice area times its flow coefficient.
Procedure for modelling:
To create a 3D model of a flow bench, a cylinder, inlet manifold and valve are modelled as a single geometry.
For modelling a cylinder, a circle was sketched and then extruded to obtain the cylindrical component.
In the front plane, line was sketched to specify the path of inlet manifold. Then a reference plane was created using the line and its initial point and and in this plane, a circle was sketched. Using Sweep command, 3D shape of the inlet was obtained.
Using Shell command, a shell was created at the inlet as well as the outlet of the manifold.
To model the valve, a reference plane was created using the axis parallel to inlet manifold and the right plane. Then a sketch for the valve is created and revolved so as to obtain the 3D shape of the valve.
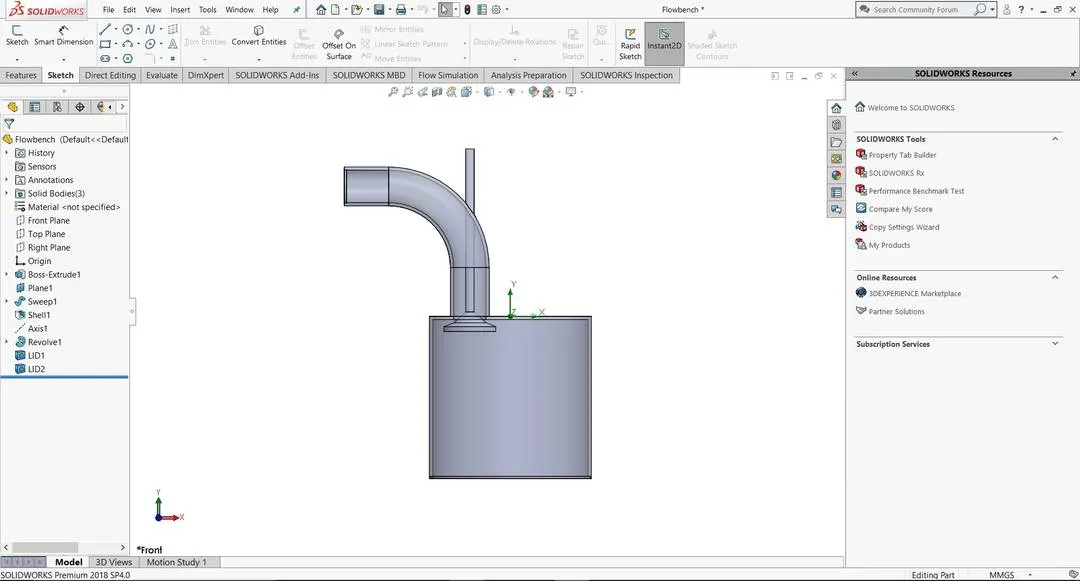
All the components were constrained appropriately and saved.
Case setup and Procedure:
Once the model is complete, Flow simulation was enabled using SolidWorks Add-Ins.
Using Create Lids command, lids were created for the inlet and outlet respectively.
Internal flow was chosen and Air was selected as the working fluid. Other parameters were left as default.
Boundary conditions were specified as Total Pressure at the Inlet and Static Pressure at the Outlet.
Also, Goal plots for Mass Flow Rate were mentioned to obtain the required results.
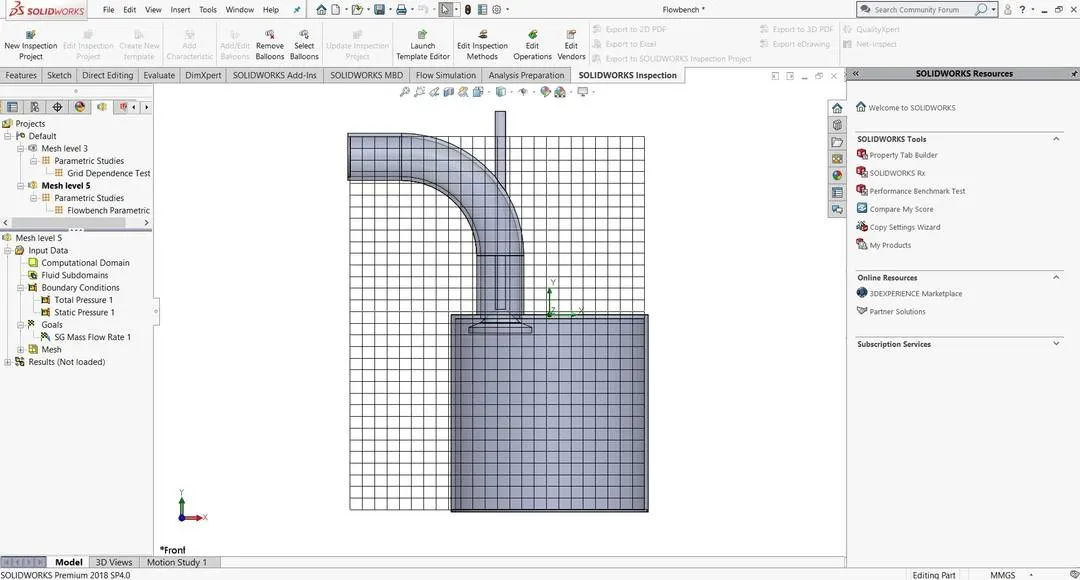
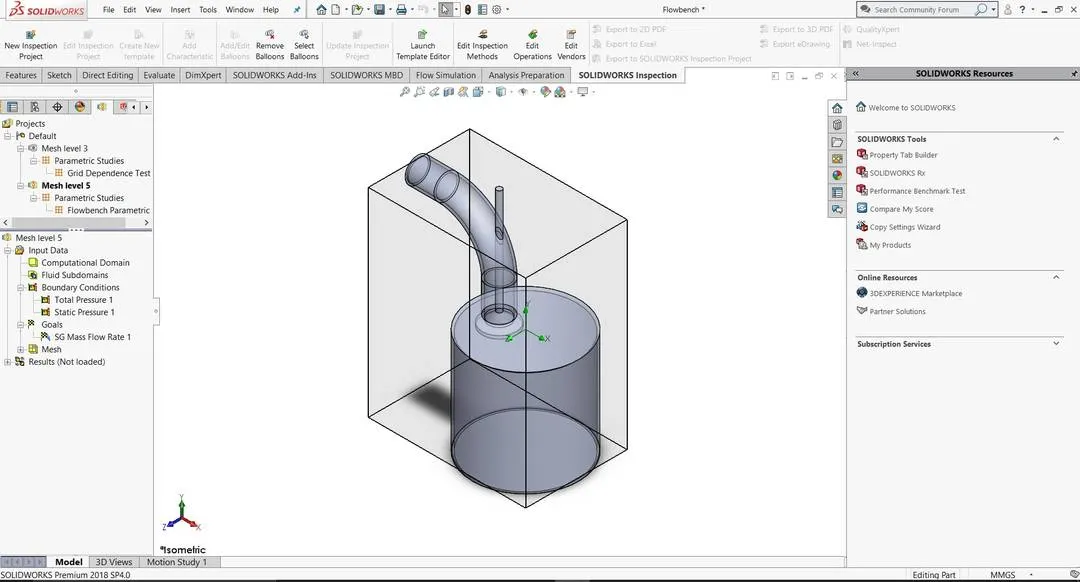
Apart from the Global mesh, a local mesh was defined for the cells attached to the valve so as to give still more accurate results. The basic mesh and computational domain are shown as follows:
Results:
1) Grid dependence test:
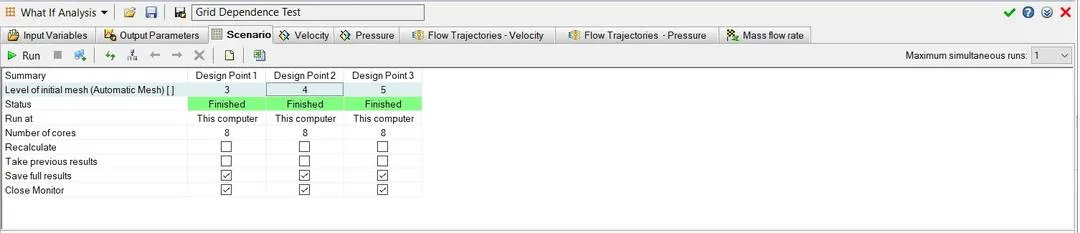
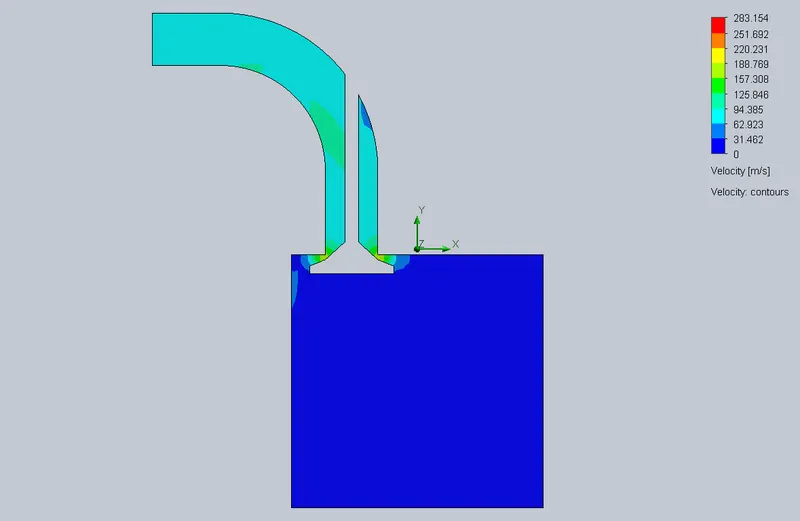
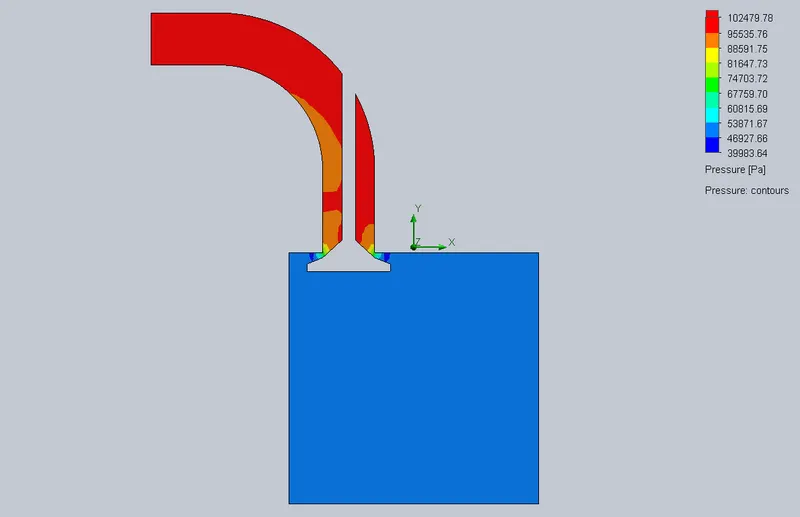
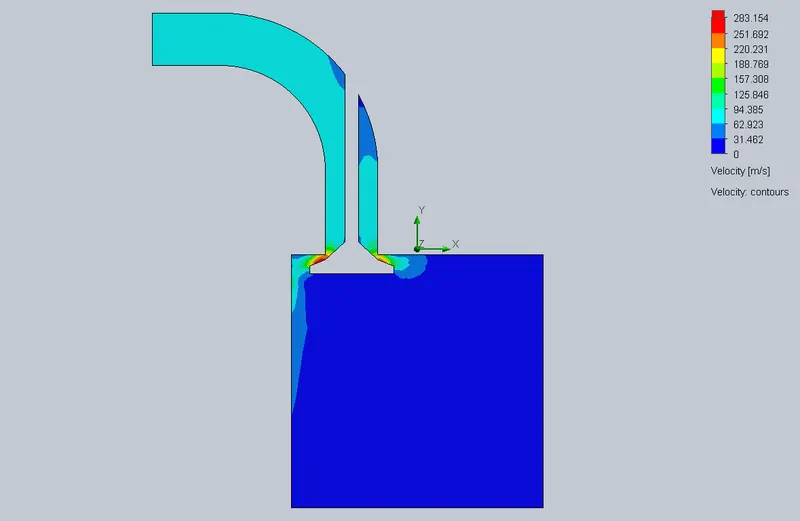
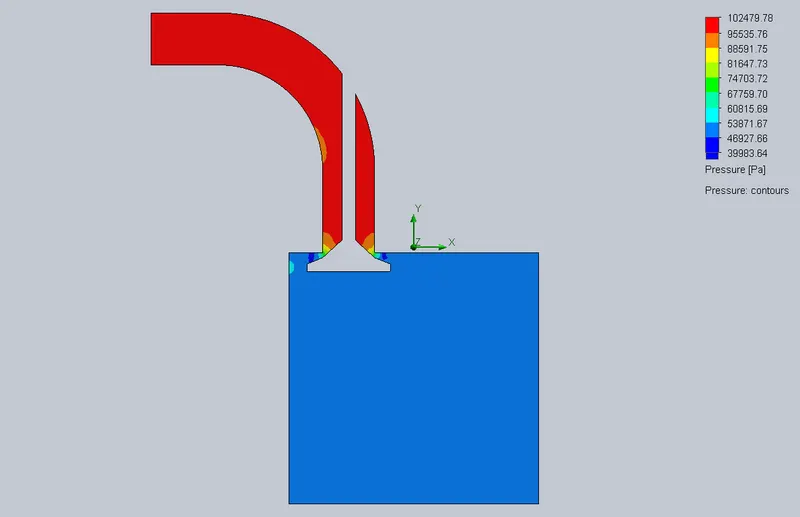
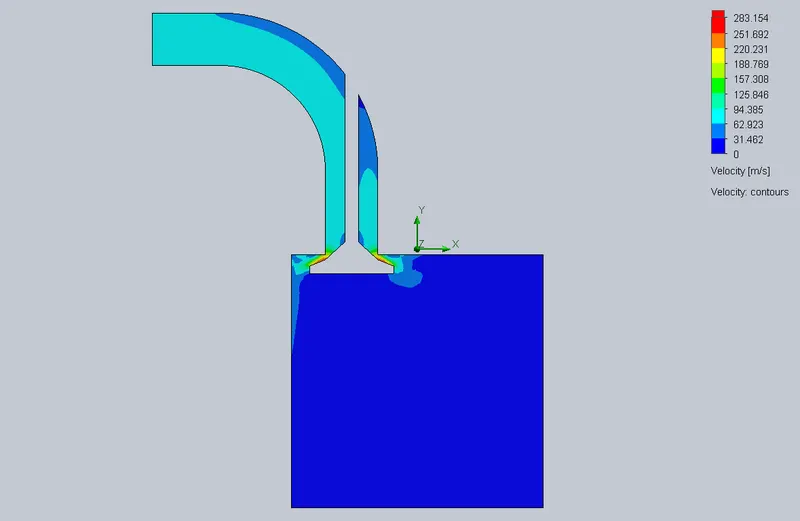
To run the Grid dependence test, a particular valve lift was set as constant (1 mm) and three different mesh levels 3, 4 and 5 were chosen so as to find out the best mesh level for the simulation. Higher mesh level indicates finer mesh quality. Also, Cut plots for velocity and pressure were obtained.
Image for completion of Grid dependence test is shown below:
(a) Mesh level 3:
Velocity cut plot:
Pressure cut plot:
(b) Mesh level 4:
Velocity cut plot:
Pressure cut plot:
(c) Mesh level 5:
Velocity cut plot:
Pressure cut plot:
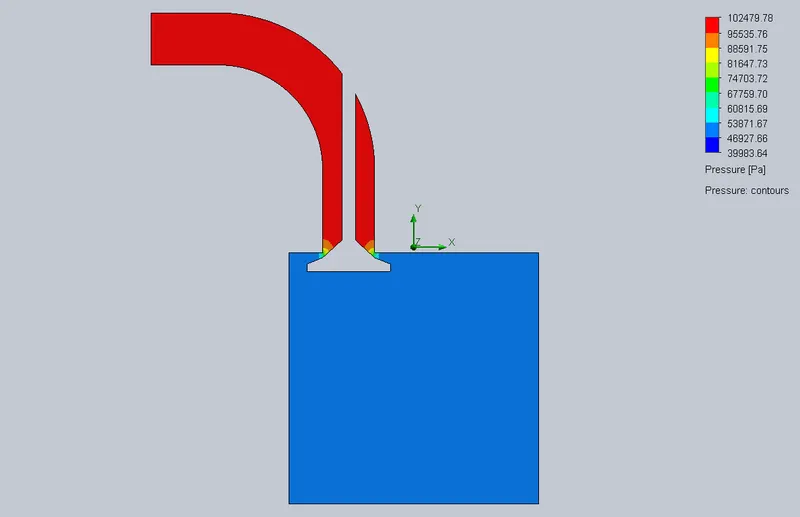
For the same valve lift of 1 mm, three different results were obtained since the mesh sizes were different in each case. As mesh becomes finer, value of velocity and pressure are getting closer to accurate value. The contours were also changing in each case.
From these results, it is clear that the mesh level 5 is the best one since it gives much better results. In general, fine mesh is better than a course mesh but the computational time and resources increase as the mesh size becomes finer.
2) Parametric study for various valve lifts:
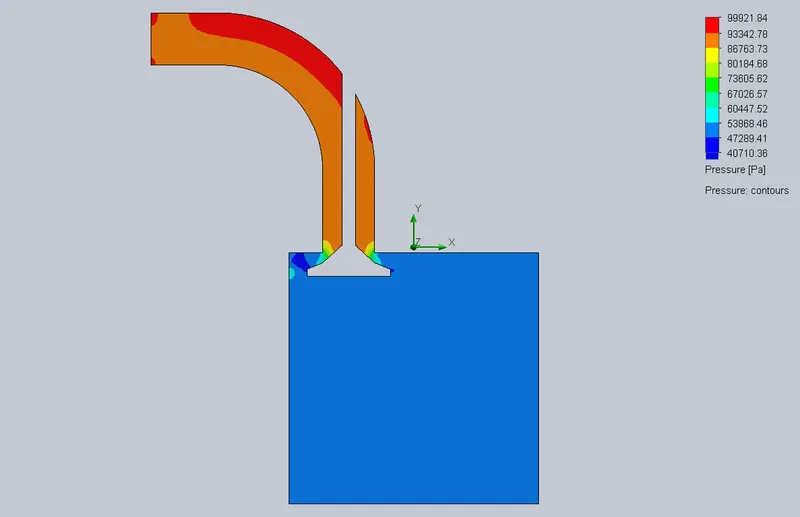
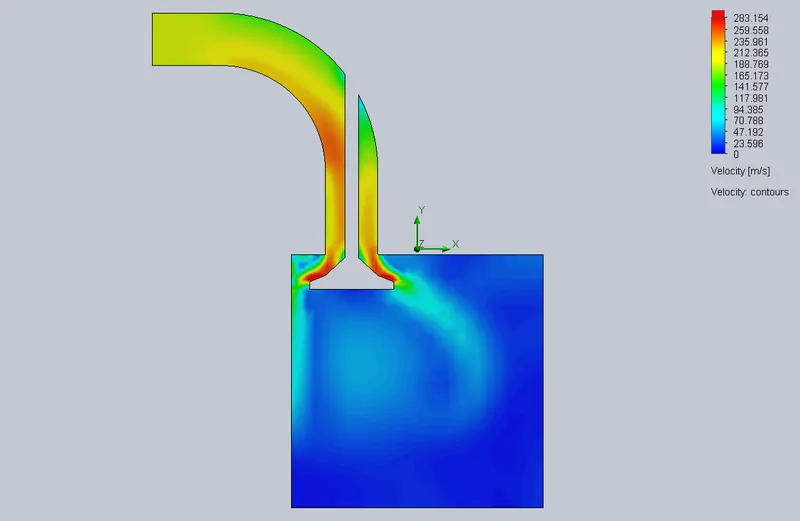
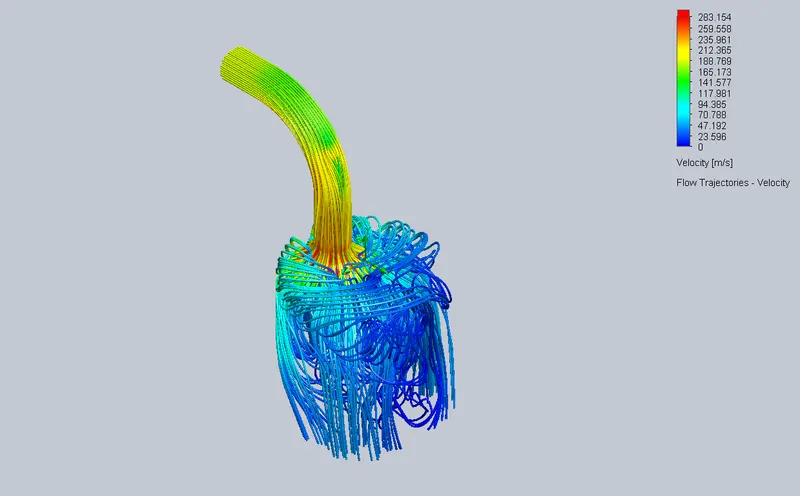
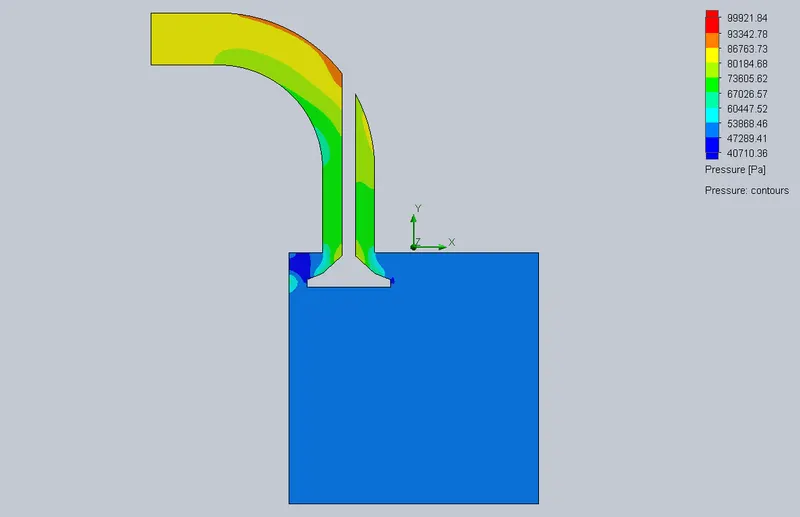
Once the best mesh level was chosen, a parametric study was carried out at the chosen mesh level for various valve lifts. For the base line simulation, the best mesh level at a constant valve lift was taken and then parametric study for various valve lifts were carrried out.
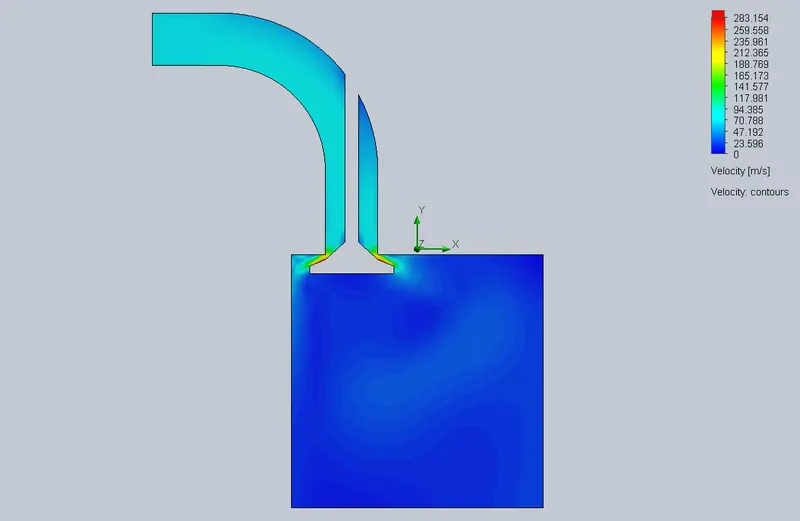
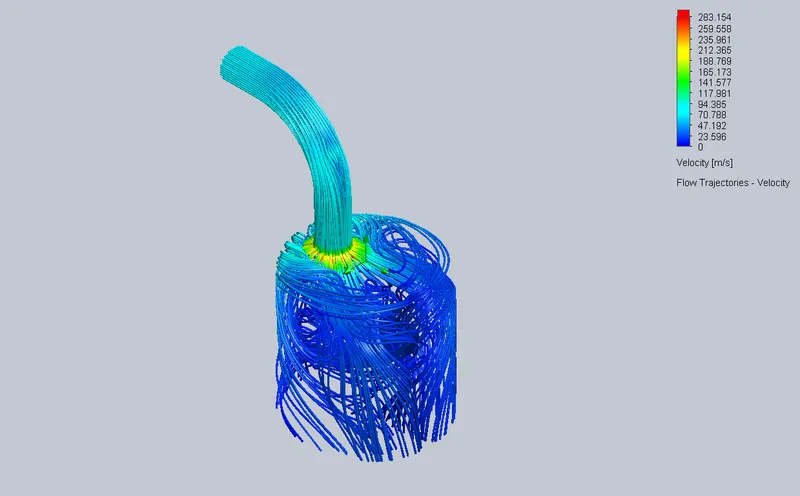
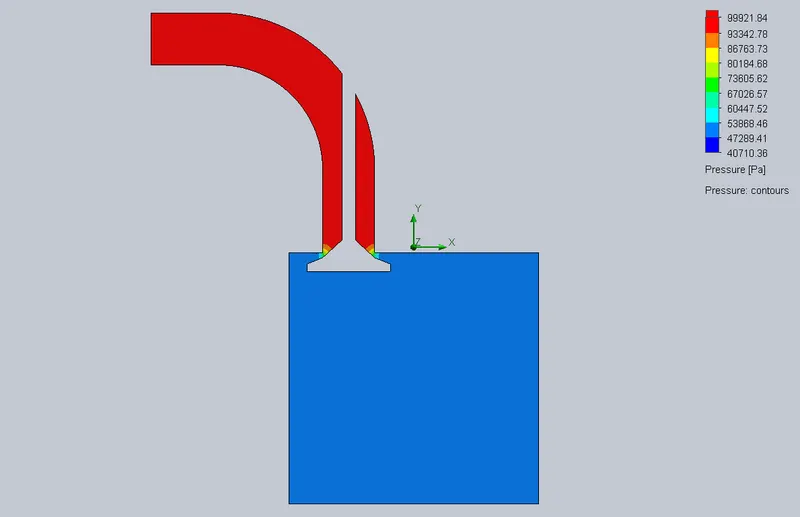
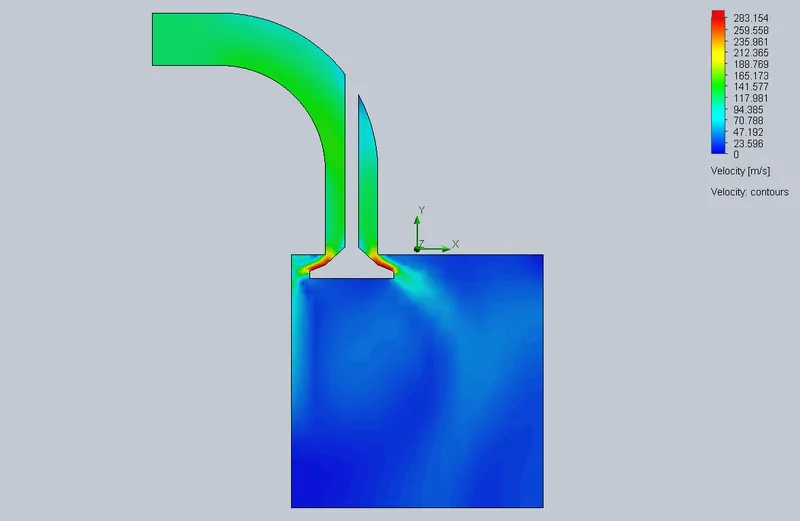
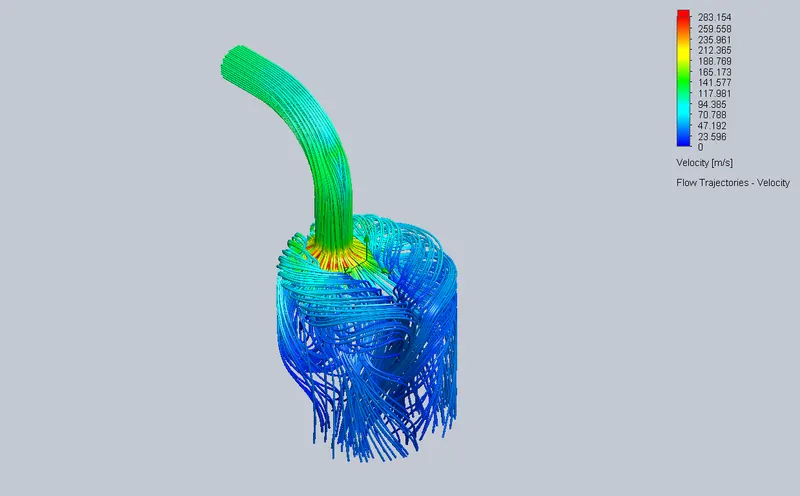
Here, I had considered valve lift from 2 mm to 10 mm in steps of 2, the simulation at valve lift 1 mm being the baseline simulation. Cut plots of velocity and pressure, Flow trajectory of velocity and Mass flow rate vs Valve lift were obtained as outputs from this study.
(a) Baseline simulation - Valve lift 1 mm:
Velocity cut plot:
Velocity flow trajectory:
Pressure cut plot:
(b) Valve lift 2 mm:
Velocity cut plot:
Velocity flow trajectory:
Pressure cut plot:
(c) Valve lift 4 mm:
Velocity cut plot:
Velocity flow trajectory:
Pressure cut plot:
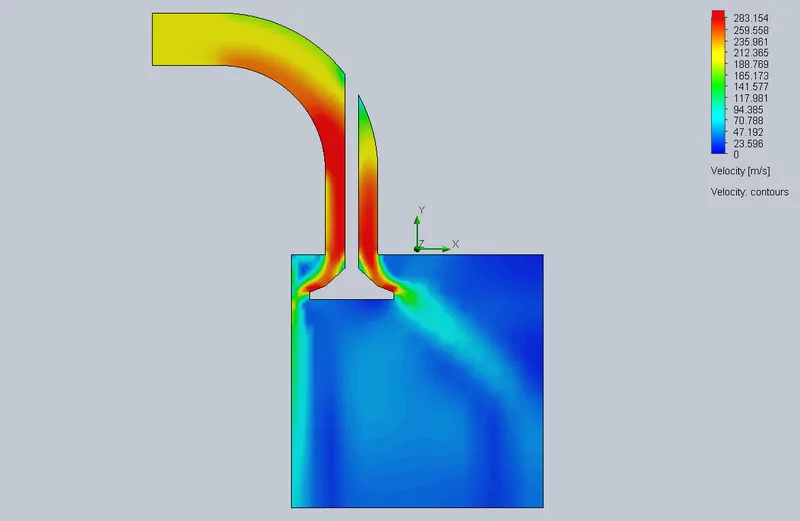
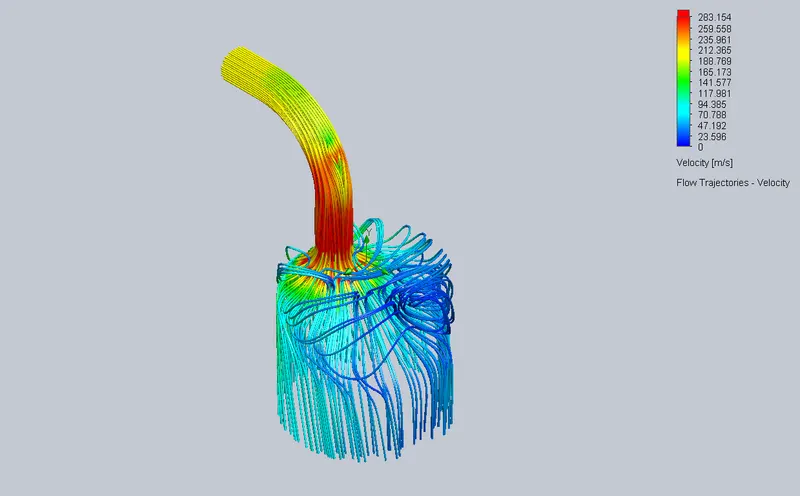
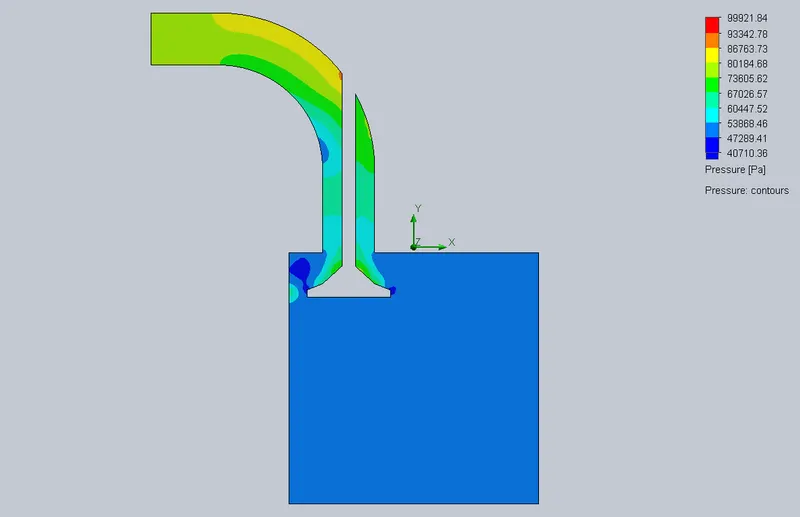
(d) Valve lift 6 mm:
Velocity cut plot:
Velocity flow trajectory:
Pressure cut plot:
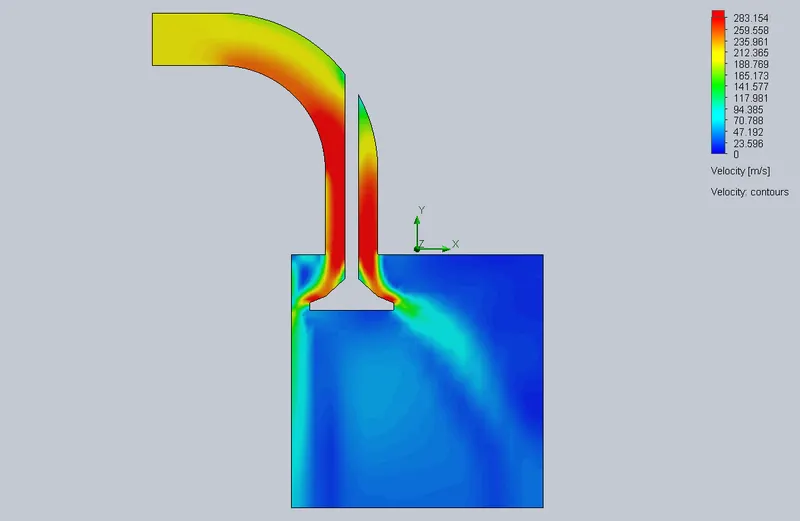
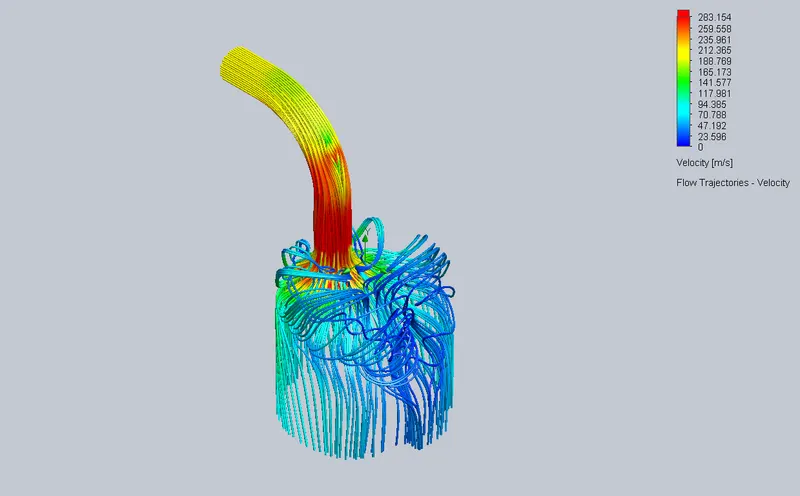
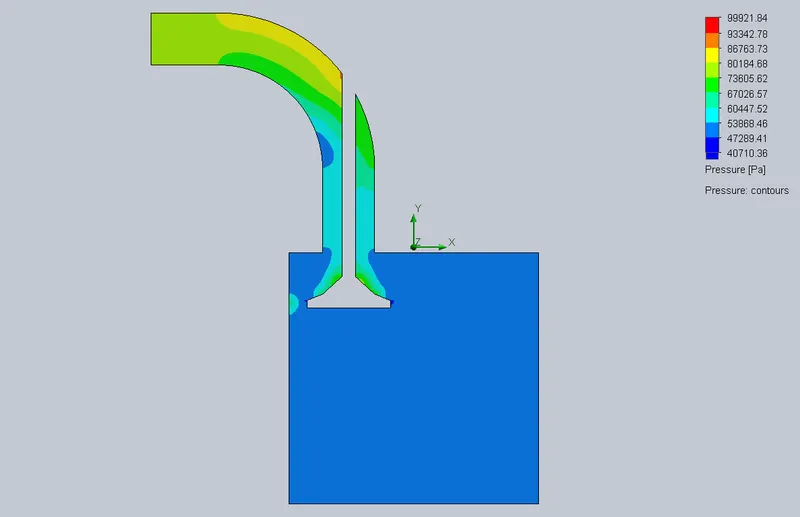
(e) Valve lift 8 mm:
Velocity cut plot:
Velocity flow trajectory:
Pressure cut plot:
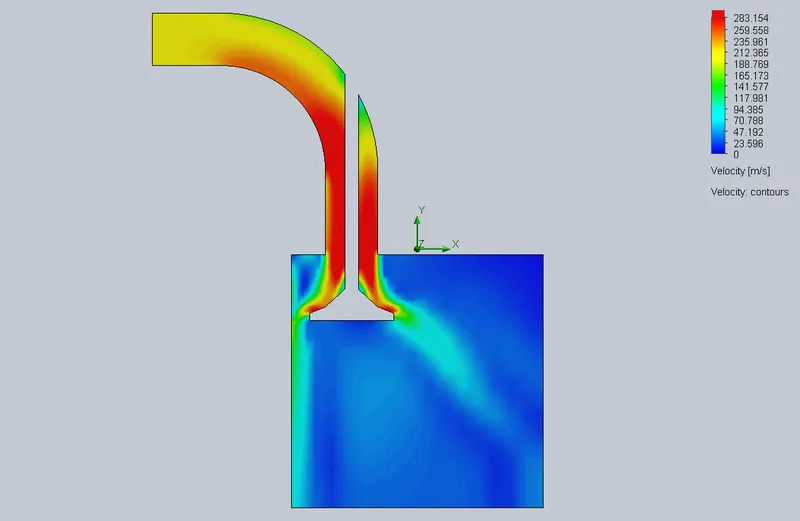
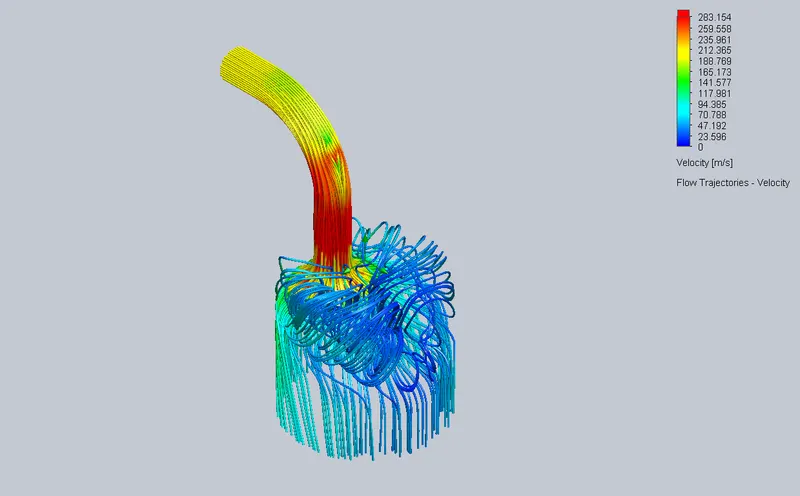
(f) Valve lift 10 mm:
Velocity cut plot:
Velocity flow trajectory:
Pressure cut plot:
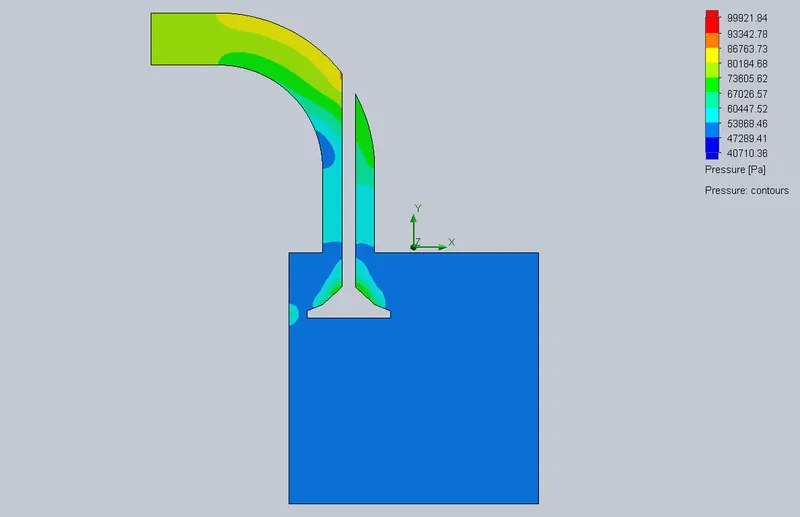
In all these plots, it can be seen that velocity increases as the valve lift increases and pressure decreases as the valve lift increases. The change is significant in each of the design points which can be visualized in the contours of cut plots and flow trajectories.
3) Effect of valve lift on mass flow rate:
| Goal | Design Point 1 | Design Point 2 | Design Point 3 | Design Point 4 | Design Point 5 |
| Valve lift [in m] | 0.002 | 0.004 | 0.006 | 0.008 | 0.01 |
| SG Mass Flow Rate 1 [kg/s] | -0.010235775 | -0.014350464 | -0.01530666 | -0.015424211 | -0.015436817 |
The above values were obtained after the parametric study was carried out.
Plot of Mass flow rate vs Valve lift:
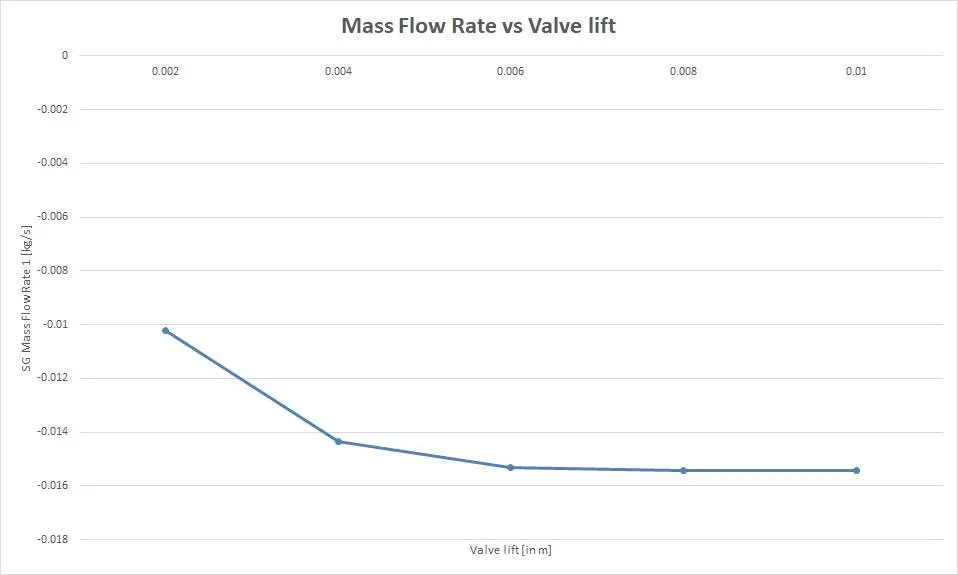
Mass flow rate increases as the valve lift increases. For higher valve lifts, mass flow rate is getting constant. The negative value is an indication that mass leaves the system.
Observations:
The Velocity of fluid entering the cylinder increases with increase in valve lift.
The Pressure of fluid entering the cylinder decreases, as the valve lift increases.
The negative values of mass flow rate indicate that mass leaves the system.
It can be seen that the mass flow rate at the outlet increases as the valve lift increases.
At higher values of valve lift, the mass flow rate approaches to a constant value gradually.
Conclusion:
A 3D geometry of flow bench was created and flow analysis was carried out. Grid dependence test was run and best mesh size was chosen. A parametric study for various valve lifts at the best mesh size was run and the effect of lift vs mass flow rate was studied. Also, the results were visualized in the form of cut plots and graphs and explanations were given in the report.
Reference for theory: