Flow Simulation over an Airfoil in Solidworks
AIM : To model the flow over an airfoil for various angle of attacks.
OBJECTIVES :
- To model the flow over an airfoil which can be obtained from here - airfoil data
- To compare the lift and drag forces for the angle of attacks 0,2,4,6,8,10 degrees.
INTRODUCTION : An airfoil is the cross-sectional shape of a wing, blade (of a propeller, rotor, or turbine), or sail (as seen in cross-section). An airfoil-shaped body moving through a fluid produces an aerodynamic force. The component of this force perpendicular to the direction of motion is called lift. The component parallel to the direction of motion is called drag. Subsonic flight airfoils have a characteristic shape with a rounded leading edge, followed by a sharp trailing edge, often with a symmetric curvature of upper and lower surfaces. Foils of similar function designed with water as the working fluid are called hydrofoils.
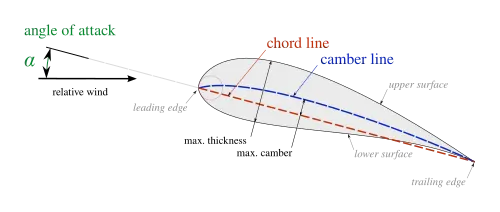
The lift on an airfoil is primarily the result of its angle of attack. When oriented at a suitable angle, the airfoil deflects the oncoming air (for fixed-wing aircraft, a downward force), resulting in a force on the airfoil in the direction opposite to the deflection. This force is known as aerodynamic force and can be resolved into two components: lift and drag. Most foil shapes require a positive angle of attack to generate lift, but cambered airfoils can generate lift at zero angle of attack. This "turning" of the air in the vicinity of the airfoil creates curved streamlines, resulting in lower pressure on one side and higher pressure on the other. This pressure difference is accompanied by a velocity difference, via Bernoulli's principle, so the resulting flowfield about the airfoil has a higher average velocity on the upper surface than on the lower surface.
A lift and drag curve obtained in wind tunnel testing is shown on the right. The curve represents an airfoil with a positive camber so some lift is produced at zero angle of attack. With increased angle of attack, lift increases in a roughly linear relation, called the slope of the lift curve. At about 18 degrees this airfoil stalls, and lift falls off quickly beyond that. The drop in lift can be explained by the action of the upper-surface boundary layer, which separates and greatly thickens over the upper surface at and past the stall angle. The thickened boundary layer's displacement thickness changes the airfoil's effective shape, in particular it reduces its effective camber, which modifies the overall flow field so as to reduce the circulation and the lift. The thicker boundary layer also causes a large increase in pressure drag, so that the overall drag increases sharply near and past the stall point.
Airfoil design is a major facet of aerodynamics. Various airfoils serve different flight regimes. Asymmetric airfoils can generate lift at zero angle of attack, while a symmetric airfoil may better suit frequent inverted flight as in an aerobatic airplane. In the region of the ailerons and near a wingtip a symmetric airfoil can be used to increase the range of angles of attack to avoid spin–stall. Thus a large range of angles can be used without boundary layer separation. Subsonic airfoils have a round leading edge, which is naturally insensitive to the angle of attack. The cross section is not strictly circular, however: the radius of curvature is increased before the wing achieves maximum thickness to minimize the chance of boundary layer separation. This elongates the wing and moves the point of maximum thickness back from the leading edge.
Lift Forces - A fluid flowing around the surface of an object applies a force against it. It makes no difference whether the fluid is flowing past a stationary body or the body is moving through a stationary volume of fluid. Lift is the component of this force that is perpendicular to the oncoming flow direction. Lift is always accompanied by a drag force, which is the component of the surface force parallel to the flow direction. An airfoil is a streamlined shape that is capable of generating significantly more lift than drag. A flat plate can generate lift, but not as much as a streamlined airfoil, and with somewhat higher drag.
Therefore, the lift equation is given by `L =1/2*rho*V^2*S*C_L`
where `L` is the lifting force, `rho` is the density of air, `V` is the relative velocity of the airflow,`S` is the area of the airfoil as viewed from an overhead perspective, and `C_L` is the lift coefficient.
Drag Forces - As with lift, the drag of an airfoil depends on the density of the air, the velocity of the airflow, the viscosity and compressibility of the air, the surface area of the airfoil, the shape of the airfoil, and the angle of attack.The complexities associated with drag and the airfoil's shape, angle of attack, the air's viscosity, and air's compressibility are simplified in the drag equation by use of the drag coefficient. The drag coefficient is generally found through testing in a wind tunnel, where the drag can be measured, and the drag coefficient is calculated by rearranging the drag equation,
`D =1/2*rho*V^2*A*C_D`,
In the drag equation, `D` is the drag force, `rho` is the density of the air, `V` is the velocity ofthe air, `A` is a reference area, and `C_D` is the drag coefficient.
PROCEDURE :
- Geometric Modelling -
- At first, the coordinates of airfoil is imported into Solidworks through insert curve options and in a suitable plane its converted into an entity for further sketching. The tail section of the airfoil is not closed so a line is drawn between the two point of tail to make it a closed sketch. For simulation for different angle of attacks, it can be rotated about a reference point by providing angle of rotation. Then it is extruded to a certain width.
- For `0⁰` angle of attack -
- For `2⁰` angle of attack -
- For `4⁰` angle of attack -
- For `6⁰` angle of attack -
- For `8⁰` angle of attack -
- For `10⁰` angle of attack -
- Flow Simulation Setup -
- After modelling, Flow Simulation was setup and following input conditions are given,
- Analysis type: External and Time-Dependent with Simulation Time of 5 seconds and Time Step of 1 second,
- Type of fluid: Air,
- Type of flow: Laminar & Turbulent,
- Wall Condition: Adiabatic Wall with 0 micro-meter roughness,
- Initial Condition: Pressure (101325 Pa), Temperature (293.2K), Velocity x-direction (600 m/s),
- Global goals and surface goals were given for forces in x and y directions. A local mesh was inserted for the top surface of airfoil for a much refinement around it.
- Simulation Results :
- For `0⁰` angle of attack -
Drag Force – Surface Goal Force (X)
Lift Force – Surface Goal Force (Y)
- Velocity Contour - In order to generate a contour, a cut plot was made in the front plane parallel to the cross-section of the airfoil and at the mid length.
- Pressure Contour - In order to generate a contour, a cut plot was made in the front plane parallel to the cross-section of the airfoil and at the mid length.
- For `2⁰` angle of attack -
Drag Force – Surface Goal Force (X)
Lift Force – Surface Goal Force (Y)
- Velocity Contour - In order to generate a contour, a cut plot was made in the front plane parallel to the cross-section of the airfoil and at the mid length.
- Pressure Contour - In order to generate a contour, a cut plot was made in the front plane parallel to the cross-section of the airfoil and at the mid length.
- For `4⁰` angle of attack -
Drag Force – Surface Goal Force (X)
Lift Force – Surface Goal Force (Y)
- Velocity Contour - In order to generate a contour, a cut plot was made in the front plane parallel to the cross-section of the airfoil and at the mid length.
- Pressure Contour - In order to generate a contour, a cut plot was made in the front plane parallel to the cross-section of the airfoil and at the mid length.
- For `6⁰` angle of attack -
Drag Force – Surface Goal Force (X)
Lift Force – Surface Goal Force (Y)
- Velocity Contour - In order to generate a contour, a cut plot was made in the front plane parallel to the cross-section of the airfoil and at the mid length.
- Pressure Contour - In order to generate a contour, a cut plot was made in the front plane parallel to the cross-section of the airfoil and at the mid length.
- For `8⁰` angle of attack -
Drag Force – Surface Goal Force (X)
Lift Force – Surface Goal Force (Y)
- Velocity Contour - In order to generate a contour, a cut plot was made in the front plane parallel to the cross-section of the airfoil and at the mid length.
- Pressure Contour - In order to generate a contour, a cut plot was made in the front plane parallel to the cross-section of the airfoil and at the mid length.
- For `10⁰` angle of attack -
Drag Force – Surface Goal Force (X)
Lift Force – Surface Goal Force (Y)
- Velocity Contour - In order to generate a contour, a cut plot was made in the front plane parallel to the cross-section of the airfoil and at the mid length.
- Pressure Contour - In order to generate a contour, a cut plot was made in the front plane parallel to the cross-section of the airfoil and at the mid length.
CONCLUSIONS :
| Angle of attack (degrees) | Average Drag Force (N) | Average Lift Force (N) | Maximum Velocity (m/sec) | Minimum Velocity (m/sec) | Maximum Pressure (Pa) | Minimum Pressure (Pa) |
| 0 | 150.551187010265 | -0.0133613331935715 | 626.29 | 0 | 465774.39 | 76314.06 |
| 2 | 166.663950596008 | 416.294882013918 | 647.35 | 0 | 564401.54 | 69029.90 |
| 4 | 207.157428288354 | 821.358145369852 | 654.16 | 0 | 511131.21 | 64946.28 |
| 6 | 275.846241139197 | 1224.95123743898 | 668.95 | 0 | 574147.36 | 59018.80 |
| 8 | 377.200757572 | 1621.27586891698 | 680.22 | 0 | 625285.54 | 53017.57 |
| 10 | 498.883526961526 | 2026.31305034282 | 694.80 | 0 | 467914.04 | 45924.07 |
- As angle of attack increases from, the drag forces and lift forces increases simultaneously and stalling conditions is not achived yet. In fluid dynamics, a stall is a reduction in the lift coefficient generated by a foil as angle of attack increases. This occurs when the critical angle of attack of the foil is exceeded.
- In the first case, the value of average lift force is neagtive because for an airfoil to generate lift, the velocity must be higher on the top side than the lower side. This will mean higher pressure at the bottom and lower pressure at the top thereby generating lift. While tracing a particle, based on mass conservation, the time taken for the particle to traverse the top region has to be the same time as it takes to traverse the bottom region. So, this means that the velocity will be the same since the areas are the same and hence, so will the pressure above and below.The system is in aerodynamic equilibrium and hence has zero lift.
- As angle of attack increases the velocity profile and pressure distribution above the airfoil increases as compared to lower face of airfoil.
REFERNCES :