Flow over Bicycle Program in Matlab
Aim: To create a program for calculating the Drag Force for the provided inputs and plot the following graphs
1.Velocity vs Drag Force 2. Drag.Coefficient vs Drag Force.
About Drag Force: A drag force is the resistance force that acts opposite to the direction of the oncoming flow velocity.
Drag force is reactive because it only exists when the object is moving and it points in the opposite direction
to the object's motion.
Examples:
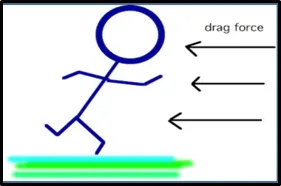
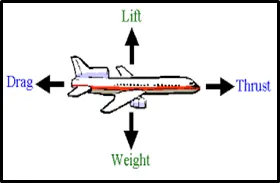
FIG:1 Drag Force on a person while running FIG:2 Drag Force on Air Plane
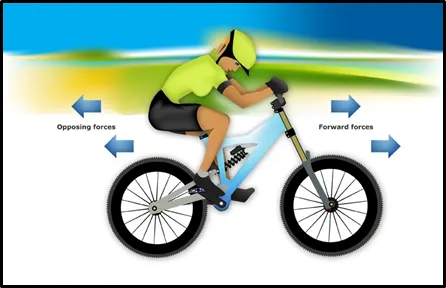
FIG:3 Drag Force on the cyclist
Program 1: Drag Force calculations against the cyclist and plotting the Velocity vs Drag Force Graph.
% Drag Force Calculation against a Cyclist.

% For Plotting Velocity vs Drag Force graph

clear all
close all
clc
%Inputs

%Drag Coefficient (c_d)
c_d=0.5

%Area m^2
A=0.4

%Density kg/m^3
rho=1.2

% velocity m/s
v=[2:2:20];

%Drag Force(F_d)
F_d=rho*v.^2*A*c_d*0.5;

plot(v,F_d)
xlabel('Velocity')
ylabel('Drag Force')
grid on
Result Graph:
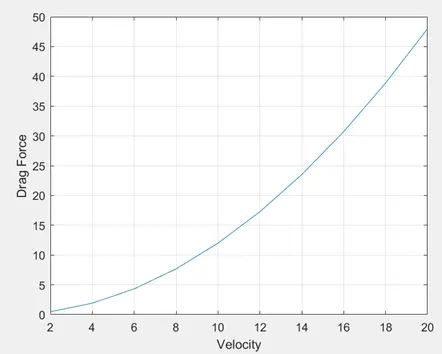
FIG:4 Velocity vs Drag Force
Program 2: Drag Force calculations against the cyclist and plotting the Drag coefficient vs Drag Force Graph.
% Drag Force Calculation against a Cyclist.

% For Plotting Drag coefficent vs Drag Force graph

clear all
close all
clc
%Inputs

%Drag Coefficient (c_d)
c_d=[0.1:0.1:0.9]

%Area m^2
A=0.4

%Density kg/m^3
rho=1.2

% velocity m/s
v=4

%Drag Force(F_d)
F_d=rho*v^2*A*c_d.*0.5;

plot(c_d,F_d)
xlabel('Drag Coefficent')
ylabel('Drag Force')
grid on
Result Graph:
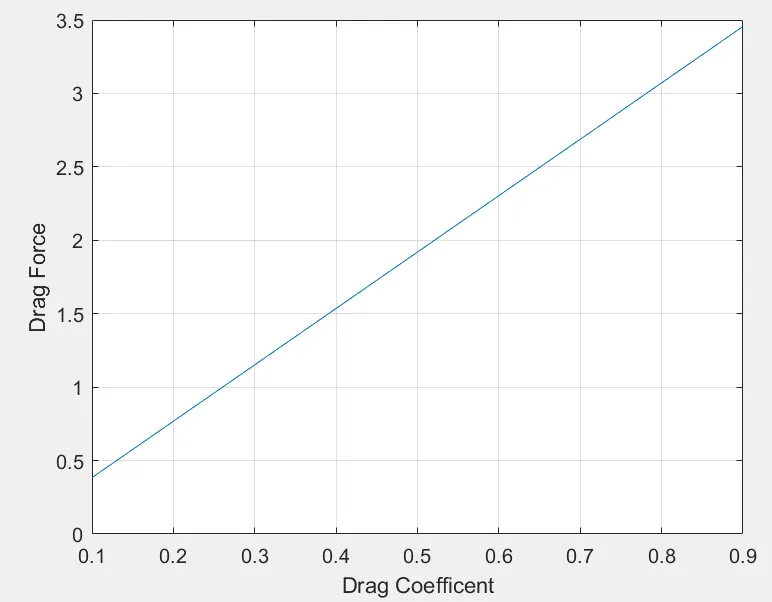
Conclusion: Thus we can say that (From graph 1) there has been a gradual increase in the drag force as we increase the velocity and the from the linear graph (graph 2) also there has been increase in the drag force value with increase in the drag coefficient