Flow over an airfoil
Flow over an Air foil
Aim
To perform an external flow simulation on a NACA0017 airfoil and compare the drag and lift force for every angle of attack at 0,2,4,6,8,10 deg.
Objective
- Download the NACA0017 file from the airfoil database and insert it into the solidworks curves with proper coordinate text.
- Model the curve.
- Perform the simulation and analyse the drag and lift force for every angle of attack from 0 to 10 degree with interval of 2.
- Compare the different cases of plots of Velocity and pressure.
Introduction
NACA stands for National Advisory Committee for Aeronautics. The NACA airfoils are used to design aircraft wings, which consists of a series of numbers. The first digit describes maximum camber as a percentage of chord. The second digit describes the distance of maximum camber from airfoil leading edge intents of chord. The last two digits gives the maximum thickness of the airfoil as percent of chord.
Parameters:
- Flow Simulation = External
- Pressure = 101325 Pa
- Temperature = 293.2 K
- Velocity along x-axis = 600 m/s
- Medium = Air
- Time dependent study
Steps:
- Insert the NACA airfoil .txt file from the airfoil database provided.
- Sketch the airfoil by connecting the ends
- Extrude the airfoil and save it.
- Activate the flow simulation and add the parameters in the wizard command.
- Select 2D computational domain and increase the domain size
- Edit the global mesh into fine mesh and local mesh at the face of the curve for refinement.
- Set surface goals to get the drag and lift force.
- Run the simulation
- Insert plots of pressure and velocity
- Insert goals from results to get drag and lift force results.
Results:
Here the SG(X) represents the surface goal at x axis i.e drag force
Here the SG(Y) represents the surface goal at y axis i.e lift force
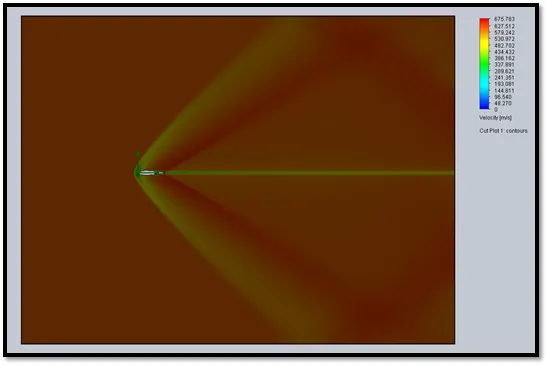
Velocity plot at 0 degree angle of attack
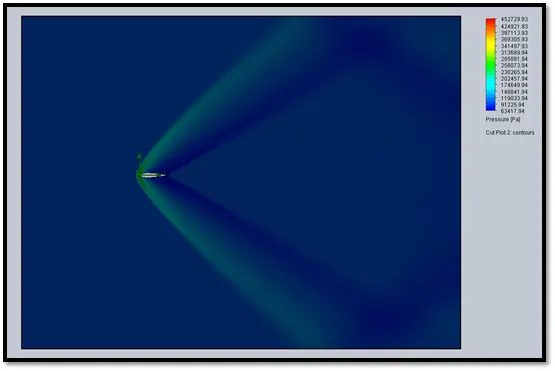
Pressure plot at 0 degree at angle of attack
Drag force and lift force at 0 degree

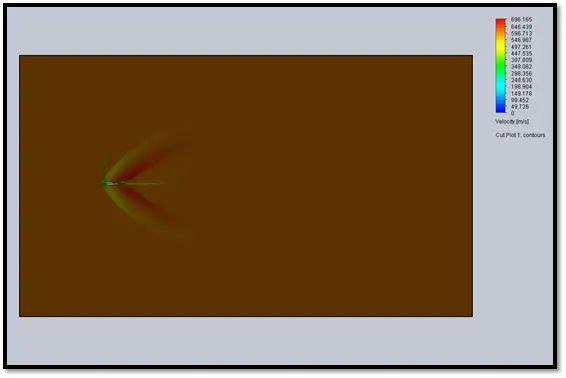
Velocity plot at 2 degree angle of attack
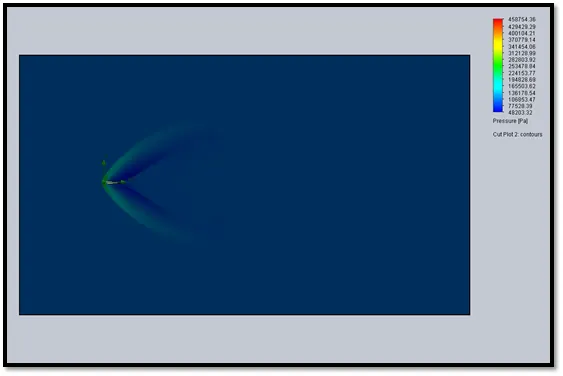
Pressure plot at 2 degree at angle of attack
Drag force and lift force at 2 degree

Velocity plot at 4 degree angle of attack
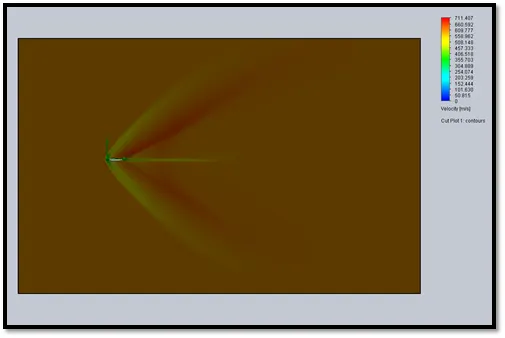
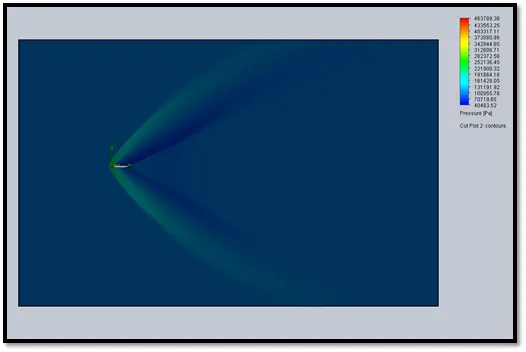
Pressure plot at 4 degree at angle of attack
Drag force and lift force at 4 degree

Velocity plot at 6 degree angle of attack
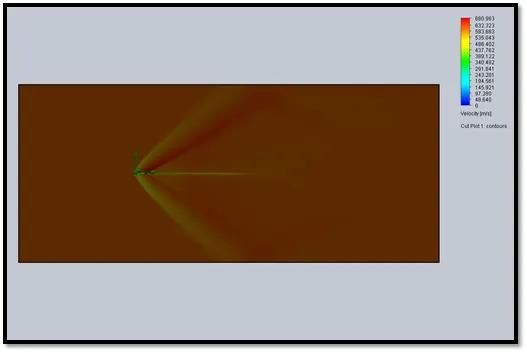
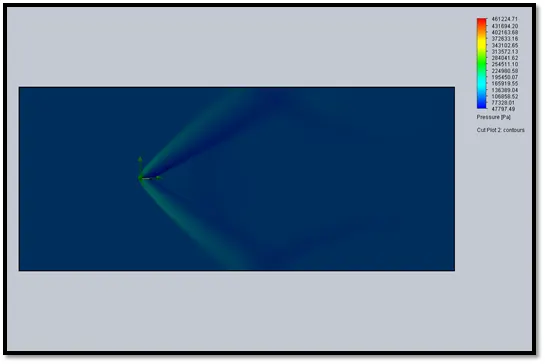
Pressure plot at 6 degree at angle of attack
Drag force and lift force at 6 degree

Velocity plot at 8 degree angle of attack
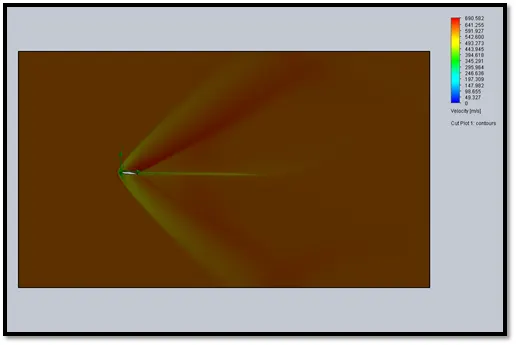
Pressure plot at 8 degree at angle of attack
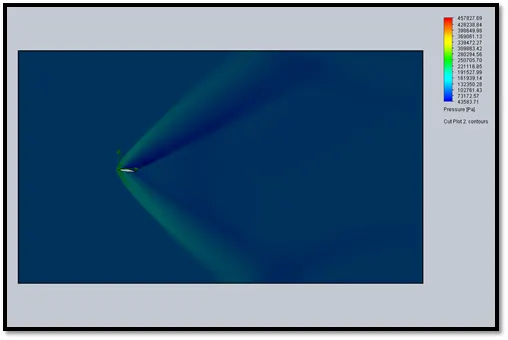
Drag force and lift force at 8 degree

Velocity plot at 10 degree angle of attack
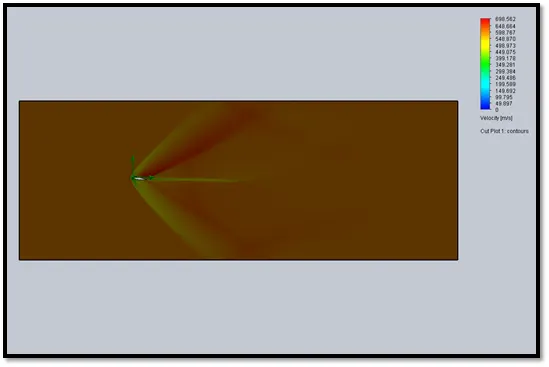
Pressure plot at 10 degree at angle of attack
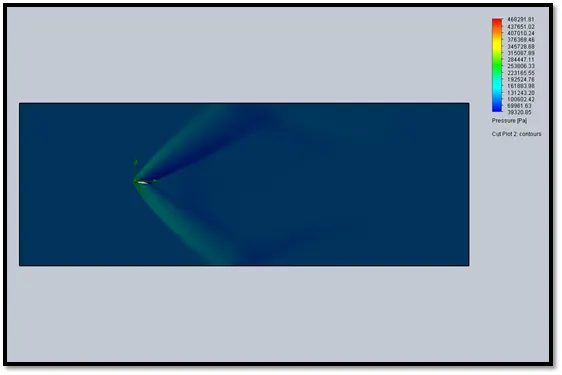
Drag force and lift force at 10 degree

Conclusion
- At zero degree angle of attack the lift is found to be zero due to symmetry of airfoil.
- Also there is symmetry found in velocity and pressure plot at 0 deg angle of attack.
- As the angle of attack increses the lift force also increases and the size of wake region al so increases.
- The blue light increses below the airfoil in the pressure plot as angle of attack is increased as pressure increases in that region.
- Similarly as the velocity flows over the airfoil more than the lower region the pressure under it decreases this creates suction and causes lift.