FINAL TEST
PFI Engine
the Compression ratio for the engine
The compression ratio is defined as the ratio between the volume of the cylinder with the piston in the bottom position, `V_2` (largest volume), and in the top position, `V_1` (smallest volume). The higher this ratio, the greater will be the power output from a given engine.
`CR=(V_d+V_c)/V_c`
CR- compression ratio
`V_d`- Displacement volume
`V_c`- clearance volume
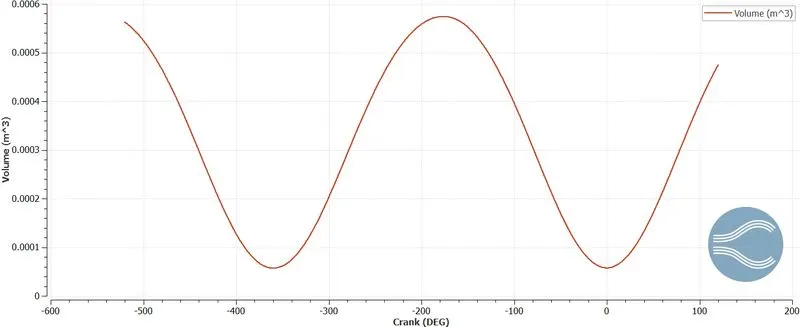
Typically, petrol engines have a CR of 8–10
`r=(MAXIMUM VOLUME)/(MINIMUM VOLUME)`
`V_min=5.754e-5m^3`
`V_max=0.0005754215m^3`
`r=(5.754e-5)/0.000575421`
`r=9.9754`
the compression ratio for this engine to 10.3 without changing geometrical parameters
`CR=(V_d+V_c)/V_c`
10.3=`(V_d+V_c)/V_c`
`V_d=0.0005754215-5.754e-5=0.000517882 m^3`
`V_c=5.754e-5`
`V_d+V_c=10.3V_c`
`V_d=10.3V_c-V_c=9.3V_c`
new clearance volume
`V_c=V_d/9.3`
`V_c=0.000517882/9.3=5.56862e-05 m^3`
changing clearance to 5.56862e-05 m^3 to reach compression ratio 10.3
new displacement volume
`V_d=10.3*V_c=10.3*5.754e-5=0.000592662 m^3`
changing displacement volume as 0.000592662 m^3 to reach compression ratio 10.3
for new changes fixed on is displacement for clearance
for new changes fixed on is clearance for displacement
`P_min/P_max=(V_max/V_min)^(gamma)`
`P_min/P_max=(9.9754)^(gamma)`
`P_min/P_max=25.03239753`
ether changing starting pressure atmosperic pressure or P2 maximum pressure we can get 10.3 compression ratio
Volumetric Efficiency for this engine.
It is the ratio of the volume of air/change drawn into the cylinder/s during the suction stroke to the total displacement of all the cylinder/s at the atmospheric pressure. In simple words, it denotes the engine’s ability to carry out the work efficiently. However, it depends upon the engine speed and load. It also largely depends upon the layout of the inlet and exhaust systems, sizes of the valve ports and valve timing.
volumetric effecncy (VE)`=(v_(actual)(v_a))/(v_(displacement)(v_d))`
vd=`v_(max)-v_(min)`
`V_d=0.0005754215-5.754e-5=0.000517882 m^3`
from Ideal gas equation PV=mRT
P=101325pa, T=300 R=287j/kgk
mass from graph=0.00054 kg
`v_a=(0.00054*287*300)/101325`
`v_a=0.00045886 m^3`
volumetric efficiency`=0.00045886/0.000517882=0.886033009=88.6%`
air mass flow rate for this engine in kg/s
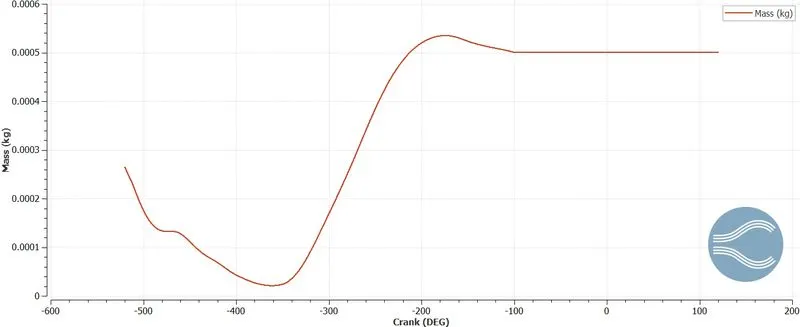
speed of engine=3000 rpm
4 stroke
number of revolutions per cycle=2
number of cycle per secound=1500/60=25
mass flow rate=0.00054*25=0.0135kg/s
the cell count varied during the simulation Due to the following reasons
while engine simulation the mesh grow and contract.
Due to Adaptive Mesh Refinement Technique to derivative of property like temperature, velocity gradient to
Subgrid =(base size)/2^(embed-Level)`
with time changes as a function so according to it gride size varies so increases in count
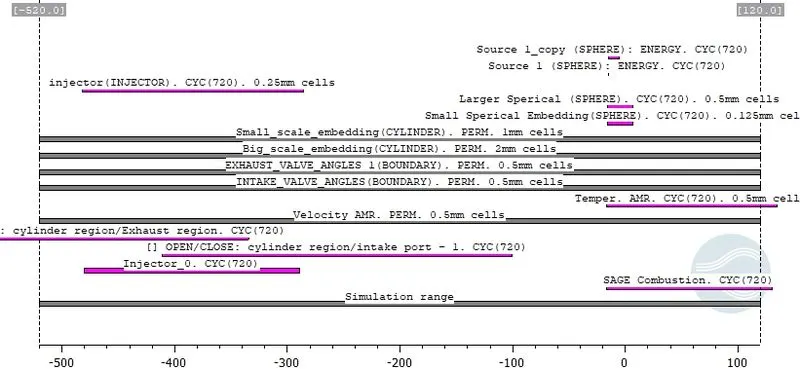
above timing scale clearly show when and where simulation takes place according to variation of simulation function variation the refinement starts so the number of mesh increases which affect computer power timing and expenceses
real engine, valves are in contact with the cylinder head but while running simulation,
In a real engine, valves in contact with the cylinder head the gap is closed to avoid the escape of fuel and heat dissipation control by cam mechanism.
In the simulation, we are inputting the mechanism profile for lifting which is needed to differentiate the Bc there is a small gap between the cylinder head and valve. during simulation converge automatically create disconnect triangle
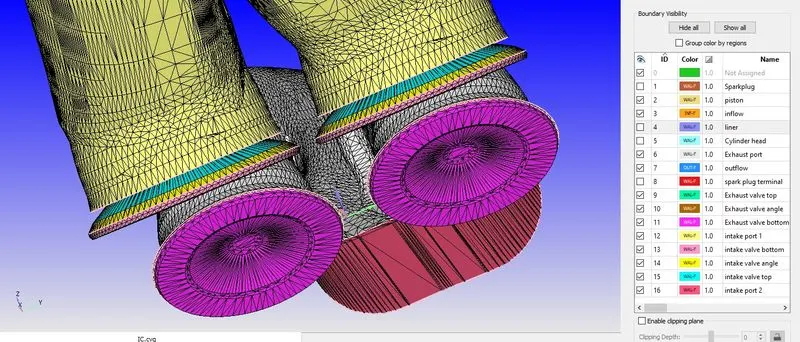
The above shows the gap which disconnects during simulation which is placed above the head
Gap is increase
If the gap is too big the valve close early and open later which reduce power, increase engine Knocks, increase exhaust pollution, reduce efficiency, heat dissipation between cylinder head and wall can't take place
seconds does combustion last in this case

combustion duration=240.199 degree
crank speed=3000 RPM=3000/60=50RPS
number of degrees per secound= 50*360=18000
Time for per degree=1/18000=5.55e-5
combustion duration=240.199*5.55e-5=0.0133 s
DIESEL Engine
Advantage of SECTOR Simulation
The symmetry in the model allowed for the geometry to be drawn and simulated as a group
of rectangular regions which could be rotated 360 degrees around a central axis to
create a 3-D simulation. This allowed the model to be solved using less time and
processing power than if it had been created with a 3-D geometry.
Like any other study, a cross-sectional study is only as good as the measurement processes which are implemented to collect information. Because there are zero long-term considerations involved with this type of study, researchers have better control over the ascertainment process. The data obtained in the study can be easily measured and applied to population groups because controls are easier to implement
the lower error rate is achieved within the data because there is a higher level of control involved
maximizes the investment value of the collected data points by doing various iterative design studies like open-w & omega and further bowl profile to choose best on it.
When will the sector approach not work
if the flow is not in the radial and the axial directions.
the flow of simulation is an open cycle
choose Start Crank Angle (SCA) and End Crank Angle (ECA) for a sector simulation
Diesel for section simulation, SCA is starting of simulation where volume is maximum and ECA is the ending of simulation clearance volume
Can we convert the PFI case into a SECTOR case
PFI is an open cycle system where intake and exhaust phases so we cannot convert into section simulation.
PFI
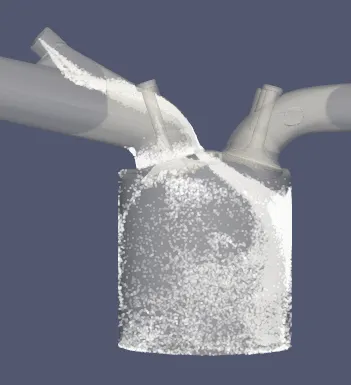
DIESEL
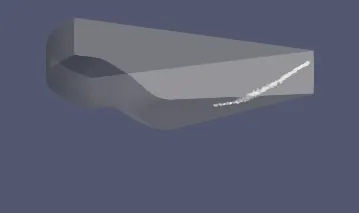
and In both fuel flow by visualizing there is no axis-symmetric and unsymmetric flow pattern so unrealistic result to radially.
Reference
https://shareok.org/bitstream/handle/11244/9667/Singh_okstate_0664M_1553.pdf?sequence=1
https://www.sciencedirect.com/topics/engineering/compression-ratio
Gratitude
Thank you for entire skill team to co-operate and timely response
Saiyan for entire support and guides in converge course