Final Project: Electric Rickshaw modelling
Create a detailed MATLAB model of an electric rickshaw (three wheel passenger vehicle) as per details below:
Rear wheels driven by PM brushed type motor
Assume efficiency points of motor controller and motor
Make an excel sheet of all input and assumed data
Results: For any three standard driving cycles show energy consumption, temperature rise of motor and controller for 100 km constant speed driving at 45 kmph.
(Note- The simulink model file should be compulsorily attached)
ANS:-
AIM:- To create a model of three wheeler rickshaw using matlab.
ABSTRACT:-
In this project we are building an model of e-rickshaw with the help of matlab simulink. which consist of PM BRUSHED TYPE MOTOR, LITHIUM ION BATTRY, powertrain blocksets,drive cycle,and vehicle body blocks .e-rickshaws. Auto rickshaws are small, three-wheeled
vehicles which are used extensively in many Asiancountries for transport of people and goods. In India,auto rickshaws are commonly used as they are not very expensive to operate. Despite the advantages in the vehicle design, auto rickshaws present a huge pollution problem in major Indian cities. This is because of the use of inefficient engine, a 2 or 4 stroke. These vehicles create more pollution as there is not such regulations on them and also a very large population of the country rely on these vehicles. . The existing vehicles are replaced by an all-electric components which are redesigned in a manner which will improve the efficiency of the vehicle. Thus looking at the existing
Vehicle and the environment in which it operates, we have createda model of electric vehicle.
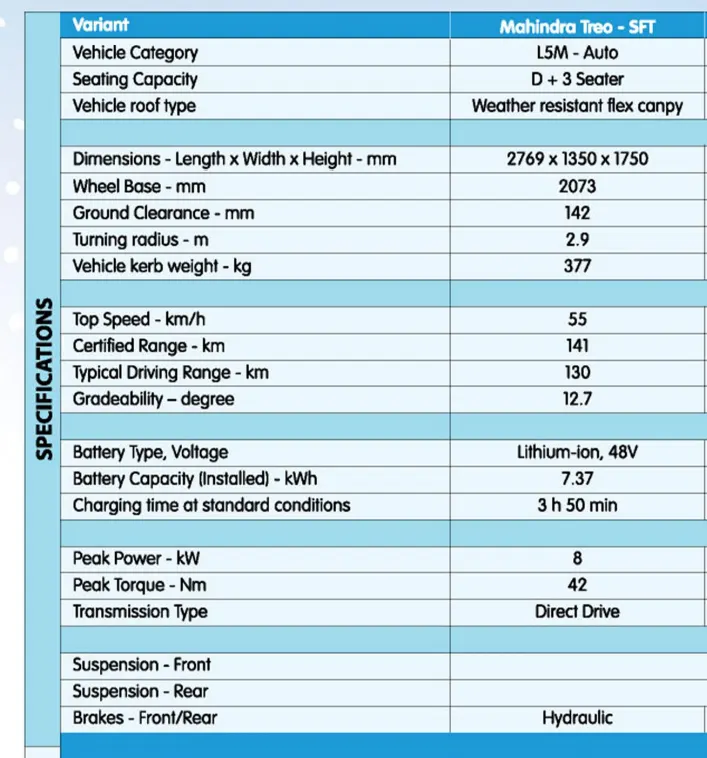
mahindra treo e rickshaw newly launched in market.
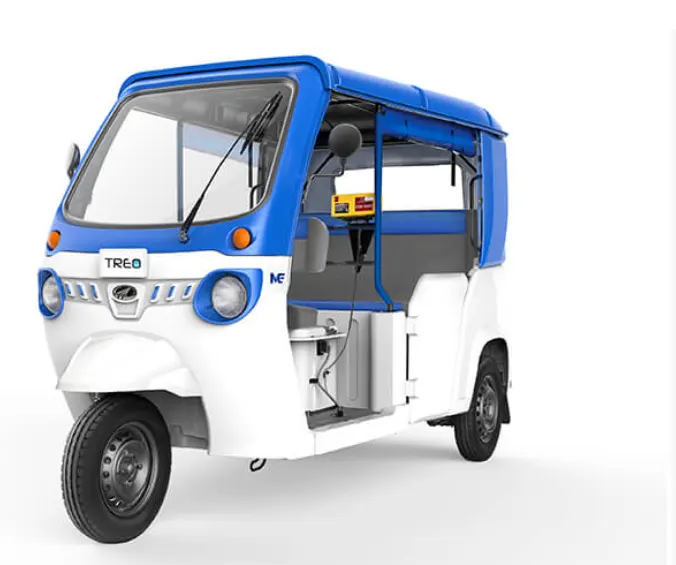
here we will analyse the actual e-rickshaw model considering the following parmeter:-
1.soc.
2.current supplied.
3. voltage.
4. energy consumed.
5. temperature rise.
6. speed of the vehicle.
OBJECTIVE:-
1. To observe performance parameter (listed above)
2. simulating three driving cycle.
3. simulating the model to cover the 100 km distance with the speed of 45 km/h
4. identifying amount of power required for propulsion.
DESIGN FLOW OF E-RICKSHAW:-
1. Identifying amount of propulsion power required.
2. selecting suitable motor for propulsion
3. selecting battery capacity and its range
CONSTRUCTION OF A MODEL:-
The prediction of range of a vehicle is important concept for design of vehicle. In order to determine the performance of vehicle, the important parameter to be focused on is acceleration on top seed where the vehicles always have poor response. it is also mandatory to predict the range of vehicle. Now we see the simulation of the electric vehicle model to calculate the distance traveled by the vehicle. Also compare with the actual vehicle and drive cycle.
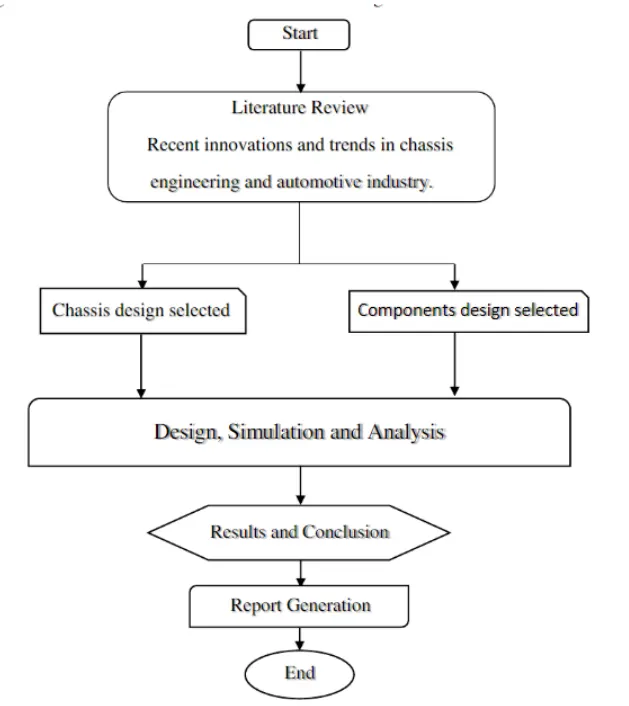
FLOW OF CONSTRUCTION IS SHOWN FOLLOWING FIGURE:-
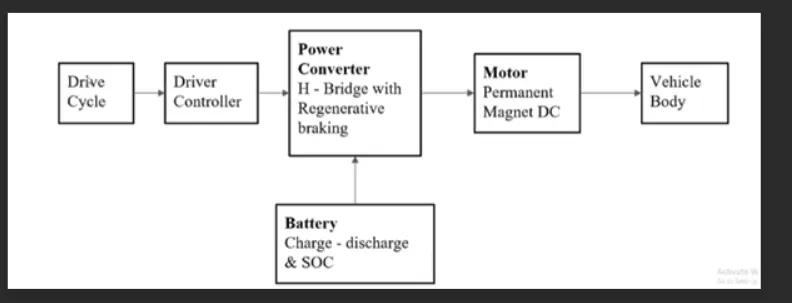
BLOCK DIAGRAM OF VEHICLE DESIGN:-
BASIC DESIGN AND CONSTRUCTION OF E- RICKSHAW:-
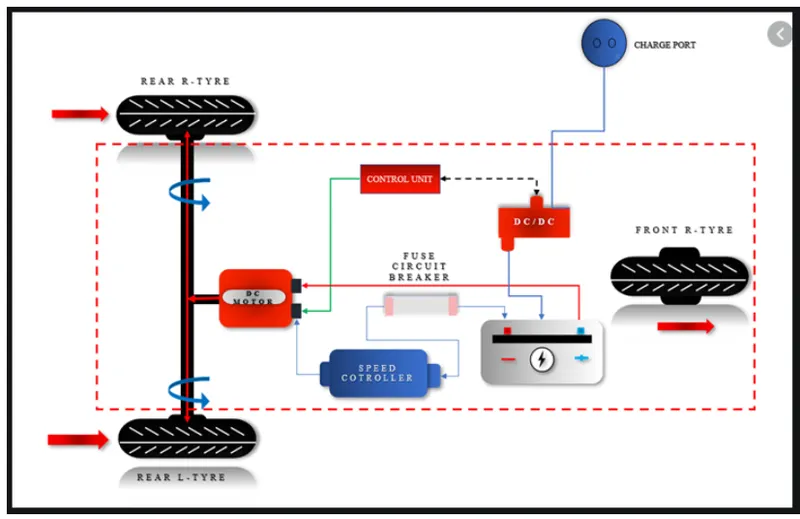
DESIGN OF VEHICLE CONSIST FIVE MAIN PARTS LISTED BELOW:
1.VEHICLE BODY AND WHEELS.
2. MOTOR AND TRANSMISSION.
3. CONTROLLER.
4. BATTERY SYSTEM.
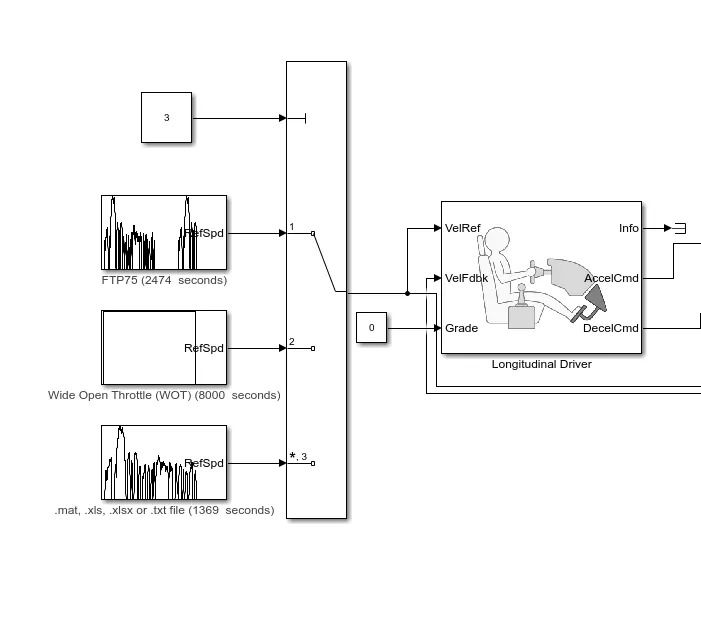
5. THROTTLE INPUT / DRIVE CYCLE.
DATASHEET IS REFERED OF NEW MAHINDRA TRIO SHOWN BELOW
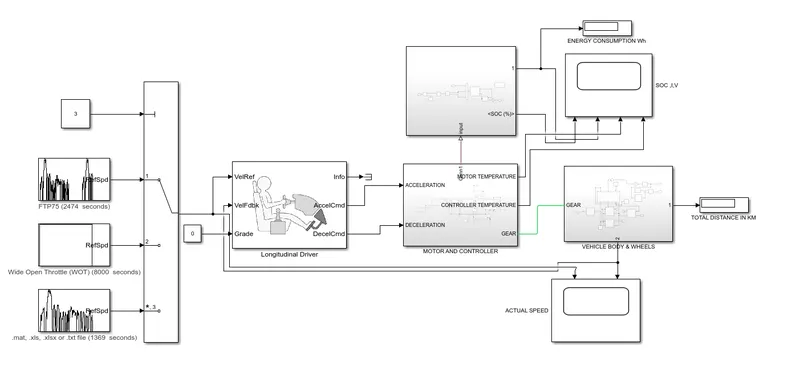
E-RICKSHAW SIMULINK MODEL :-
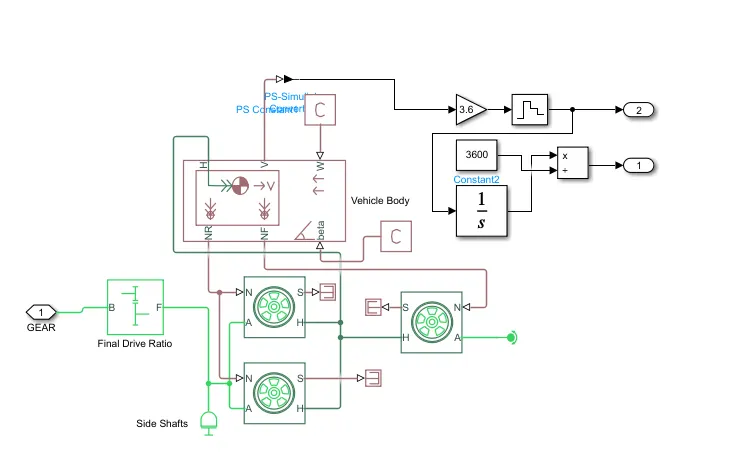
1.VEHICLE BODY AND WHEELS.
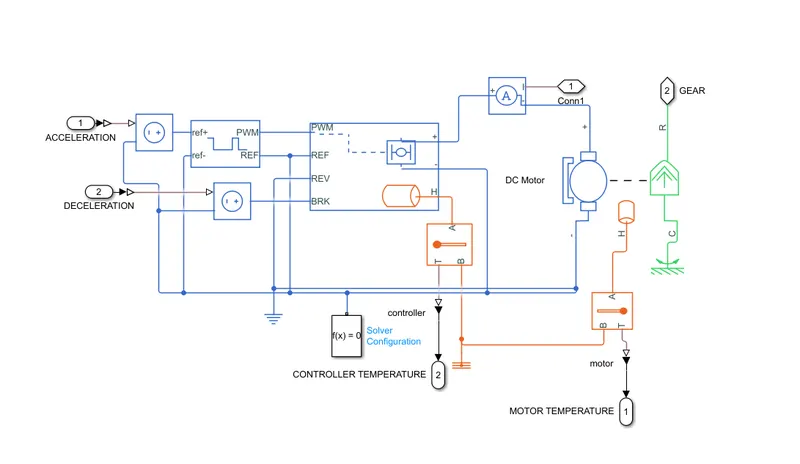
2. MOTOR AND TRANSMISSION.
3. CONTROLLER.
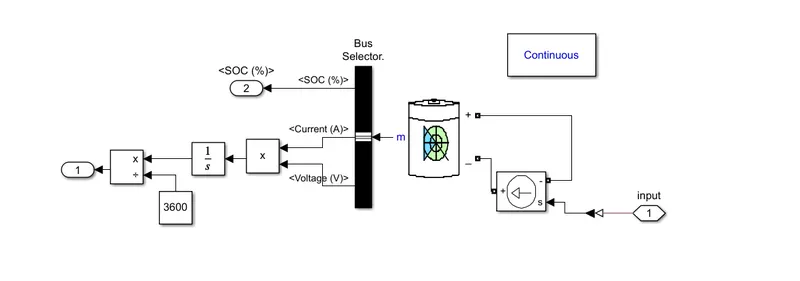
4. BATTERY SYSTEM.
5. THROTTLE INPUT / DRIVE CYCLE.
A] VEHICLE BODY SUBSYSTEM:-
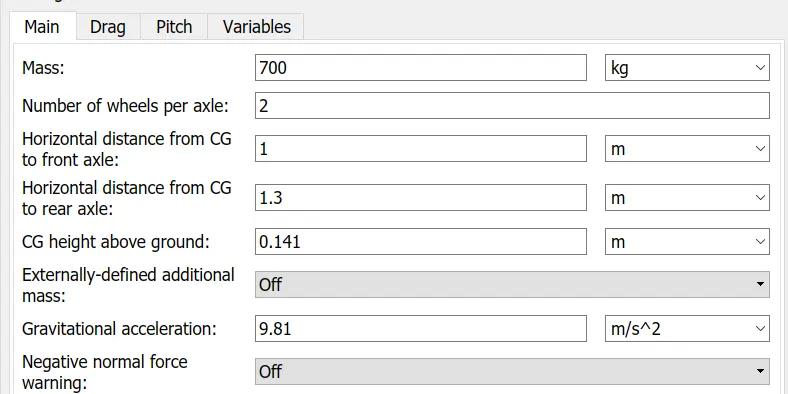
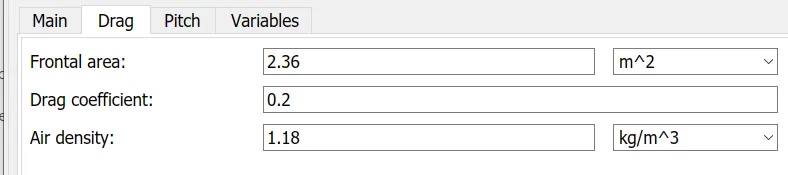
1) VEHICLE BODY:-
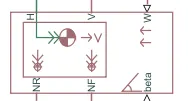
- The Vehicle Bodyblock represents a two-axle vehicle body in longitudinal motion. The vehicle can have the same or a different number of wheels on each axle.
- For example, two wheels on the front axle and one wheel on the rear axle. The vehicle wheels are assumed identical in size.
- The vehicle can also have a centre of gravity (CG) that is at or below the plane of travel.
- The block accounts for body mass, aerodynamic drag, road incline, and weight distribution between axles due to acceleration and road profile.
- Optionally include pitch and suspension dynamics. The vehicle does not move vertically relative to the ground.
- The block has an option to include an externally-defined mass and an externally-defined inertia.
- The mass, inertia, and centre of gravity of the vehicle body can vary over the course of simulation in response to system changes.
2) TIRE BLOCK:-
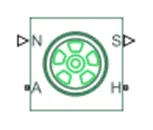
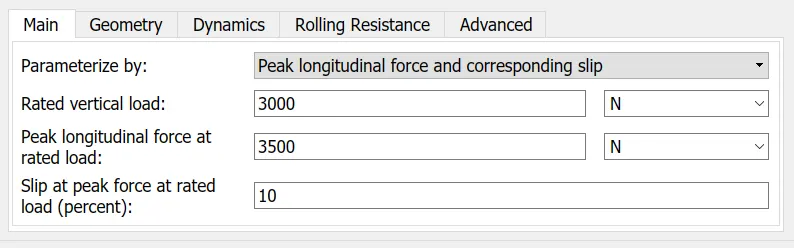
- The Tire (Magic Formula) block models a tire with longitudinal behavior given by the Magic Formula [1], an empirical equation based on four fitting coefficients.
- The block can model tire dynamics under constant or variable pavement conditions.
- The longitudinal direction of the tire is the same as its direction of motion as it rolls on pavement. This block is a structural component based on the Tire-Road Interaction (Magic Formula)
- To increase the fidelity of the tire model, you can specify properties such as tire compliance, inertia, and rolling resistance. However, these properties increase the complexity of the tire model and can slow down simulation.
- Consider ignoring tire compliance and inertia if simulating the model in real time or if preparing the model for hardware-in-the-loop (HIL) simulation.
Model
- The vehicle axles are parallel and form a plane. The longitudinal, x, direction lies in this plane and perpendicular to the axles. If the vehicle is traveling on an incline slope, β, the normal, z, direction is not parallel to gravity but is always perpendicular to the axle-longitudinal plane.
3) SIMPLE GEAR BLOCK:-
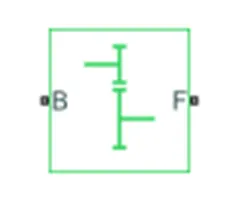
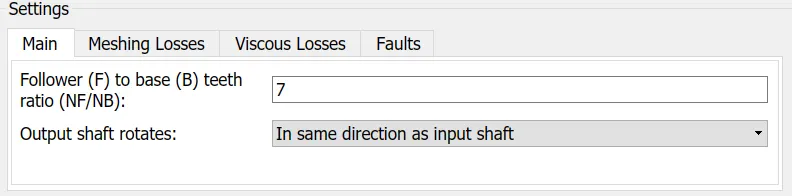
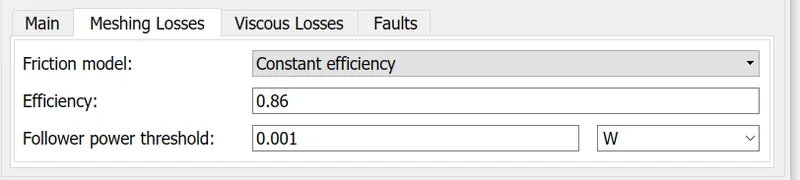
- The Simple Gearblock represents a gearbox that constrains the connected driveline axes of the base gear, B, and the follower gear, F, to corotate with a fixed ratio that you specify.
- You choose whether the follower axis rotates in the same or opposite direction as the base axis.
- If they rotate in the same direction, the angular velocity of the follower, ωF, and the angular velocity of the base, ωB, have the same sign. If they rotate in opposite directions, ωFand ωBhave opposite signs
 .
.
B] POWER CONTROLLER BLOCKS:-
1) CONTROLLED PWM VOLTAGE:-
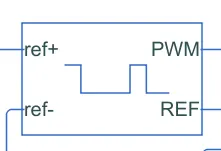
- The Controlled PWM Voltage block represents a pulse-width modulated (PWM) voltage source.
- The block has two modelling variants, accessible by right-clicking the block in your block diagram and then selecting the appropriate option from the context menu, under Simscape> Block choices:
- Electrical input ports— The block calculates the duty cycle based on the reference voltage across its ref+ and ref- This modelling variant is the default.
- PS input— Specify the duty cycle value directly by using an input physical signal port.
For the Electrical input ports variant of the block,
- The value of the Output voltage amplitudeparameter determines amplitude of the output voltage.
- At time zero, the pulse is initialized as high, unless the Pulse delay timeparameter is greater than zero, or the demanded duty cycle is zero.
- You can use parameters Pulse delay timeand Pulse width offsetto add a small turn-on delay and a small turn-off advance. This can be useful when fine-tuning switching times so as to minimize switching losses
- No changes made in the PWM block parameter
- Input voltage for 100% duty is 2V and output voltage amplitude is 48V



2) H-Bridge:-
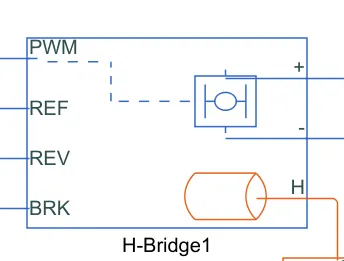
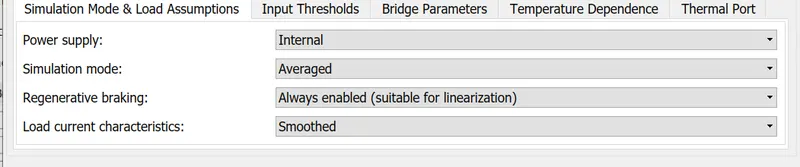
- This block represents an H-bridge motor drive.
- The block can be driven by the Controlled PWM Voltage block in PWM or Averaged mode.
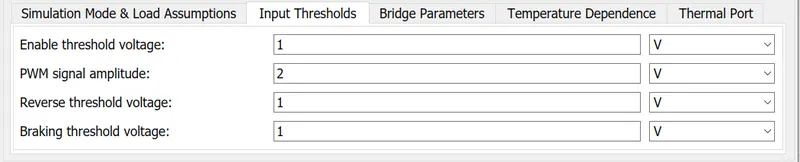
- In PWM mode, the motor is powered if the PWM port voltage is above the Enable threshold voltage.
- In Averaged mode, the PWM port voltage divided by the PWM signal amplitude parameter defines the ratio of the on-time to the PWM period.
- Using this ratio and assumptions about the load, the block applies an average voltage to the load that achieves the correct average load current.
- The Simulation mode parameter value must be the same for the Controlled PWM Voltage and H-Bridge blocks.
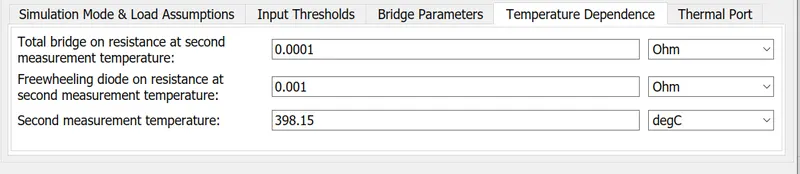
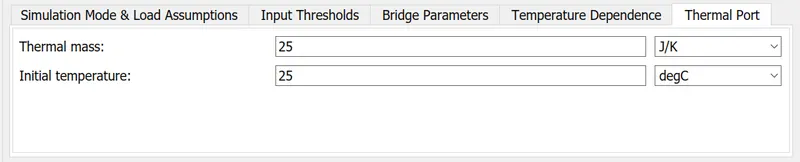
- Thermal port is also enabled to measure temperature induced in this block

- If the REV port voltage is greater than the Reverse threshold voltage, then the output voltage polarity is reversed.
- If the BRK port voltage is greater than the Braking threshold voltage, then the output terminals are short circuited via one bridge arm in series with the parallel combination of a second bridge arm and a freewheeling diode.
- Voltages at ports PWM, REV and BRK are defined relative to the REF port.
- Input threshold voltage is 1 v
- Reverse threshold voltage is 1 v
C) DC MOTOR:-
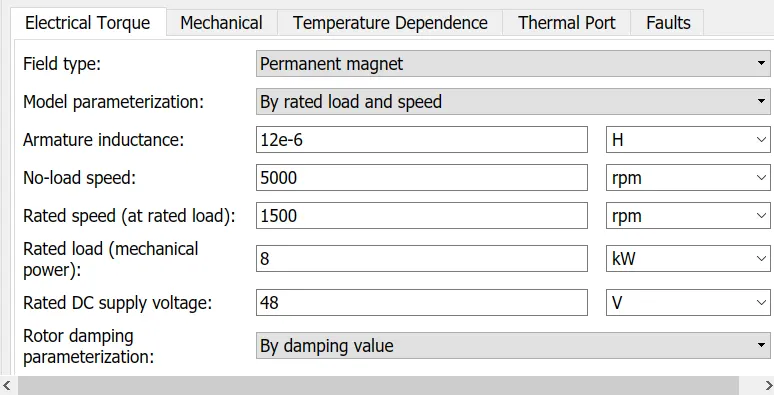
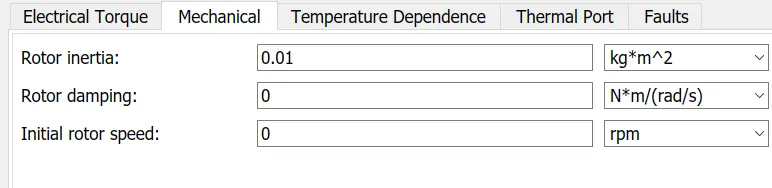
- This block represents the electrical and torque characteristics of a DC motor.
- The block assumes that no electromagnetic energy is lost, and hence the back-emf and torque constants have the same numerical value when in SI units. Motor parameters can either be specified directly, or derived from no-load speed and stall torque.
- If no information is available on armature inductance, this parameter can be set to some small non-zero value.
- When a positive current flows from the electrical + to - ports, a positive torque acts from the mechanical C to R ports.
- Motor torque direction can be changed by altering the sign of the back-emf or torque constants.
- thermal port added to measure temperature rise in the motor.


C] LONGITUDINAL DRIVER:-
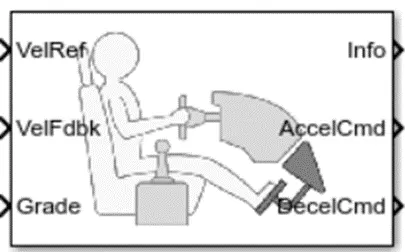
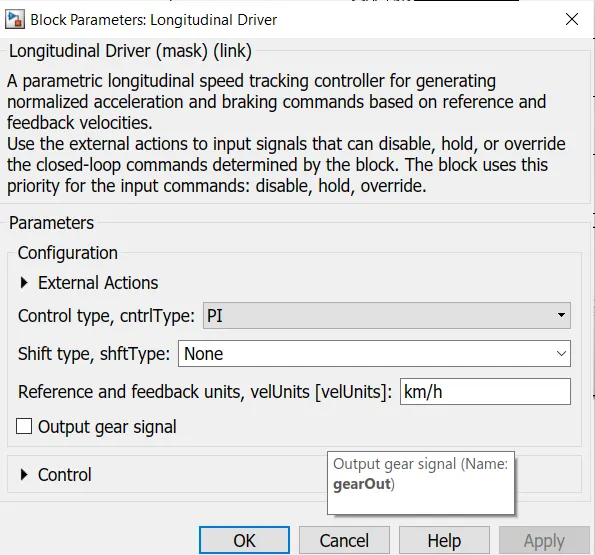
- The Longitudinal Driverblock implements a longitudinal speed-tracking controller.
- Based on reference and feedback velocities, the block generates normalized acceleration and braking commands that can vary from 0 through 1.
- You can use the block to model the dynamic response of a driver or to generate the commands necessary to track a longitudinal drive cycle
- Use the External Actionsparameters to create input ports for signals that can disable, hold, or override the closed-loop acceleration or deceleration commands.
- The block uses this priority order for the input commands: disable (highest), hold, override
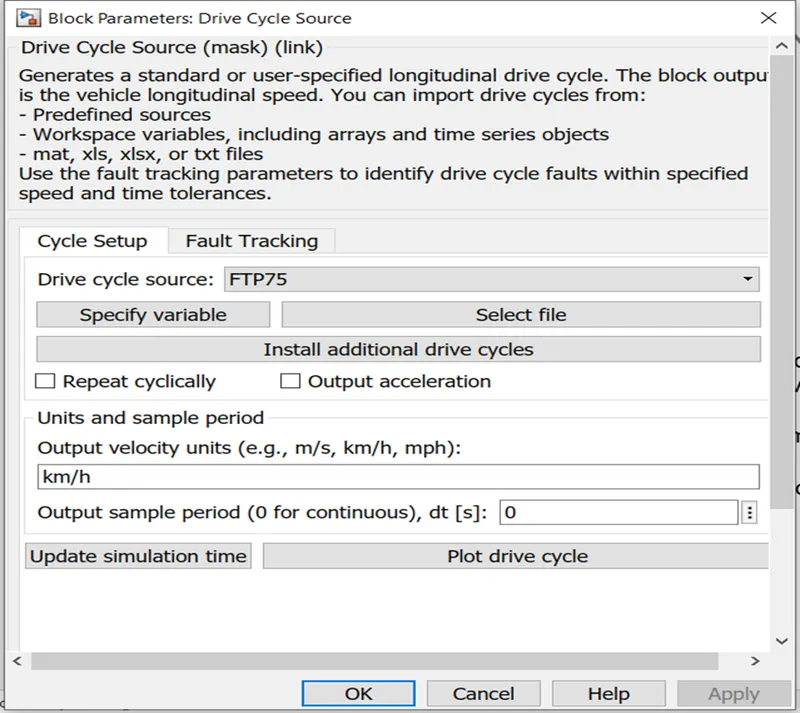
D] DRIVE CYCLE SOURCE:-
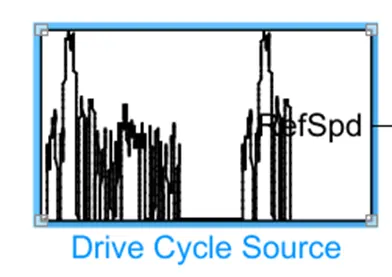
- Generates a standard or user-specified longitudinal drive cycle. The block output is the vehicle longitudinal speed. You can import drive cycles from:
- Predefined sources
- Workspace variables, including arrays and time series objects
- mat, xls, xlsx, or txt files
- Use the fault tracking parameters to identify drive cycle faults within specified speed and time tolerances.
- .
F] CONTROLLED VOLTAGE SOURCE:-
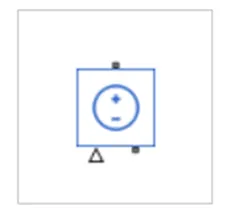
- This is the simscape model which is driven by the input signal
The Controlled Voltage Sourceblock represents an ideal voltage source that is powerful enough to maintain the specified voltage at its output regardless of the current flowing through the source. - The output voltage is V = Vs, where Vsis the numerical value presented at the physical signal port.
- The block has one physical signal input port and two electrical conserving ports associated with its electrical terminals
G] Controlled Current Source:-
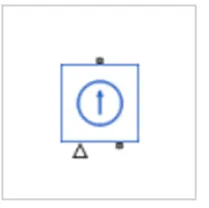
- The Controlled Current Sourceblock represents an ideal current source that is powerful enough to maintain the specified current through it regardless of the voltage across the source.
- The output current is I = Is, where Isis the numerical value presented at the physical signal port.
- The positive direction of the current flow is indicated by the arrow.
- The block has one physical signal input port and two electrical conserving ports associated with its electrical terminals.
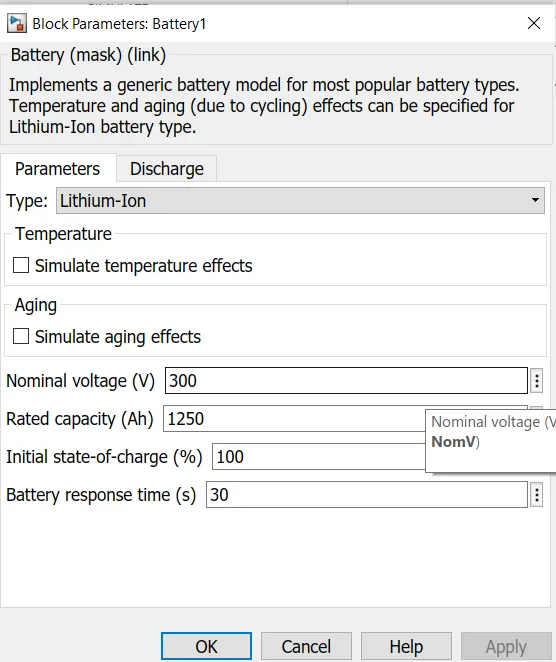
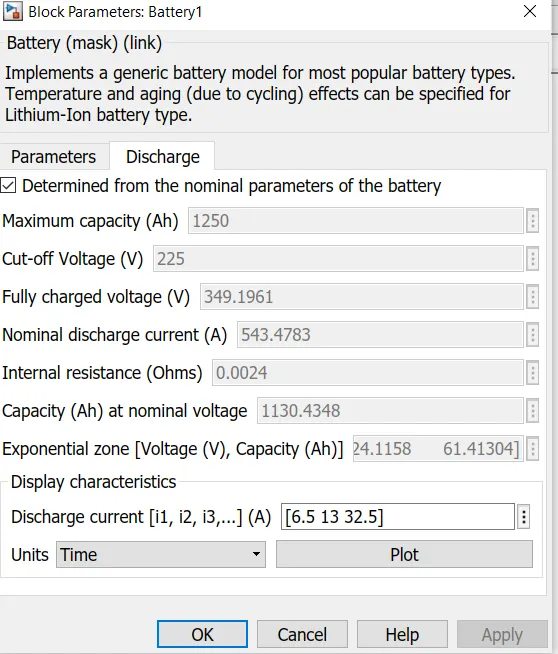
GENERIC BATTERY MODEL:-
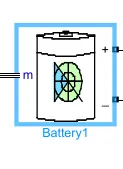
Implements a generic battery model for most popular battery types. Temperature and aging (due to cycling) effects can be specified for Lithium-Ion battery type.
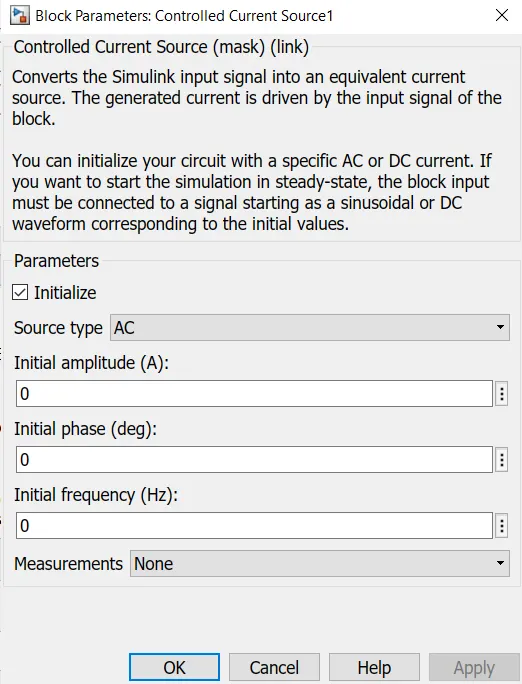
CONTROLLED CURRENT SOURCE IN SIMSCAPE MODEL:-
Converts the Simulink input signal into an equivalent current source. The generated current is driven by the input signal of the block.You can initialize your circuit with a specific AC or DC current. If you want to start the simulation in steady-state, the block input must be connected to a signal starting as a sinusoidal or DC waveform corresponding to the initial values.
TEMPERATURE SENSOR:-
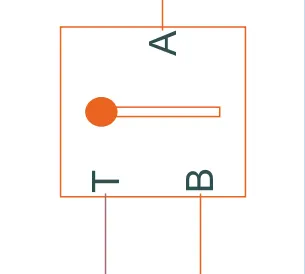
This block measures temperature in a thermal network. There is no heat flow through the sensor. The physical signal port T reports the temperature difference across the sensor. The measurement is positive when the temperature at port A is greater than the temperature at port B.
ANALYSING RESULTS OBTAINED FROM THREE DIFFERENT DRIVE CYCLE:-
1. FTP74 DRIVE CYCLE.(2474 SEC.).
2. UDDS DRIVE CYCLE(1369 SEC).
3. WOT (45 kmph constant cover 100 km distance)
1. FTP74 DRIVE CYCLE.(2474 SEC.).
i. speed profile of FTP74:-
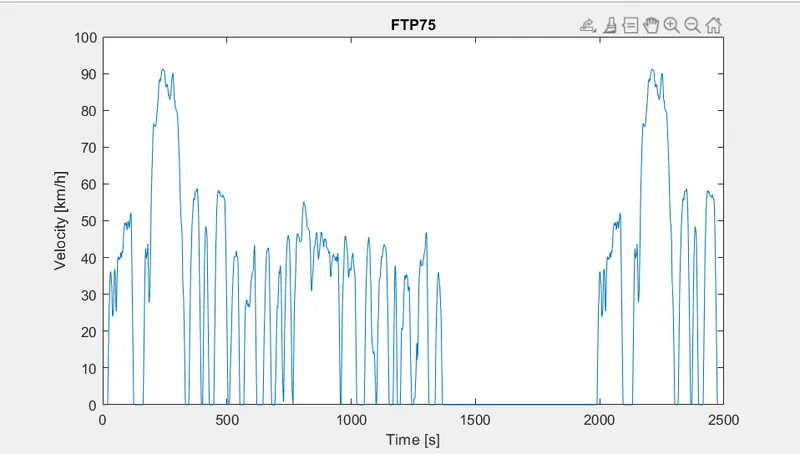
- default drive cycle used for simulation.
ii. actual speed of vehicle and drive cycle:-
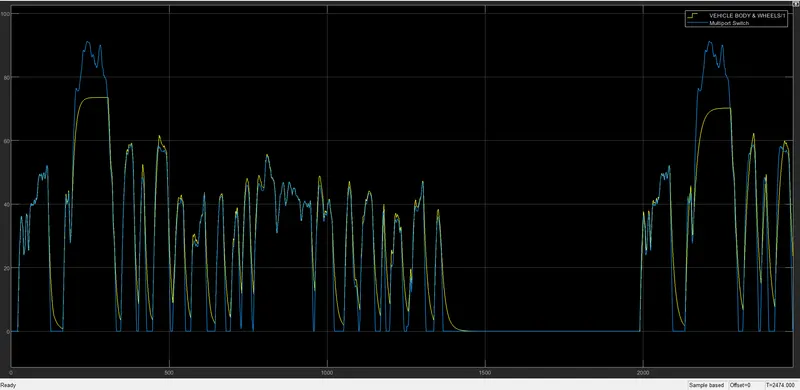
- from the above graph :
- acual speed of vehicle is following the input drive cycle.
- maximum speed gained by vehicle is 73.56 km/h as per the capacity of vehicle.
- simulation found valid with the referd datasheet .
iii. soc,voltage,current profile
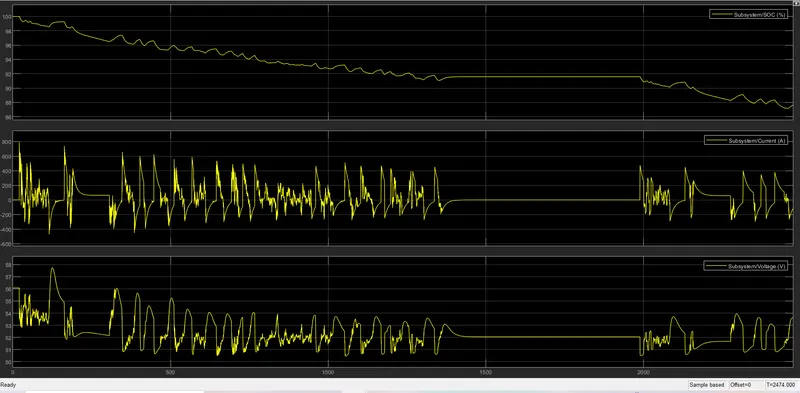
- from the above graph:-
- state of charge is reduced to 88 % to run vehicle for 2474 to cover the distance of 18.45 km.
- voltage and current is also controlled.
iv. temperature rise in motor and controller.
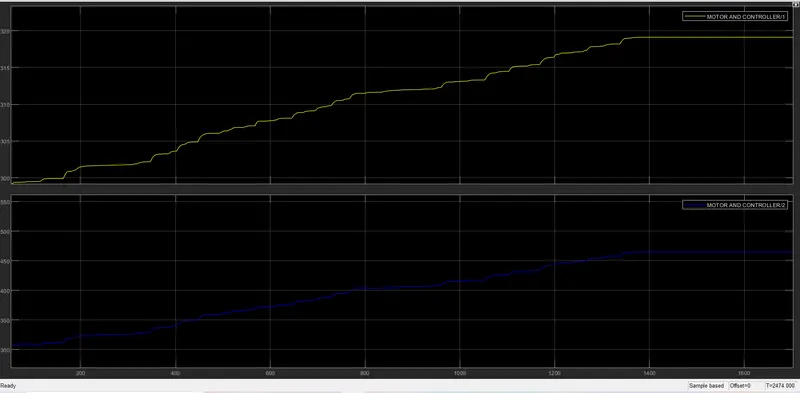
- temperature of controller is raised to 318 K as shown in yellow line
- temperature of motor is raised to 460 K. as shown in blue line.
v.Distance traveled in km
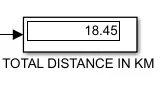
- vehicle traveled the distance of 18.45 km in 2474 seconds
vi. energy consumed.
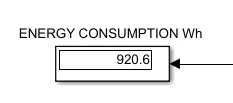
- energy consumed by battery is= 920.6 wh.
2. UDDS DRIVE CYCLE(1369 SEC).:-
i. speed profile of FTP74:-
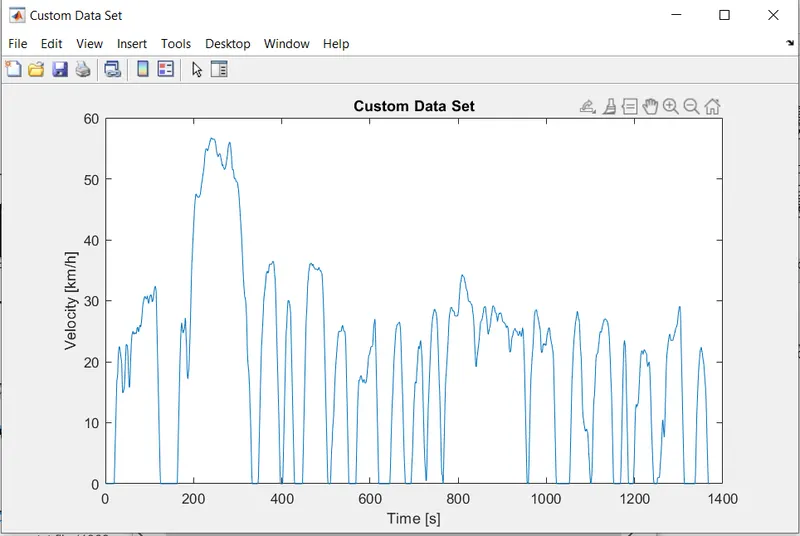
ii. actual speed of vehicle and drive cycle
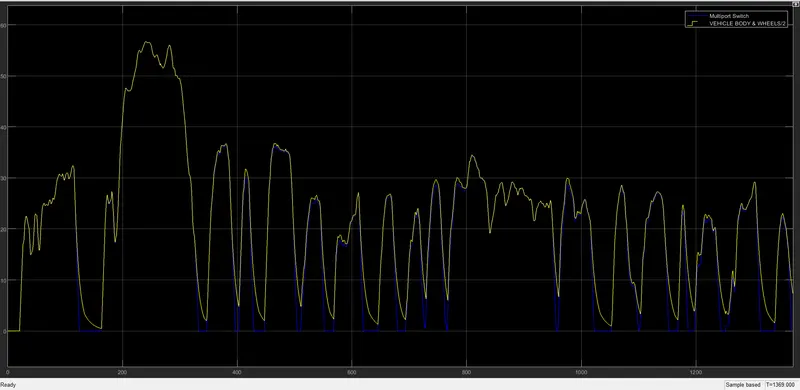
as compared to the ftp75 drive cycle.
speed of actual vehicle is perfectly following the path of udds drive cycle.
maximum speed of a drive cycle is under the range of a actual vehicle speed.
it conclude that this rickshaw model is suitable for udds type of drive cycle our model is working properly.
iii. soc
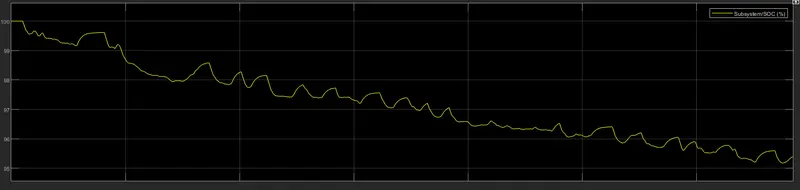
after completion of simulation SOC is reduced to 95% to travel the distance of 8.048 kms
iv. temperature rise in motor and controller.
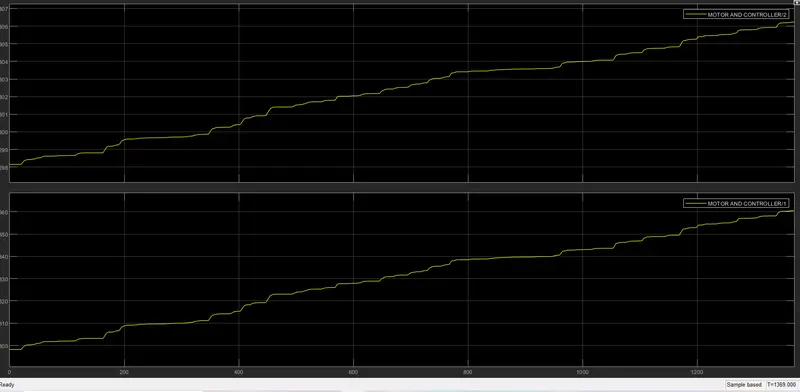
temp. of controller is increased to 307K
temp. of motor is icreased to 360K.
temp is under controll.
v. energy consumption:-
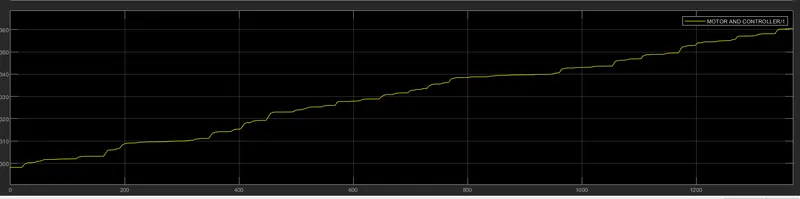
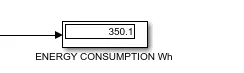
energy consumed is 350.1 watt hour.
vi. distance travelled:-
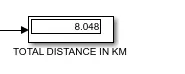
distance travelled=8.048 km.
3. WOT (45 kmph constant cover 100 km distance):-
i. speed profile of FTP74:-
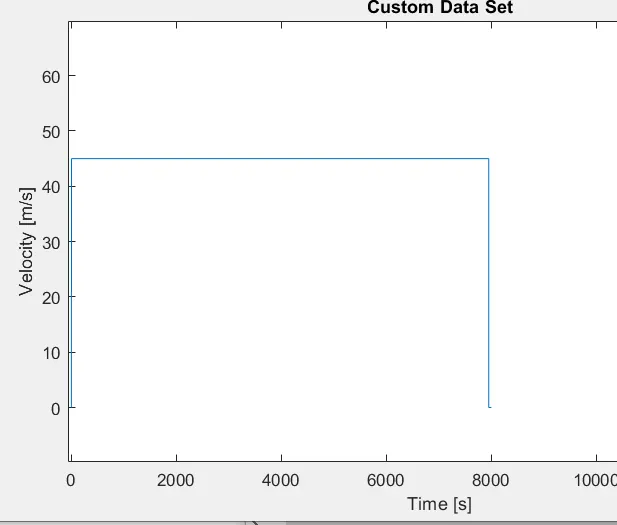
input given as constant speed is 45 kmph.
ii. actual speed of vehicle and drive cycle
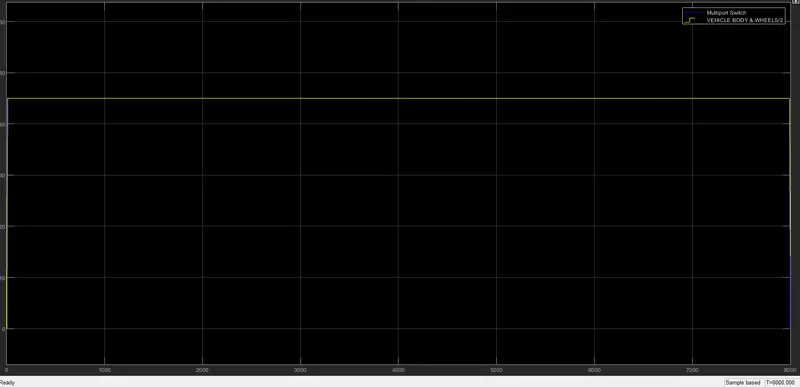
speed is maintained at constant velocity of 45 kmph.
iii. soc,voltage,current profile
- SOC Of a battery is reached to 65%.
- wihout any regenerativ braking.
iv. temperature rise in motor and controller.
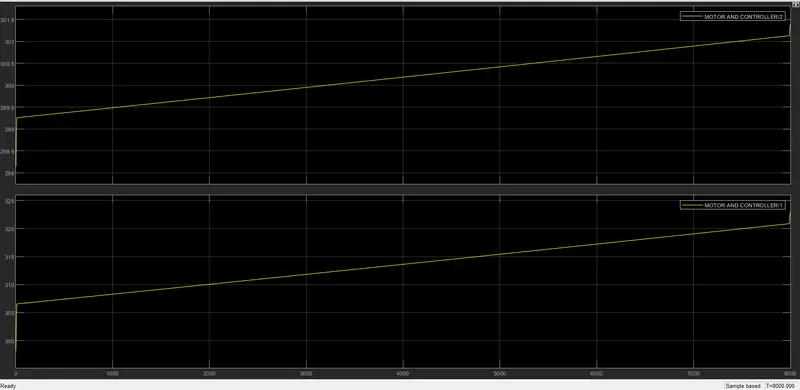
- temp. of controller is increased to 302K
- temp. of motor is icreased to 322K.
- temp is under controll.
v. energy consumption by vehicle:-
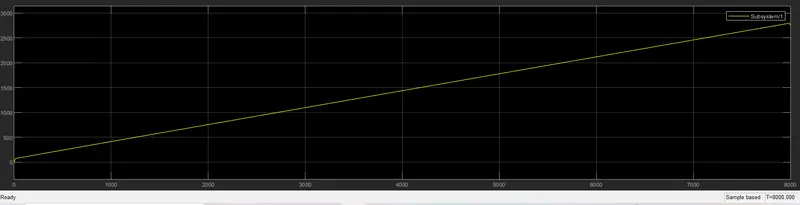
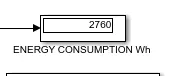
enrgy consumption= 2760wh
vi. distance travelled by vehicle.
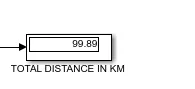
distance travelled by vehicle= 99.89
CONCLUSION:-
performance of vehicle is depended on the capacity of battery & motor.
in order to obtain maximum speed, higher voltage supply and maximum power of motor is required.
selection of motor and battery made easy with the simulations.
we can obtain required data by simulating diferent parameters to construct e-rickshaw.