Final Project: Design of an Electric Vehicle
Final Project: Design of an Electric Vehicle
Create a MATLAB model of electric car which uses a battery and a DC motor. Choose suitable blocks from Powertrain block set. Prepare a report about your model including following:
Objectives:
- System level configurations
- Model parameters
- Results
- Conclusion
Answer: -
Electric Vehicles (EVs) are the vehicles which operate only on stored electricity, and their main components consist of a high-voltage battery, one or more electric motors (either alternating current [AC] or direct current [DC]), and a controller to manage the power electronics.
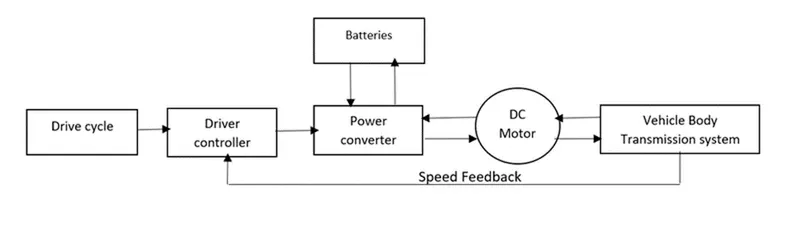
Considering the main components of the EVs, the overall block diagram can be given as,
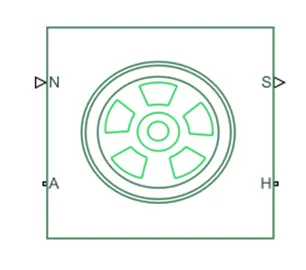
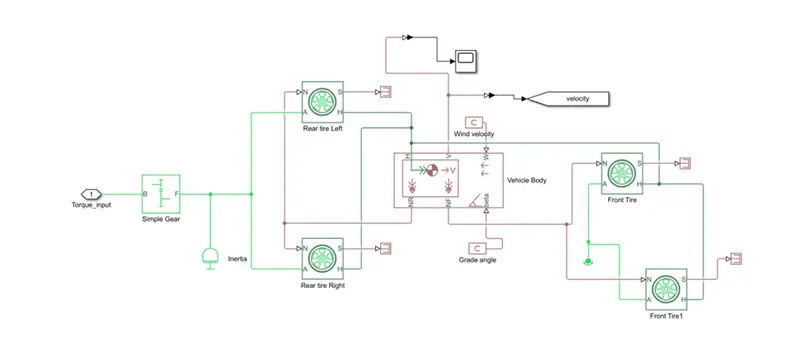
Tire:
The vehicle is assumed to be front axle is driven (4 wheels- 2 on each axle).
The wheels are modelled using simple Tire (Magic formula) Simulink blocks.
The block can model tire dynamics under constant or variable contact surface conditions.
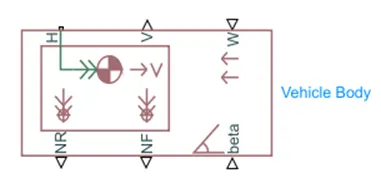
Vehicle Body:
This block basically represents a two-axle vehicle body in longitudinal motion. The block accounts for - body mass, aerodynamic drag, road incline, weight distribution between axles due to acceleration road profile. Here, connection H is the mechanical translational conserving port hub.
NF & NR correspond to the output ports for normal reaction forces on the front axle and rear axle wheels respectively.
Connection V represents the actual output translational velocity of the vehicle.
beta is the road inclination angle & W corresponds to the headwind
(headwind direction opposite to that of the vehicle).
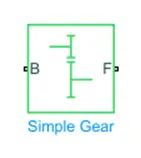
Simple Gear:
A simple gear block is used to connect the motor to the rear axle of the vehicle.
It represents the gearbox that connects the input shaft to the base gear and output from the follower gear.
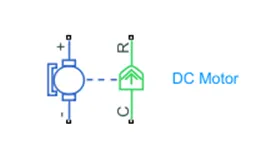
DC Motor:
This is the DC Motor which would give rotational power to the wheels and become the sole power generation source.
The DC Motors terminals are connected as mentioned below.
+ =Electrical signal to the motor Positive Terminal
- =Electrical signal to the motor Negative Terminal
R=Casing of the Motor connected with the Mechanical Rotational Reference Block
C=Rotor Case connected to the Mechanical Rotational reference
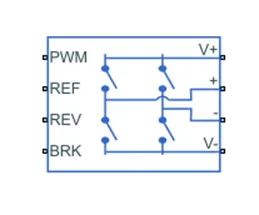
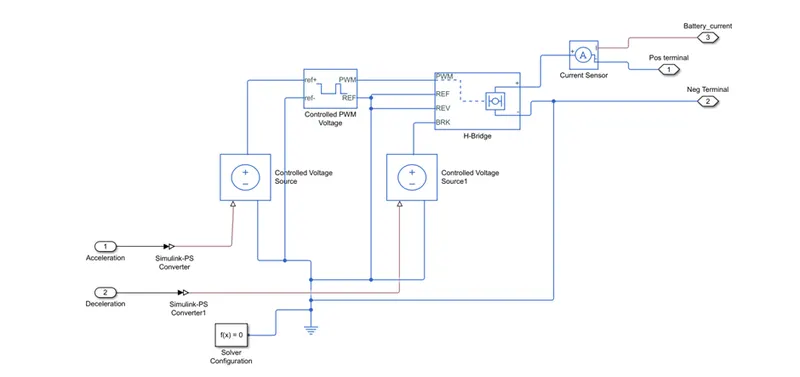
H-Bridge:
The H-Bridge helps in controlling the power that is input according to the requirement. The output provided is converted voltage as per the controlled parameters.
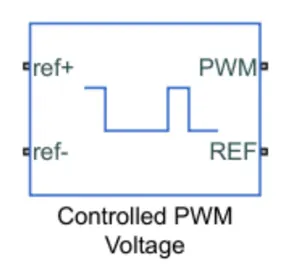
Controlled PWM Voltage:
The Controlled PWM Voltage block represents a pulse-width modulated (PWM) voltage source. You can model electrical or physical signal input ports by setting the modelling option parameter to either:
Electrical input ports — The block calculates the duty cycle based on the reference voltage across its ref+ and ref- ports. This option is the default.
PS input — Specify the duty cycle value directly by using an input physical signal port.
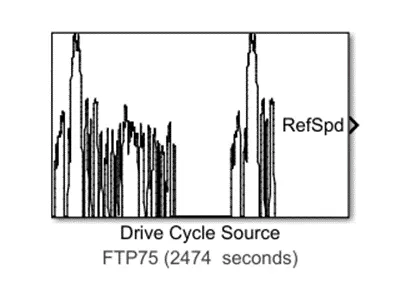
Drive cycle:
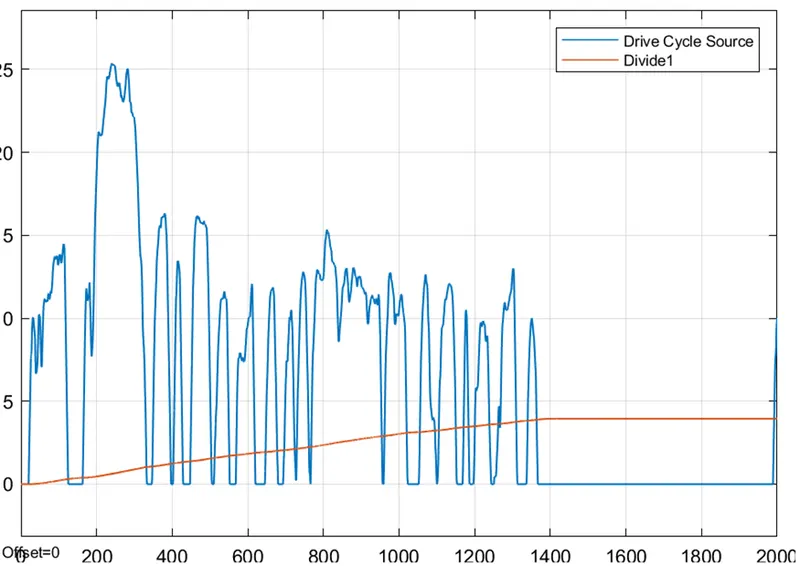
It is the data set of vehicle speed with respect to time. Here, for this model an Excel file created to be used as a drive cycle defining speed in m/sec.
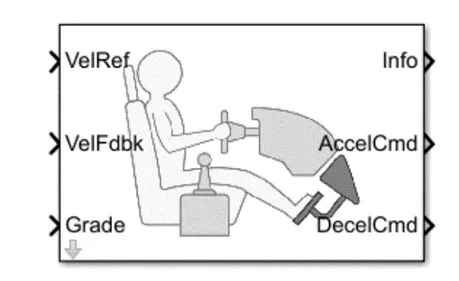
Driver Controller:
This is the block where we give drive cycle data as reference desired input and is compared to the feedback actual speed obtained. Then accordingly acceleration or deceleration signal is given.
Power converter:
This is a power electronic circuit which converts electrical power as DC-DC or DC-AC and delivers the necessary power as required. Here, DC motor is used, so we required only DC-DC converter which will convert battery supplied voltage and deliver to the motor and other systems associated.
Also, in this Simulink model we can use the solve configuration, display, scope.
Vehicle Dynamics:
Power Controller:
Simulink Model:
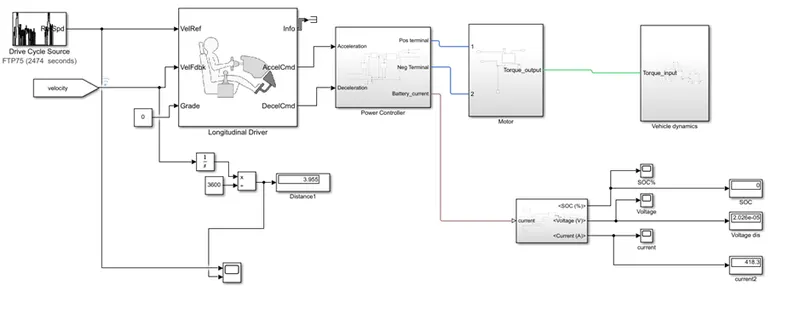
We can run the model and see the out put result.
Result: -
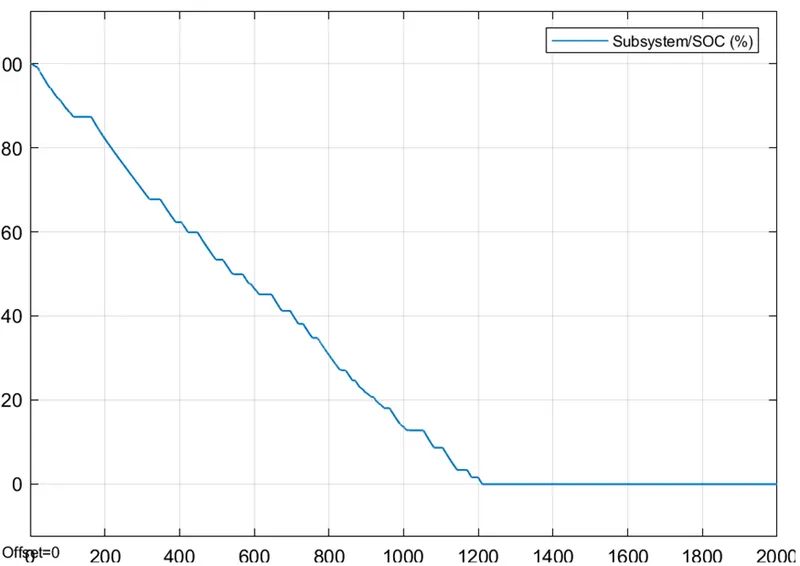
- SOC
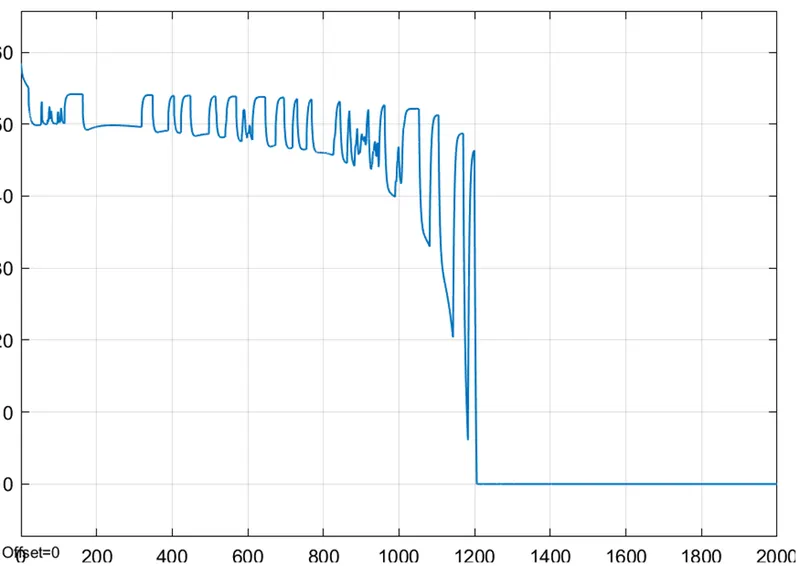
3.Voltage
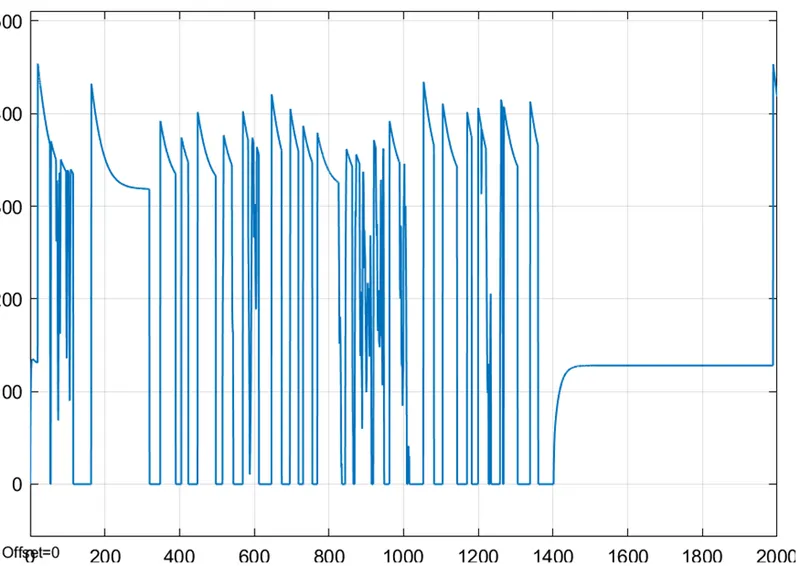
4.Current
Conclusion:
With respect to this model, actual speed obtained by the vehicle is almost as same as input drive cycle, but not exactly same as it depends on the battery capacity selected and associated motor. Distance covered by the vehicle is displayed in the connected display i.e. in 200 sec and will keep on increasing with increase of simulation time and may differ with alterations of parameters.
Also, SOC % of the battery after simulation of 200 sec is 90 %. so, the vehicle can run on same drive cycle over the large period of time until the SOC % becomes 0. Also, in this model, regerative braking is enabled, so whenever the is deceleration of the vehicle, power is being fed back to the battery And SOC % is increasing for that period.