Image Processing using MATLAB
Image processing using MATLAB
AIM:
- To perform image processing by using the Matlab Editor window.
- To perform image processing with Matlab Graphical User Interface (GUI).
THEORY:
MATLAB is a scientific programming language and provides strong mathematical and numerical support for the implementation of advanced algorithms. It is for this reason that MATLAB is widely used by the image processing and computer vision community.
Imagine pointing your camera to some object and the camera tells you the name of that object, Google lens in Android smartphones is doing the same thing using Image Processing. This gives the computer a vision to detect and recognize the things and take actions accordingly. Image processing has a lot of applications like Face detection & recognition, thumb impression, augmented reality, OCR, Barcode scan and many more. There is a lot of software available for image processing, among them MATLAB is the most suitable to start with.
OBJECTIVE:
MATLAB can perform many advance image processing operations, here we will explain some basic operations like RGB to Gray, rotate the image, binary conversion etc. You can further make automated programs for noise removal, image clarity, filtering by using the functions.
There are two ways to perform any image processing algorithm, one is by directly entering the command in the editor/command window and other is by creating a GUI for the same. Here, both the methods are used to perform basic operations of image processing in MATLAB.
Image Processing by using MATLAB Editor Window
Code and Explanation:
a = imread('F:\matlab project\image processing using matlab\camerman.jpg');
subplot(2,3,1);
imshow(a);

b = rgb2gray(a);
subplot(2,3,2);
imshow(b);

c = im2bw(a);
subplot(2,3,3);
imshow(c);

d = imadjust(b);
subplot(2,3,4);
imshow(d);

e = a;
e=rgb2gray(e);
subplot(2,3,5);
imhist(e);

imfinfo('F:\matlab project\image processing using matlab\beard-man.jpg')

[height, width, colour_planes] = size(a)

%colormap('spring')
In variable ‘a’, we are importing image using command imread(‘filename’) and then making a plot of ‘2’ row and ‘3’ column using subplot(row, column, position) and displaying the imported image on position ‘1’. To show the image we use command imshow(‘filename’).
Below are a few commands to perform some basic processing on uploaded image:
- In variable ‘b’, we are converting the RGB image into grayscale intensity image by using the command rgb2gray(‘filename’) and displaying it in the plot on position ‘2’.
- In variable ‘c’, we are converting the image into a binary image or you can say in the format of ‘0’ (black) and ‘1’ (white) by using the command im2bw(‘filename’) and displaying it in the plot on position ‘3’.
- In variable ‘d’, we are adjusting or mapping the grayscale image intensity values by using the command imadjust(‘filename’) and displaying it in the plot on position ‘4’.
- In variable ‘e’, we are plotting the histogram of the grayscale image by using the command imhist(‘filename’) and displaying it in the plot on position ‘5’. For plotting the histogram you always have to convert the image into grayscale and then you will be able to see the histogram of that graphic file.
- Imfinfo(‘filename with location’) command is used to display information about the graphical file.
- [height, width, colour_planes] = size(‘filename’) command is used to display the size and color planes of a particular graphic file.
- colormap('spring') is used to change the type of colormap of graphic file. Here, in my code I set this command as comment but you can use it by removing the percentage sign. There are many types of color in MATLAB like Jet, HSV, Hot, Cool, Summer, Autumn, Winter, Gray, Bone, Copper, Pink, Lines and spring.
Output Result:
Image processing with MATLAB Graphical User Interface (GUI)
Creating Matlab Graphical User Interface for Image Processing:
For building a GUI (Graphical User Interface) for Image Processing launch the GUI by typing the below command in the command window.
guideA popup window will open, then select new blank GUI as shown in below image,
Now we have to choose the number of pushbuttons (every pushbutton will perform the different task) and one axis to display image.
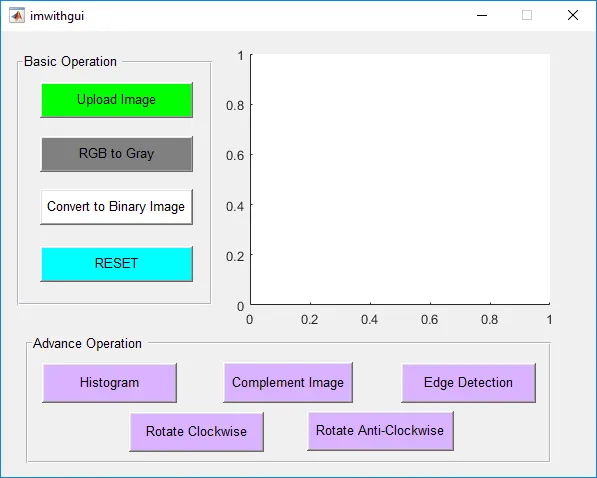
To resize or to change the shape of the Pushbutton or Axes, just click on it and you will be able to drag the corners of the button. By double-clicking on any of these you will be able to change the color, string, tag and other options of that particular button. After customization, it will look like this.
You can customize the buttons as per your choice. Now when you save this, a code is generated in the Editor window of MATLAB. Edit the generated code to set the task for different pushbuttons.
MATLAB GUI Code for Image Processing
In the ‘uploadimage’ function, copy and paste the below code to insert the file from the PC. Here, command uigetfile(‘image extension type’) is used for importing an image in the MATLAB GUI. Read that file using command imread() and then display it with command imshow() on axes1 using axes(handles.axes1). Now, with the command setappdata(), store the variable in the GUI so the variable will be accessible to one part of the GUI to the other part of the GUI.
a=uigetfile('.jpg')
a=imread(a);
axes(handles.axes1);
imshow(a);
setappdata(0,'a',a)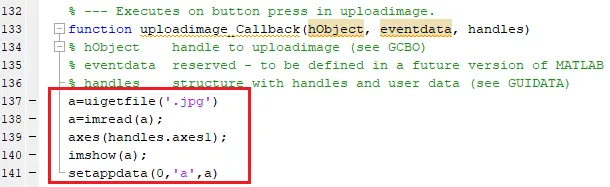
Now, in every function you will see command getappdata() which is used to retrieve data which is stored using the setappdata() in the GUI.
Eight commonly used functions in image processing
| S. No. | Command | Button Name | Task to be Performed |
| 1. | uigetfile() | Upload Image | Click to import the image from Disk |
| 2. | rgb2gray() | RGB to Gray | Click to convert RGB image into grayscale |
| 3. | im2bw() | Convert to Binary Image | Click to convert the image into binary |
| 4. | - | RESET | Click to reset the image as original |
| 5. | imhist() | Histogram | Click to see the histogram of the image |
| 6. | imcomplement() | Complement Image | Click to check the complement image |
| 7. | edge(filename,method) | Edge Detection | Click to detect the edges in the image |
| 8. | imrotate(filename,angle) | Rotate Clockwise | Click to rotate the image into the clockwise direction |
| 9. | imrotate(filename,angle) | Rotate Anti-Clockwise | Click to rotate the image into the anti-clockwise direction |
1. Convert RGB image into grayscale
In the ‘rgb2gray’ function, copy and paste the below code to convert the RGB image into grayscale by using command rgb2gray().
a=getappdata(0,'a');
agray=rgb2gray(a);
axes(handles.axes1);
imshow(agray);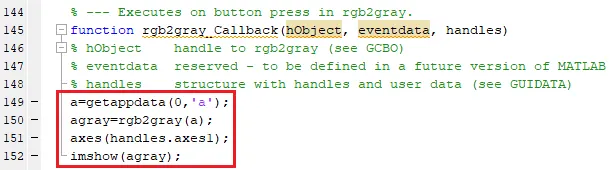
2. Convert to Binary Image
In the ‘im2bw’ function, copy and paste the below code to convert the image into binary image or you can say in format of ‘0’ (black) and ‘1’ (white) by using command im2bw().
a=getappdata(0,'a');
abw=im2bw(a);
axes(handles.axes1);
imshow(abw);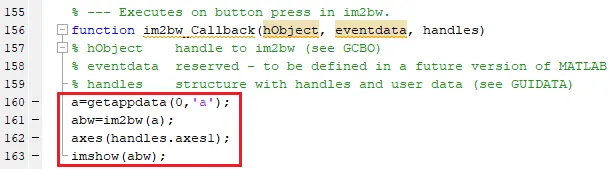
3. Reset to Original Image
In the ‘reset’ function, copy and paste the below code to reset the edited image into the original image.
a=getappdata(0,'a');
axes(handles.axes1);
imshow(a);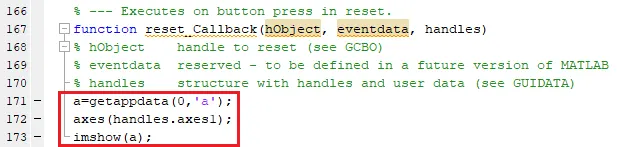
4. Plot Image Histogram
In the ‘histogram’ function, copy and paste the below code to plot the histogram of the grayscale image by using the command imhist(‘filename’) and display it in on axes1. For plotting the histogram you always have to convert the image into grayscale and then you will be able to see the histogram of that graphic file.
a=getappdata(0,'a');
ahist=a;
ahist=rgb2gray(ahist);
axes(handles.axes1);
imhist(ahist);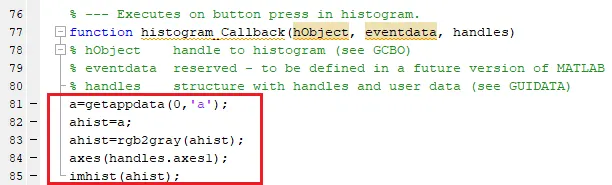
5. Convert to Complement Image
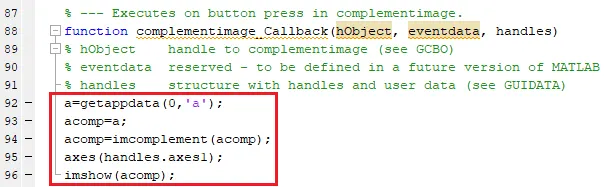
In the ‘complementimage’ function, copy and paste the below code to see the complement of the inserted graphic file by using command imcomplement().
a=getappdata(0,'a');
acomp=a;
acomp=imcomplement(acomp);
axes(handles.axes1);
imshow(acomp);
6. Edge Detection using Canny Method
In the ‘edge’ function, copy and paste the below code to detect and find edges in grayscale image by using command edge(‘filename’,’method’). In the place of method you can choose among these three, Canny, Prewitt and montage. We are using Canny method for edge detection. Also you cannot detect the edge directly from the original image, first you have to convert it into grayscale and then you can able to detect the edges.
a=getappdata(0,'a');
aedge=a;
aedge=rgb2gray(aedge);
aedge=edge(aedge,'Canny')'
axes(handles.axes1);
imshow(aedge);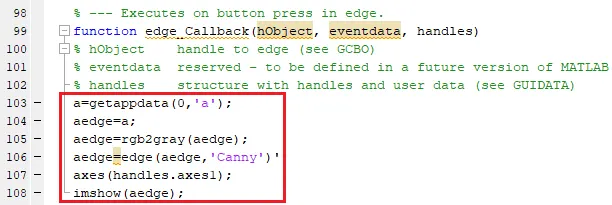
7. Rotate Image Clockwise
In the ‘clockwise’ function, copy and paste the below code to rotate the image in the clockwise direction by using command imrotate(filename,‘angle’)
a=getappdata(0,'a');
aclock=a;
aclock=imrotate(aclock,270);
axes(handles.axes1);
imshow(aclock);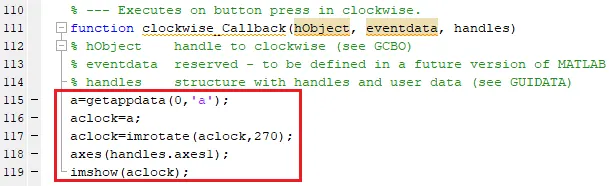
8. Rotate Image Anti-Clockwise
In the ‘anticlockwise’ function, copy and paste the below code to rotate the image in the anti-clockwise direction by using command imrotate(filename,‘angle’)
a=getappdata(0,'a');
aclock=a;
aclock=imrotate(aclock,90);
axes(handles.axes1);
imshow(aclock);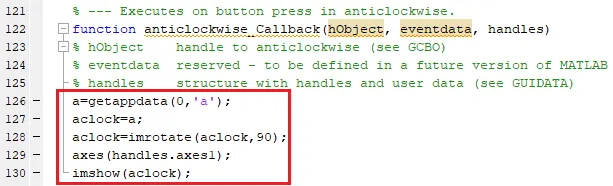
Result and Output:
Run MATLAB GUI code for Image Processing
Now, click on the ‘RUN’ button to run the code.

MATLAB may take a few seconds to respond, do not click on any GUI buttons until MATLAB is showing a busy message in the lower-left corner as shown below,

When everything is ready, import the image from the PC by clicking on the ‘Upload Image’ button. Now, you will be able to convert or rotate the image by clicking any button accordingly. Below table will show you the task we are performing on the click of any particular button:
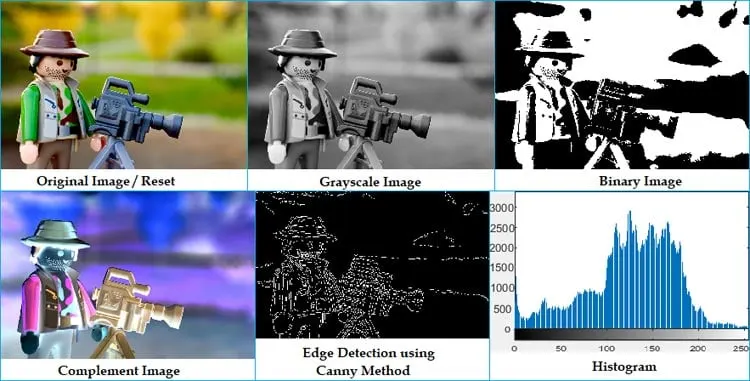
The result on click of each button will give shown below,