FINAL INDEPENDENT PROJECT
Q.) Simulate the diesel cycle using MATLAB with calculation of Thermal Efficiency and finally draw the diesel cycle plot?(initial parameters should be assumed by yourself)
solution.)
#Aim : to simulate the diesel cycle using MATLAB.
The diesel cycle is used in many big engines around us like trucks,buses etc. the main difference between the otto cycle and diesel cycle is that in diesel cycle heat additon take place at constant pressure whereas in otto cycle it take place at constant volume.
#the four process in diesel cycle are disscused below:
1.) Suction Stroke: it is denoted by the horizontal line shown in the cycle before the cycle starts.in this process the air is sucked in the cylinder and the piston approached to BDC(Bottom Dead Centre). this is the initial process of the diesel engine cycle.
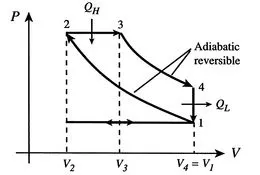
2.) Compression Stroke(1-2): During this Stroke the air insidde the piston cylinder is starting to compressed adiabatically and the piston moves from BDC to TDC(Top Dead Centre) in this process the sir get highly compressed inside the cylinder and is perfect to ignite.
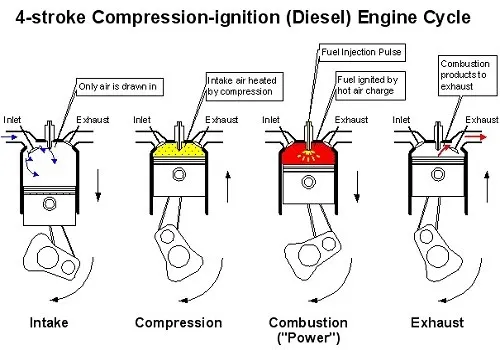
3.) Power Stroke(2-3): Since the compressed air is get heated enough the sprinkler at the top of the piston head starts to sprinkle the fuel so that the fuel start to ignite in the cylinder and hence heat is generated inside it which is done at constant pressure as shown in the diagram.
4.) Expansion Stroke(3-4 and 4-1): when the fuel get combust inside the cylinder and tremendous power get gemerated the produced power starts to move the piston from TDC to BDC and the piston then start coming to bottom of the cylinder.now, finally during (4-1) the output exhaust gas starts to exhale out from the cylinder and thus making it to perform a new repeated cycle.
#formulations are described below:
the values of p1,t1,t3 are allready assumed.
a) p1*v1^gamma = p2*v2^gamma; p1*v1/t1 = p2*v2/t2; also
swept volume = (pi/4)*bore^2*stroke; clearance volume = (swept volume)/(cr-1);cr= compression ratio
b) we have, p3 = p2; v2 = clearance volume;v1 = (swept volume) + (clearance volume);
c) (v3/v2) = (t3/t2); p3*v3^gamma = p4*v4^gamma;p3*v3/t3 = p4*v4/t4;
The thermal efficiency is given as:

The code of the program is given below:
close all
clear all
clc

%Inputs parameters for the cycle
gamma = 1.4;
p1 = 1.01325;
t1 = 293;
t3 = 2510;
bore = 0.1;
stroke = 0.1;
conn_rod = 0.15;
% cr = compression ratio
cr = 18;
% volume calculation
v_swept =  (pi/4)*bore^2*stroke;
v_clearance = (v_swept)/(cr-1);
v1 = v_swept + v_clearance
% State 2
v2 = v_clearance
%p2v2^gamma = p1v1^gamma
p2 = p1*(v1/v2)^gamma
%p1v1/t1 = p2v2/t2
t2 = (p2/p1)*(v2/v1)*t1
%we have to define a function to draw the isentropic
%expansion/compression arcs on diesel cycle curve.
constt_c = p1*v1^gamma;
v = linspace(v1,v2,300);
p = (constt_c)./(v.^gamma);
% State 3
p3 = p2
%p3v3/t3 = p2v2/t2
v3 = v2*(t3/t2)
constt_c = p3*v3^gamma;
% State 4
v4 = v1
%p3v3^gamma = p4v4^gamma
p4 = p3*(v3/v4)^gamma
%p3v3/t3 = p4v4/t4
t4 = (p4/p3)*(v4/v3)*t3
% since PV^gamma = constt_c
V = linspace(v3,v4,300);
P = (constt_c)./V.^gamma;

% Thermal Efficiency
% we have rho = v3/v2 and cr = v1/v2.
rho = v3/v2;
efficiency = 1 - (t1/gamma*t2)*(((t4/t1)- 1)/((t3/t2)- 1))

%Plotting the PV diagram
figure(1)
hold on
plot(v1,p1,'*','color','g')
plot(v,p)
plot(v2,p2,'*','color','g')
plot(v3,p3,'*','color','g')
plot(V,P)
plot(v4,p4,'*','color','g')
line([v2 v3],[p2 p3],'color','r')
line([v4 v1],[p4 p1],'color','r')
xlabel('Volume')
ylabel('Pressure')
#Explanation of the code:
a) Code starts with clear all,close all and clc. after that the input parameters p1,t1,t3,bore,stroke,gamma,connecting rod and compression ratio are defined.
b) now the swept volume and clearance volume are calculated,v2 is defined since it is equal to clearance volume.after that the p2 and t2 are calculated using adiabatic expression and ideal gas equation respectievely.
c.) using linspace command the variable 'v' is defined between v1 and v2 and then 'p' is calculated,now coming to state 3 we have p3 = p2 and v3 is calculated using the ralation between temperature and volume keeping pressure as constant.
d) coming to state 4 we have v4 = v1, p4 is calculated using the relation of adiabatic expansion and t4 is calculated using ideal gas equation between state3 and state4.now, 'P' and 'V' are calculated using linspace command.
e.) finally, Thermal Efficiency is calculated and plot command are given where state points are specified seperately and then line is drawn bwteen 'state1 and state2' and 'state4 and state1' and at last the adiabatic parts of both expansion and compression are drawn.
#OUTPUT:
# Error faced during programming:
the error is shown below. this is just a silly error since i have not provide the '*' sign between the two paranthesis, after providing the'*' sign the program work well!!
#Refferences:
https://in.mathworks.com/matlabcentral/answers/840-how-to-plot-a-simple-curve