FINAL INDEPENDENT PROJECT
the main objective of the fracis trubine is to find the efficieny of the trubine
in this process we have given the some inputs and for calculating the efficieny
as rpm,gravity & density
to calculate the pressures first we need to find the pressure in the truble as the p1
called as trubine pressure
later we calculate the vaccume pressure after exiting the trubine because the pressure at the exit of the trubine is very less as compared to intial pressure in the trubine
it is converted into the kinetic energy
the differencee between these to pressures as calculated as the fixed value provided in the inlet as the 0.22 cm
the pump allow us to flow the water from the sump or reservior to calculate the pressure from the pump we use ventuire meter before entering into ventureie meter as taken as pressure at right side and after leaving the ventire meter as taken as the pressure in left
pr= pressure_right
pl=pressure_left
to calculate the head pressure of manameter we use the both the pressures as difference
hm=pr-pl
by using this we can find the discharge of the pump in the trubine as folloew
q=0.13*(hm)^0.5
later to calculate the power input we use the specific weight*discharge *head loses
Pin=density*g.*Q*H;
h=mechanical losses +hydralicloses+0.22
power output can be calculated by using the values
PO=(2*3.14*n.*(S1-S2)*g*0.15)/60;
s1 and s2 are the string load when we add this load their is a reduce in the rpm this values can have a limit for each trubine
we taken the load limit to 32 kg
0.15 is the radius of the dyanmic load which help to observe the load or vibration from the trubine
later we find the efiificeny fro this based on the output /input
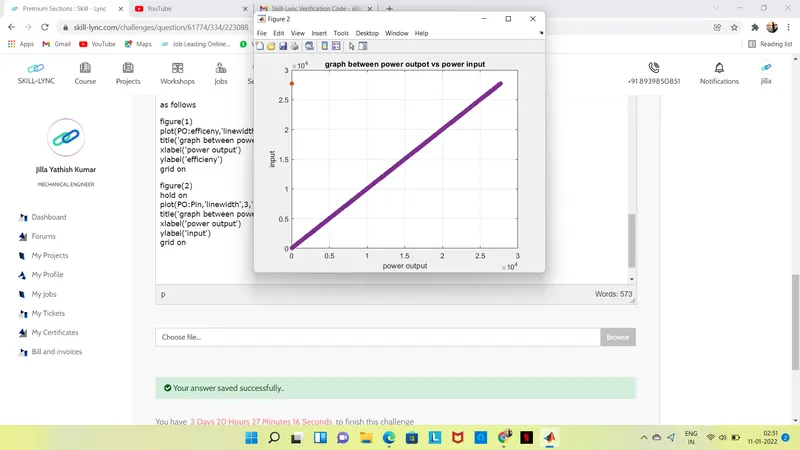
in this programming i need to find the graph for the each and indivivdal point from the poutput to the efficieny and the output to the input
for this i used the for loop for calculating the each and every itration
as followed for the pressures and the string loads and the manometer pressures
for i=1:length(pr)
PR=pr(i);
for j=1:length(pl)
PL=pl(j);
Hm=PR-PL;
manameteric_head=Hm;
for k=1:length(p1);
P1=p1(k);
for m=1:length(p2);
P2=p2(m);
H=P1+P2+0.22;
%%discharge in the turbine
Q=0.013.*(Hm).^0.5;
discharge=Q;
display(discharge)
%power output of the trubine
for n=1:length(s1)
for o=1:length(s2)
S1=s1(n);
S2=s2(o);
PO=(2*3.14*n.*(S1-S2)*g*0.15)/60;
output_power=PO;
display(output_power)
%power input of the trubine
Pin=density*g.*Q*H;
input_power=Pin;
display(Pin)
%efficeny of the trubine
efficeny=PO./Pin;
display(efficeny)
end
end
end
end
end
end
plotting the graph for the
poutput vs efficieny
plotting the graph for the
pinput vs poutput
as follows
figure(1)
plot(PO:efficeny,'linewidth',1,'Marker','*')
title('graph between power outpot vs efficiency')
xlabel('power output')
ylabel('efficieny')
grid on
figure(2)
hold on
plot(PO:Pin,'linewidth',3,'marker','*')
title('graph between power outpot vs power input')
xlabel('power output')
ylabel('input')
grid on