FINAL INDEPENDENT PROJECT
TITLE : PERFORMANCE OF TORQUE IN AN AUTOMOBILE.
AIM:
- To study the performance of torque produced in an automobile
- Calculate the necessary details.
- To evaluate and record the torque performance in both Wheel and Engine.
INTRODUCTION:
- Torque is the rotational equivalent of linear force.It is also referred to as the moment, moment of force, rotational force or turning effect, depending on the field of study.
- Torqueis the 'turning or rotational power' of the engine i.e. how much power can an engine produce.
- It is sometimes referred to as 'pulling power’ and also can be viewed as the 'strength' of the car.
- here in this Project we will be analysing the performance of torque, how we can alternate and changes associated with Governing the Torque using MATLAB.
SIGNIFICANCE:
- Torque is a crucial part of generating power from a car's engine, as it represents the load an engine can handle to generate a certain amount of power to rotate the engine on its axis.
- As EVs don't require fuel, they don't produce torque through combustion. Instead, they generate the force necessary to turn the wheels of the car. A typical motor will be in the 20,000-watt to 30,000-watt range.
- torque plays a bigger role in how quickly your car accelerates.
THEORY:
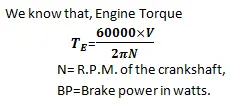
- The pressure developed by the bruning of fuel in the engine cylinder is transmitted to the crankshaft by the piston and connecting rod and a turning force or effort known as torque is produced. The crankshaft is coupled to the driving road weels through clutch, gearbox, propeller shaft, differential and axle shafts in an automobile. Thus, Torque produced by the engine is transmitted through the drive line to the road wheels to propel the vehicle. The torque depends upon the pressure exerted on the piston and the length of crank arm and it is measure in newton-metre (N-m). The actual power delivered by the engine is known as brake power(BP), and it is mesure in watts (W) or Kilowatts(kW).
- The Torque increases with the increase in engine speed up to a certain point after which it startes to fall down even though the engine speed continues to increase. The number of revolutions per minute (rpm) at which the torque begins to decrease, depends upon the engine design. At higher speeds, engine vacuum falls down and less fuel enter the cylinder resulting in lesser force available at the piston and this there is a fall in torque. The power and torque curve of a particular engine with respect to engine speed.
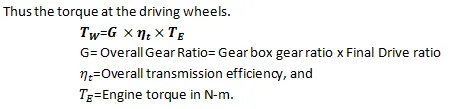
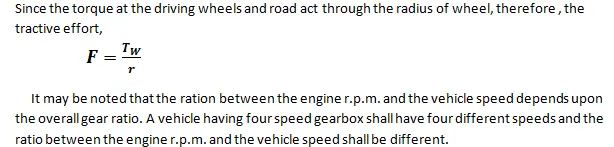
- The torque available at the contact between driving wheels and road is known as tractive effort. The gearbox and final drive at differential act as leverage to multiply torque which is inversely proportional to the speed. If the gear speed is lowered, the torque shall be increased in the same ratio and vice versa.
CALCULATIONS:
PROGRAM:
% Analysis of Torque Performance of Automobile
clear all
close all
clc

% inputs required for Analysing
% Overall transmission efficiency
OTE=0.9; % the OTE varies from 86 to 94 percentage
N=(1000:7000); % RPM of Crankshaft
BP=26; % Brake Power in watts
r=0.25; % Radius of the wheel

% Calculations for the Performane
% Overall Gear Ratio
GBGR=5; % Gear Box Gear Ratio
FDR=3;  % Final Drive Ratio
G=(GBGR*FDR);

% Calcualtion of Engine Torque
T_E=((60000*BP)./(2*pi.*N));

% Calculation of Torque at driving wheels
T_W=G*OTE*T_E;

% Calculation of Torque at contact b/w driving wheel and road
F=T_W/r; %Tractive effort

% Calculation of Vehicle Speed
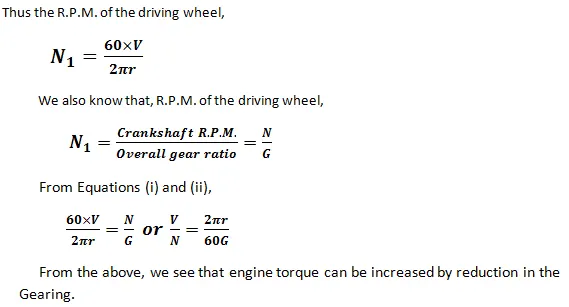
V=((2*pi*r.*N)/60*G);

% Plotting

figure(1)
hold on
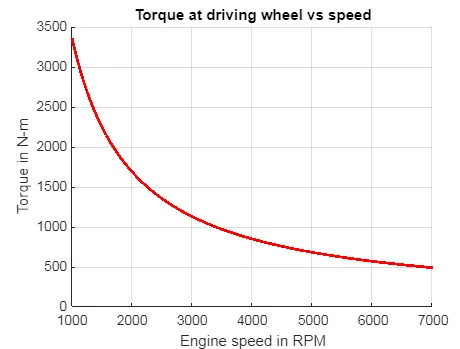
plot(N ,T_W,'LineWidth',2,'color','r')
grid on
title('Torque at driving wheel vs speed')
xlabel('Engine speed in RPM')
ylabel('Torque in N-m')

figure(2)
hold on
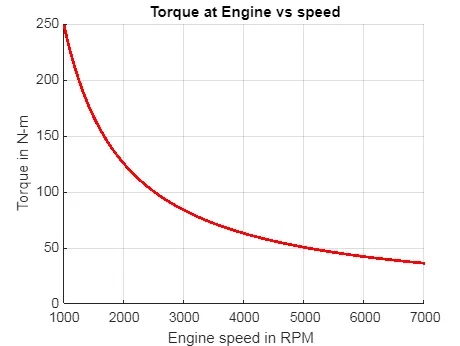
plot(N,T_E,'linewidth',2,'color','r')
grid on
title('Torque at Engine vs speed')
xlabel('Engine speed in RPM  ')
ylabel('Torque in N-m')
EXPLANATION:
- Intially clear the screen using the Clear all, close all and Clc.
- Feed the input parameters for calculations.
- we know that the overall transmission efficiency varies from 86% to 94%.
- Since Speed in R.P.M. is a variable factor we define speed in a array from 1000 R.P.M. to 7000 R.P.M.
- then we input the formula for neccessary calculations, we are using dot wise or element wise operator to multiply with the array.
- Then Plot the results using plot command, turn on the grid and define the x label and y label.
OUTPUT:
OBSERVATIONS:
- high levels of this torque force at relatively low rpm. This allows the vehicle to accelerate quickly.
- At high RPM, torque drops off primarily from intake and exhaust flow restriction.
- This further reduces torque at the output.
- The Reason that Torque and Speed are said to be inversely proportional is the ability to generate torque diminishes with increase speed.
BENEFITS FROM THIS PROJECT :
- Simplified Integration.
- Increased Accuracy.
- Reduced Cost Of Ownership.
- No Backlash.
- High Torque At Low Speeds.
- Minimal Noise, Vibration And Torque Ripple.
RESULT:
Thus the Performance of Torque in Automobile is Analysed using MATLAB successfully and the Outputs are verified.
Project by
Simeon T
MHEV