Electric Rickshaw Modelling using MATLAB & Simulink
Aim : Modelling of an Electric Rickshaw (3 Wheel Passenger Vehicle) in MATLAB & Simulink
Explanation & Procedure
Electric rickshaws (also known as electric tuk-tuks or e-rickshaws or auto) have been becoming more popular in some cities since 2008 as an alternative to auto rickshaws and pulled rickshaws because of their low fuel cost, and less human effort compared to pulled rickshaws. They are being widely accepted as an alternative petrol/diesel/CNG auto rickshaws. They are wheelers pulled by an electric motor ranging from 650-1400 Watts. They are mostly manufactured in India & China, only a few other countries manufacture these vehicles.
Battery-run rickshaws could be a low-emitter complementary transport for the low-income people, who suffer most from a lack of transport facility, if introduced in a systematic manner according to experts.
Let us consider the MAHINDRA’S FIRST LOW MAINTENANCE LITHIUM-ION BATTERY POWERED THREE WHEELER.
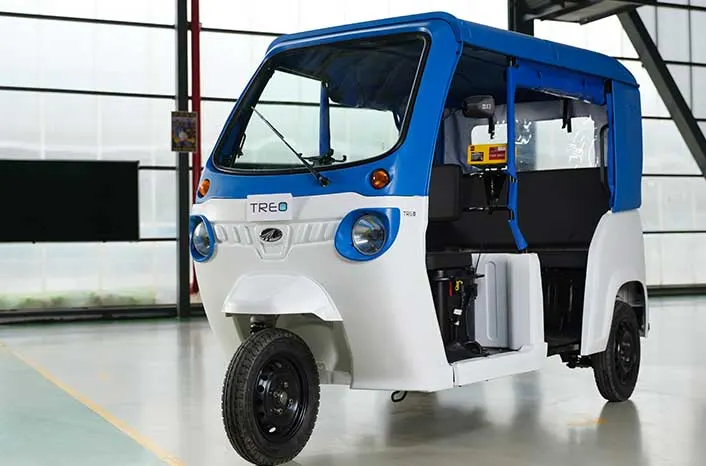
Mahindra introduces Treo, a revolutionary new range of electric three wheelers. Powered by the most advanced Lithium-ion technology, Mahindra Treo will change the world of three wheelers forever. Treo offers increased savings, superior ride quality and best-in-class comfort for drivers and passengers, along with zero emission technology, for a better tomorrow.
Specification of Mahindra Treo
1) Battery Type, Voltage - Lithium-ion, 48V -120V
2) Battery Capacity (Installed) - kWh - 7.37 - 10
3) Charging Time 0-100% @Standard Conditions - 3 hr 50 min
4) Peak Power - kW - 8 - 10
5) Peak Torque - Nm - 30
6) Transmission Type - Direct Drive
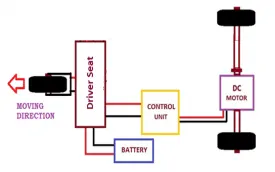
The Basic Electric Rickshaw Drivetrain :
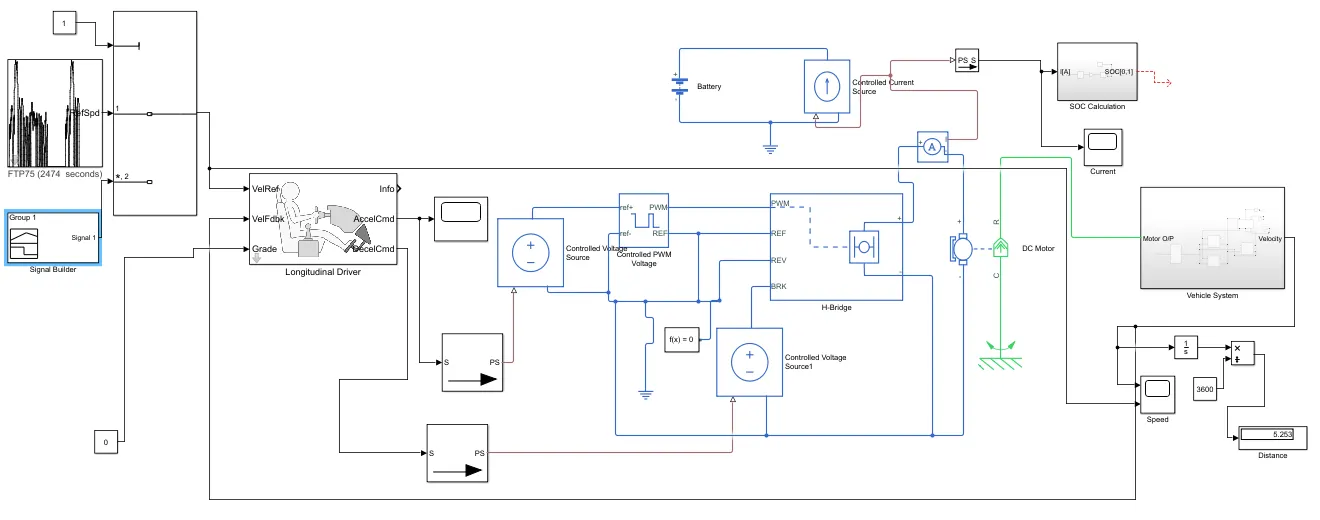
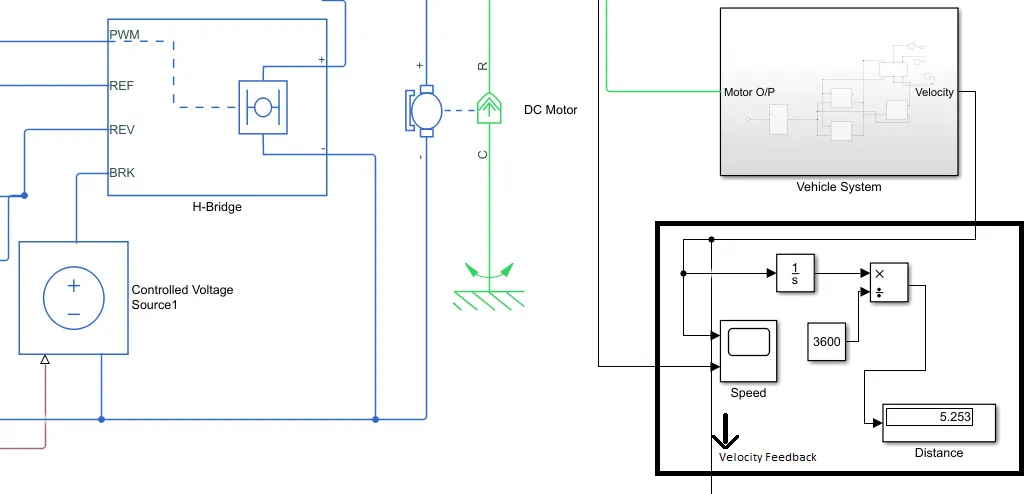
Simulink Model of the Electric Rickshaw using DC motor :
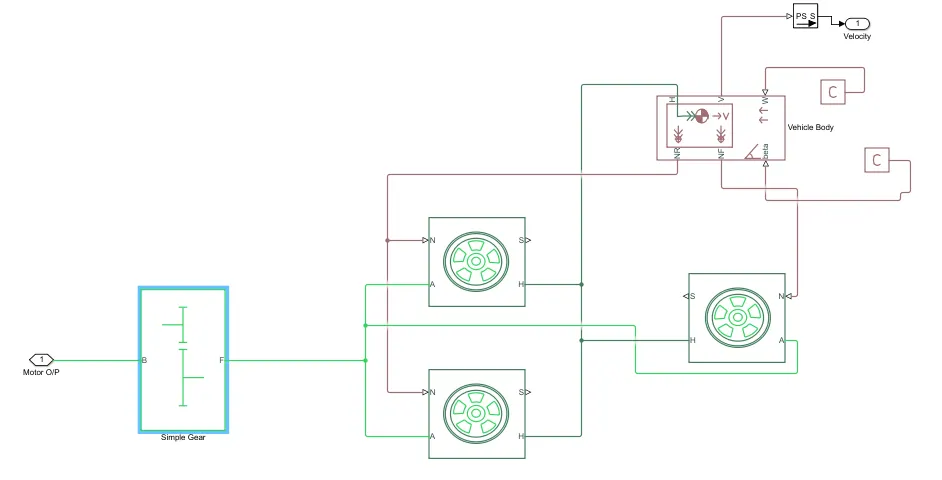
Vehicle System
Tire :
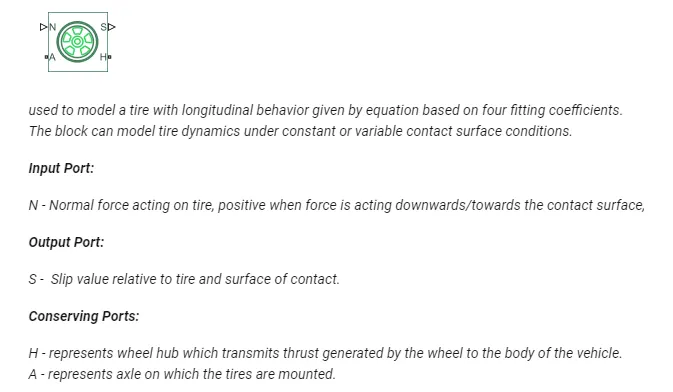
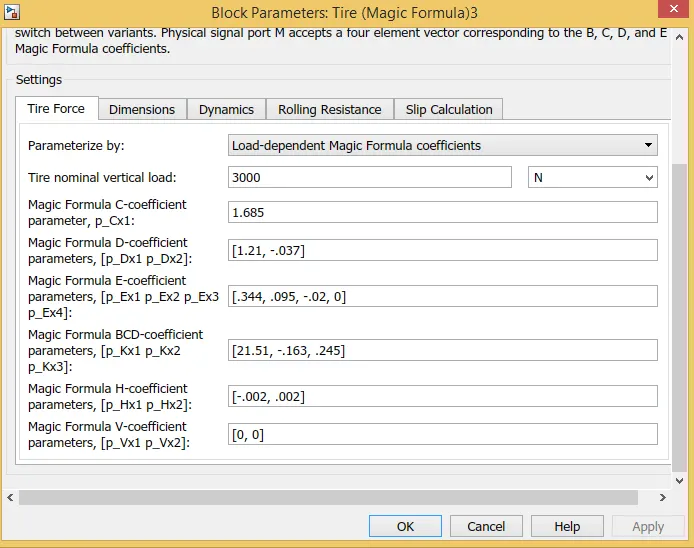
Tire Parameters :
Rolling Resistance considered : 0.0183
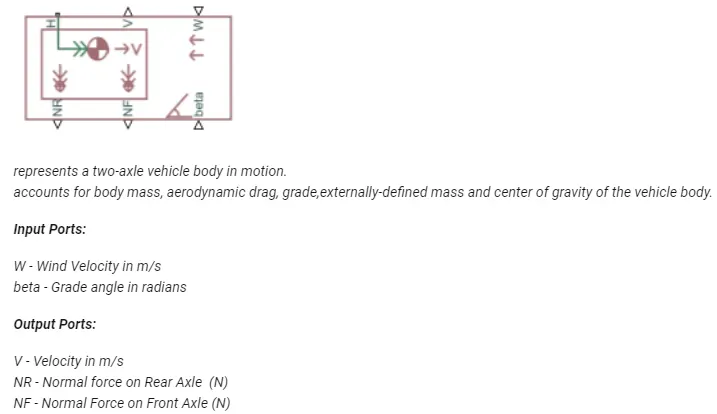
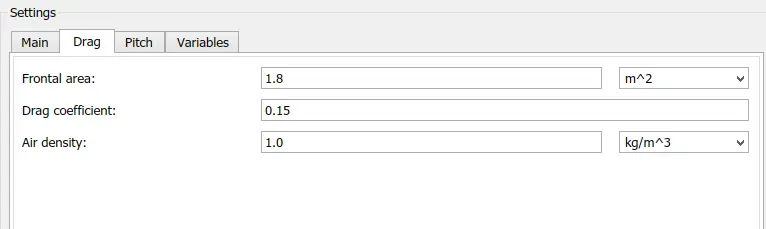
Vehicle Body :
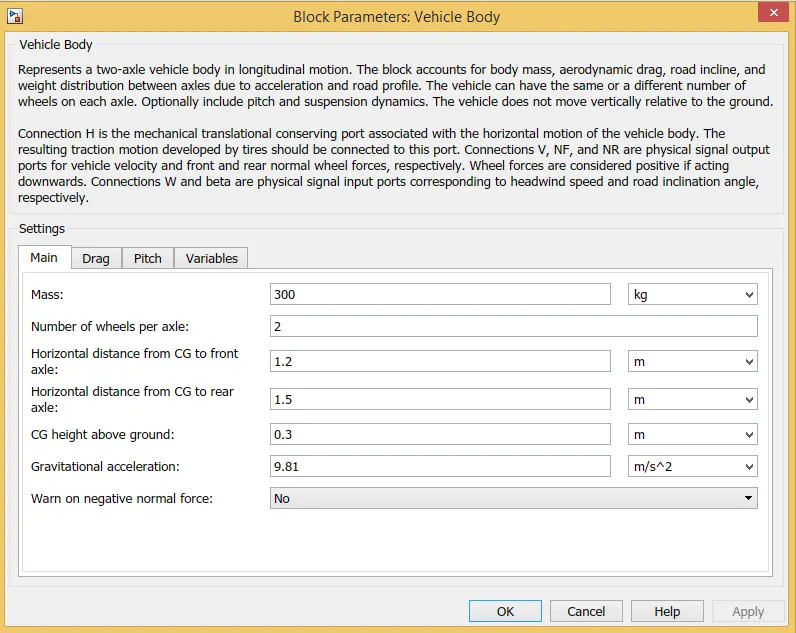
Vehicle Body Parameters :
Vehicle Mass : 300 kg
Frontal Area : 1.8 m^2
Drag Coefficient : 0.15
Air Density : 1 kg/m^3
Gravitational Acceleration : 9.81 m/s^2
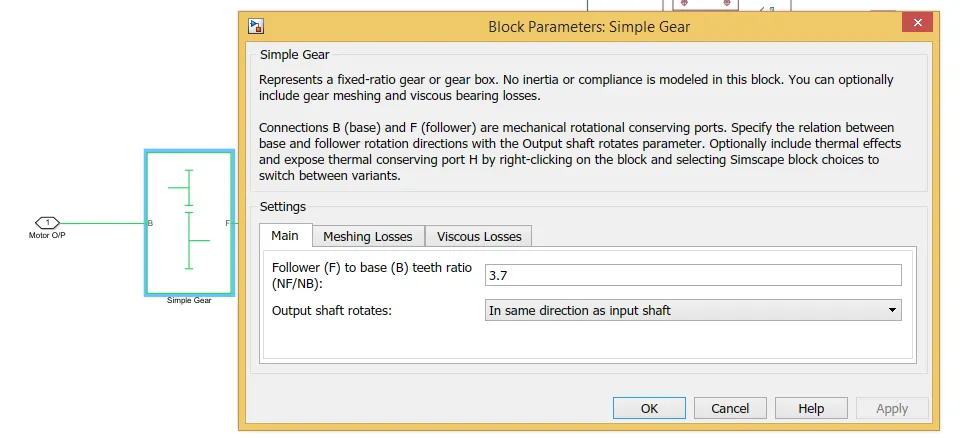
Simple Gear & its Parameters

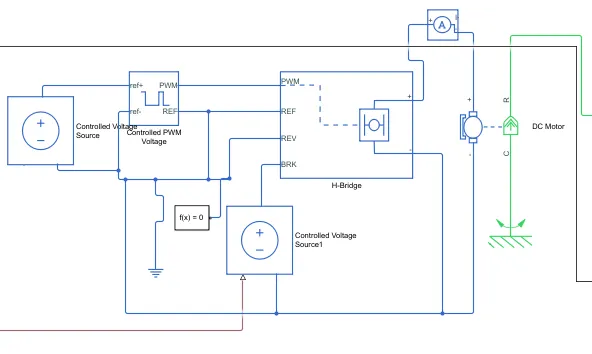
Motor & Power Control System :
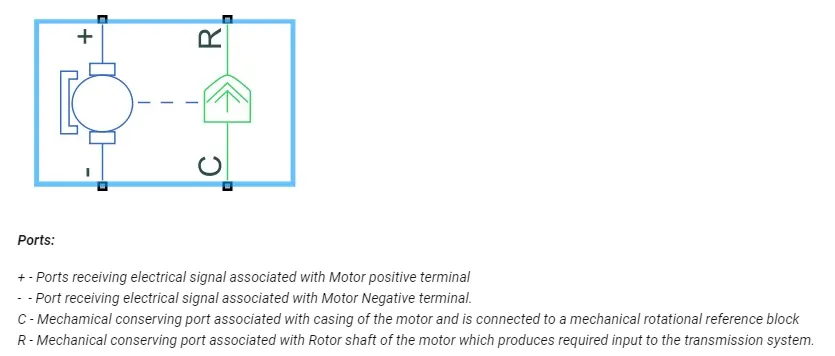
DC Motor :
DC Motor Parameters :
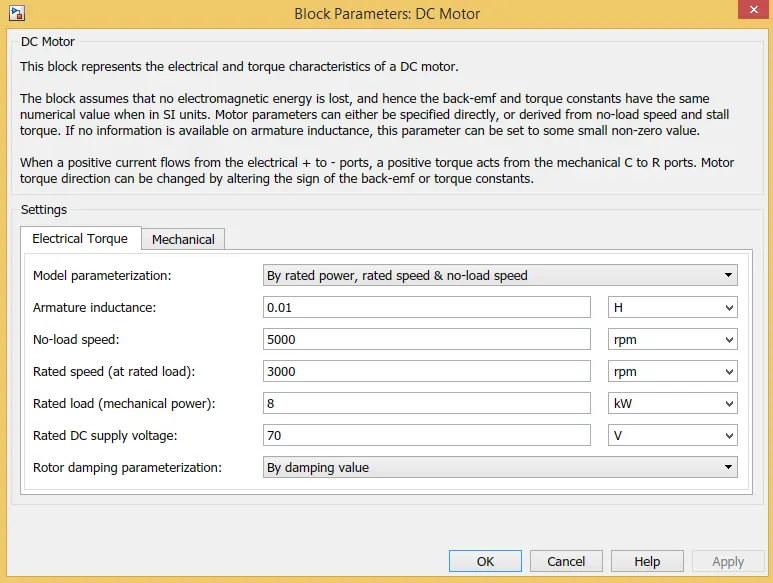
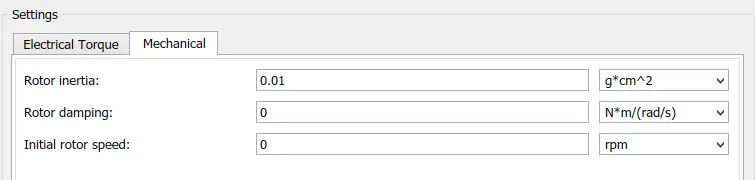
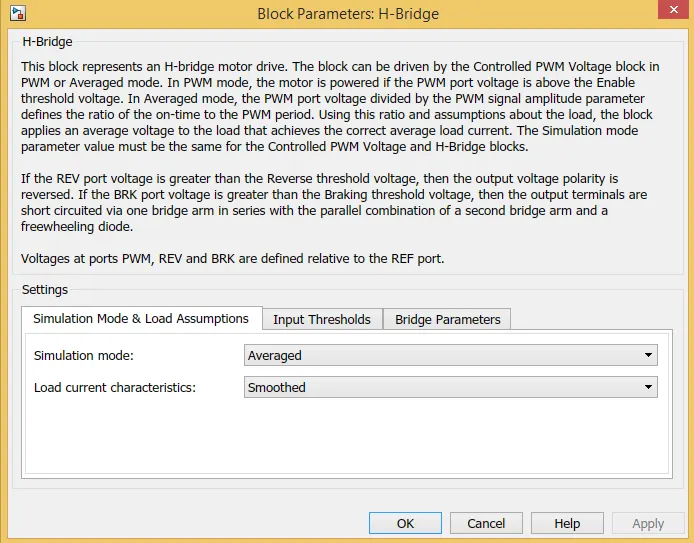
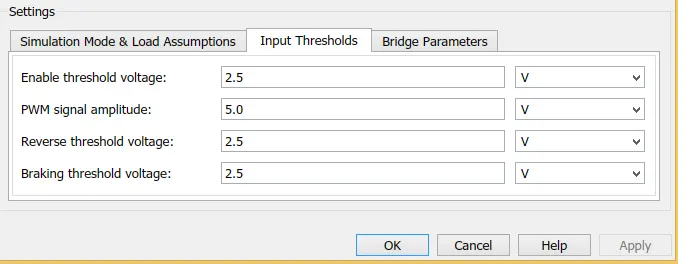
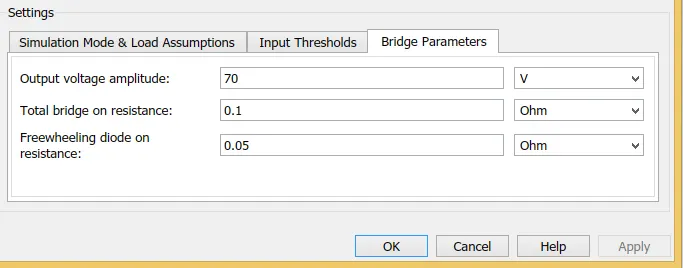
H Bridge :
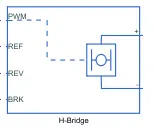
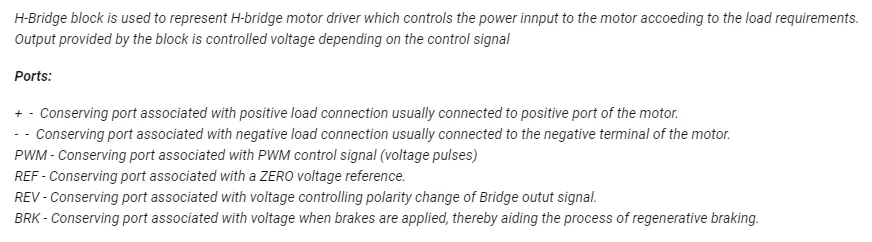
H Bridge Parameters :
Controlled PWM Voltage :
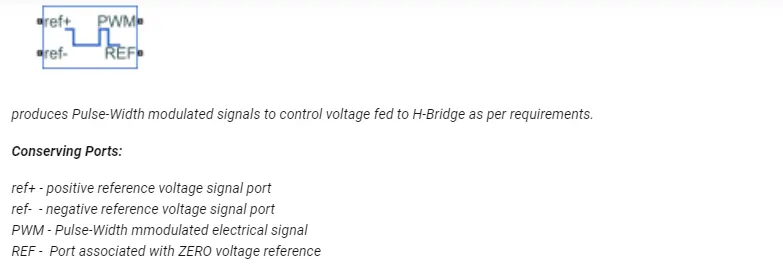
Controlled PWM Voltage Source Parameters :
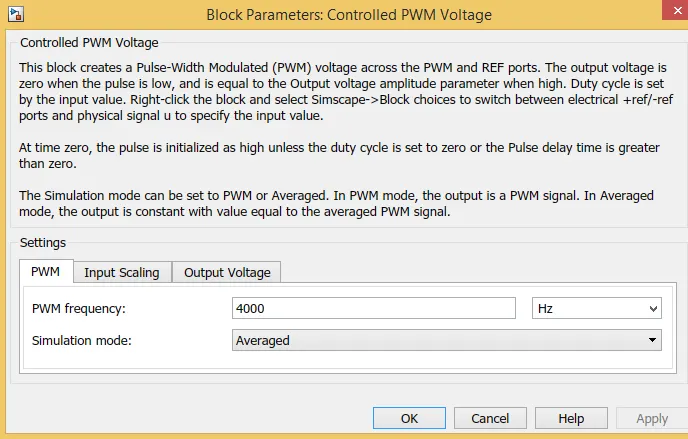
Controlled Voltage Source :

Solver :

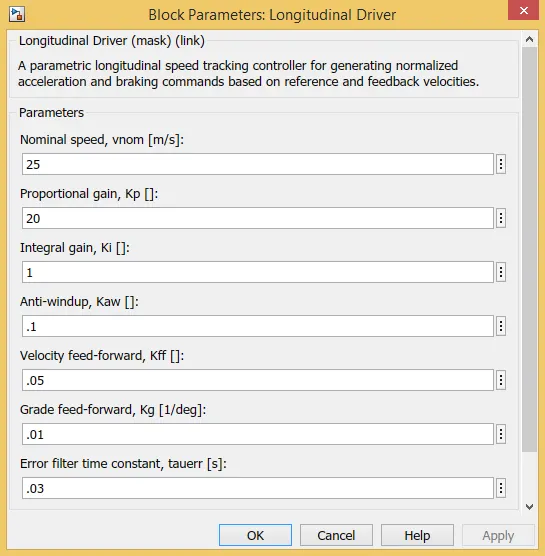
Longitudinal Driver :
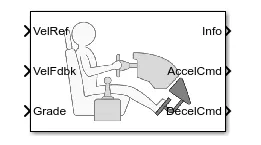
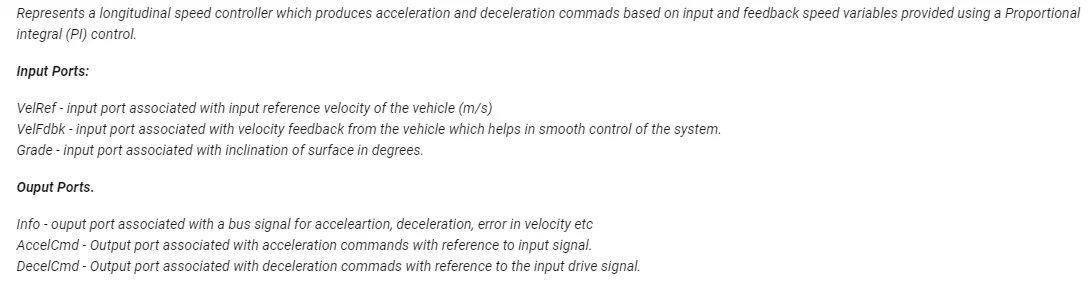
Longitudinal Driver Parameters :
Battery System :
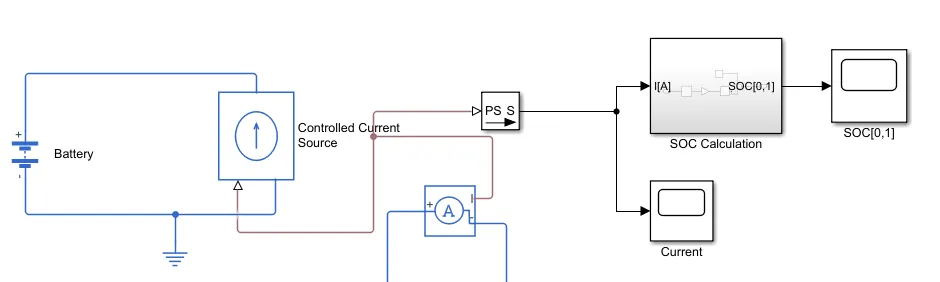
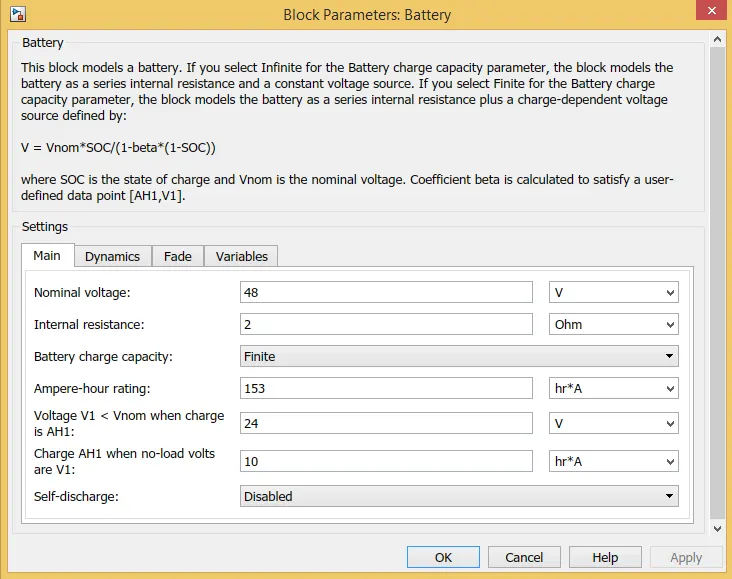
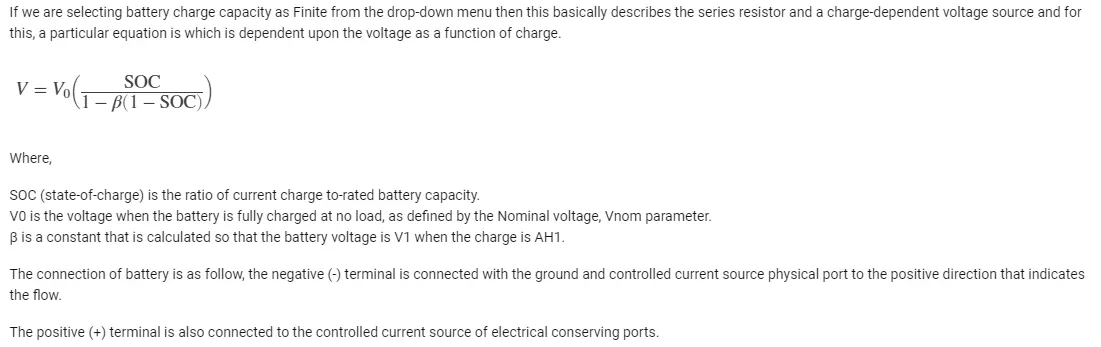
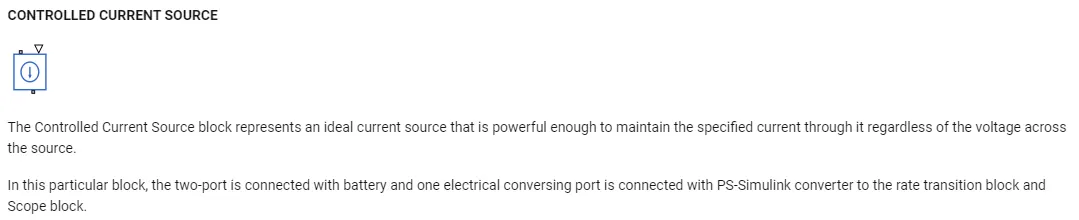

SOC Calculation Block
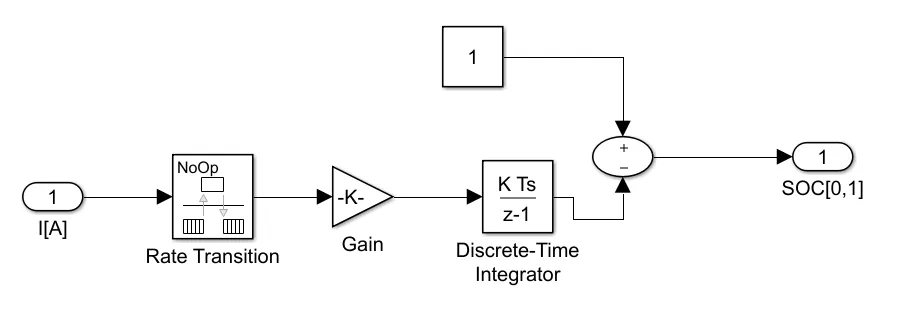
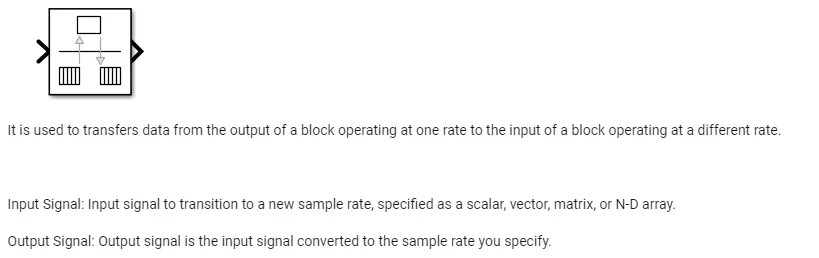
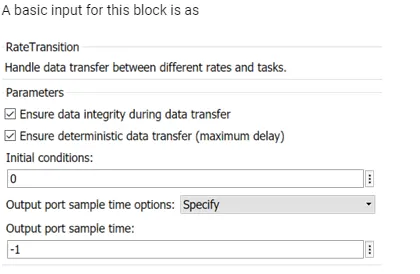
Rate Transition
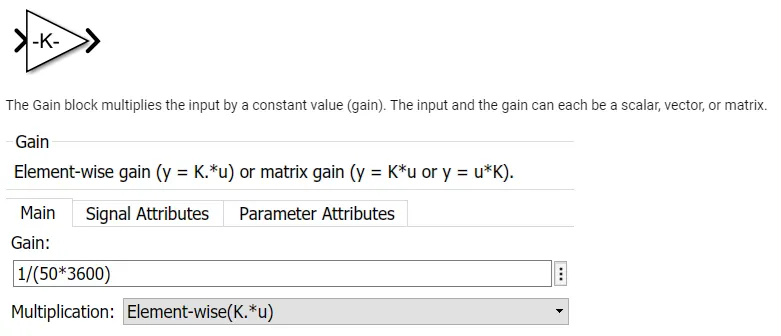
Gain Block
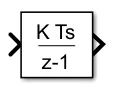
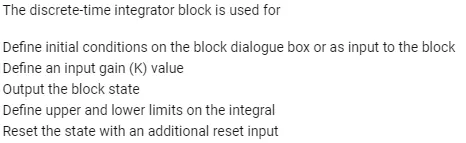
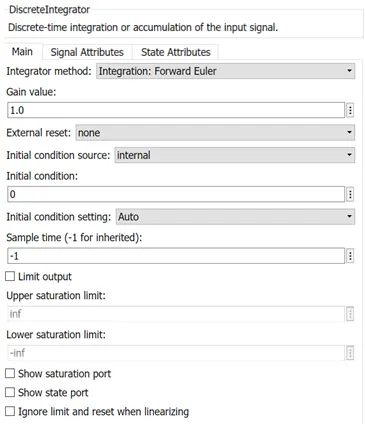
Discrete Block
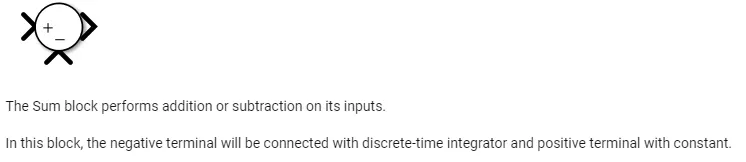
SUM Block
Output Block :
Output
1) FTP75 Drive Cycle
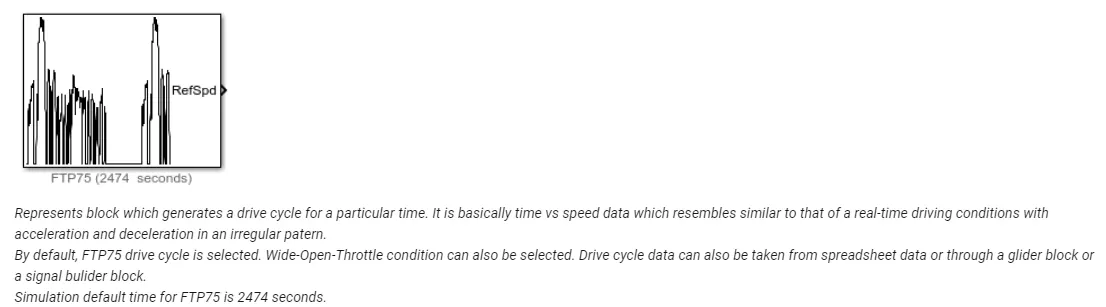
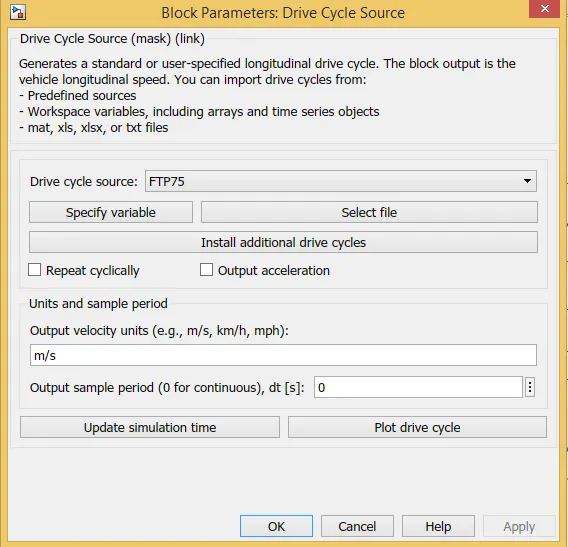
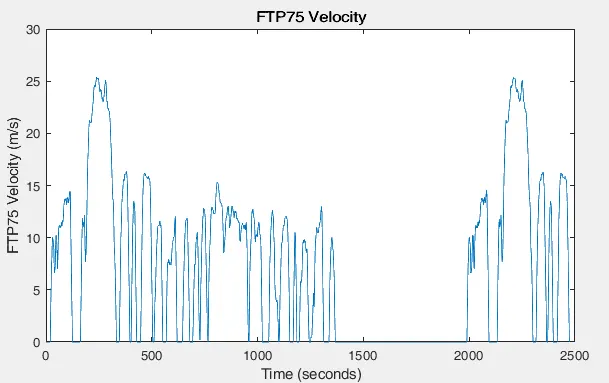
Simulation Time: 2474 seconds
Distance Travelled: 5.5 m/s or 20 Km
The reference velocity of vehicle (Yellow curve) almost matches with the actual velocity of vehicle (Blue Curve) with the max speed of around 25 m/s as shown in fig.1.1. This small deviation is due to the inertial effect & its control parameter.
Fig.1.2. shows the detailed view of how the close the reference speed matches the actual speed from 100-500 seconds
Fig.1.3. shows the variation in the current. As the speed increases more current is drawn from the battery. The current curve reaches the negative value during regenerative braking which draws current for the Battery to charge.
Fig.1.4. shows the SOC of the Battery. For 2474 seconds the Battery reaches from 100 % to 60 %. Hence 40% Battery is consumed for the vehicle to travel for around 5.5 m/s or 20 Km. Also there is rise in SOC curve at some points due to the regenerative braking that charges the Battery.
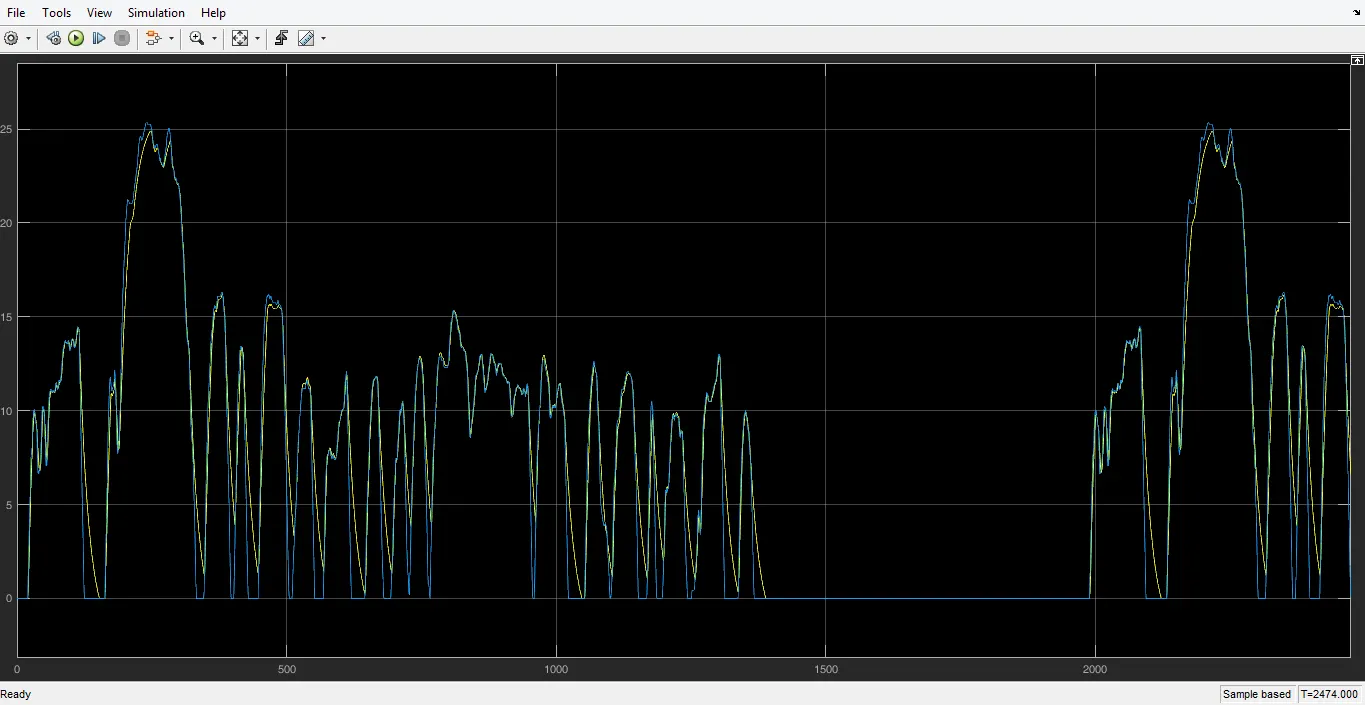
Fig.1.1. Speed Curve
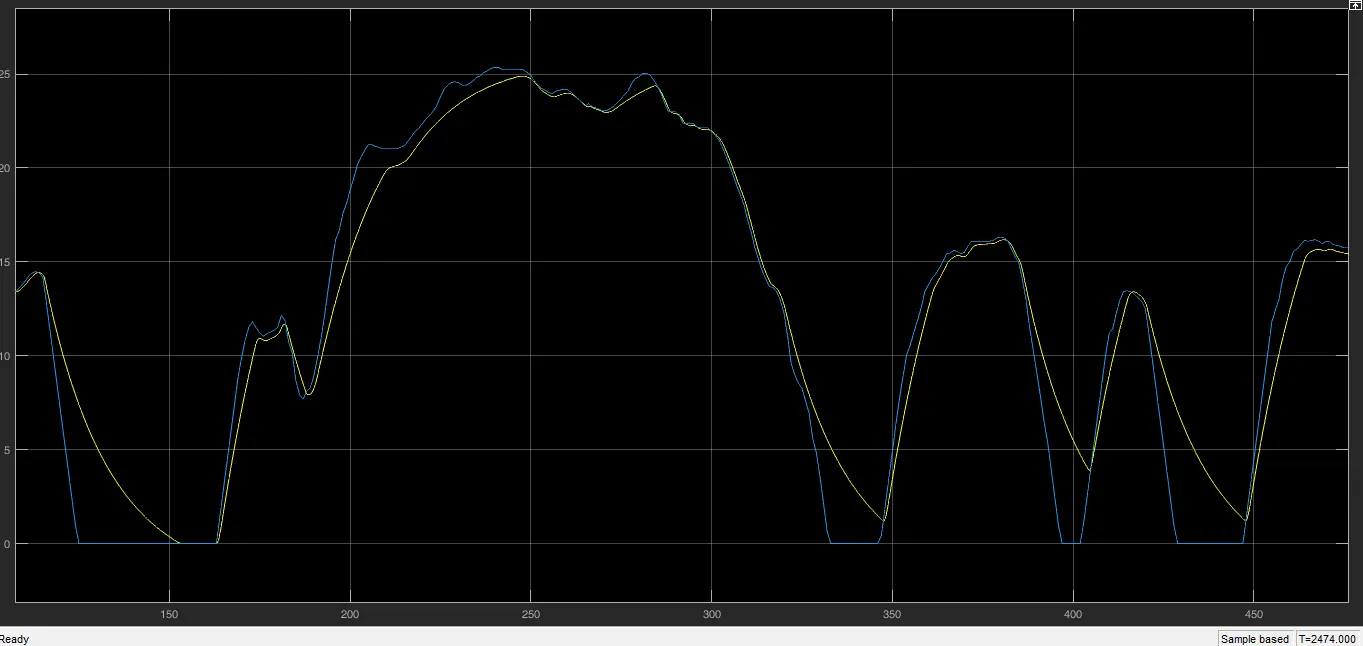
Fig.1.2. Speed Curve (Zoomed View)
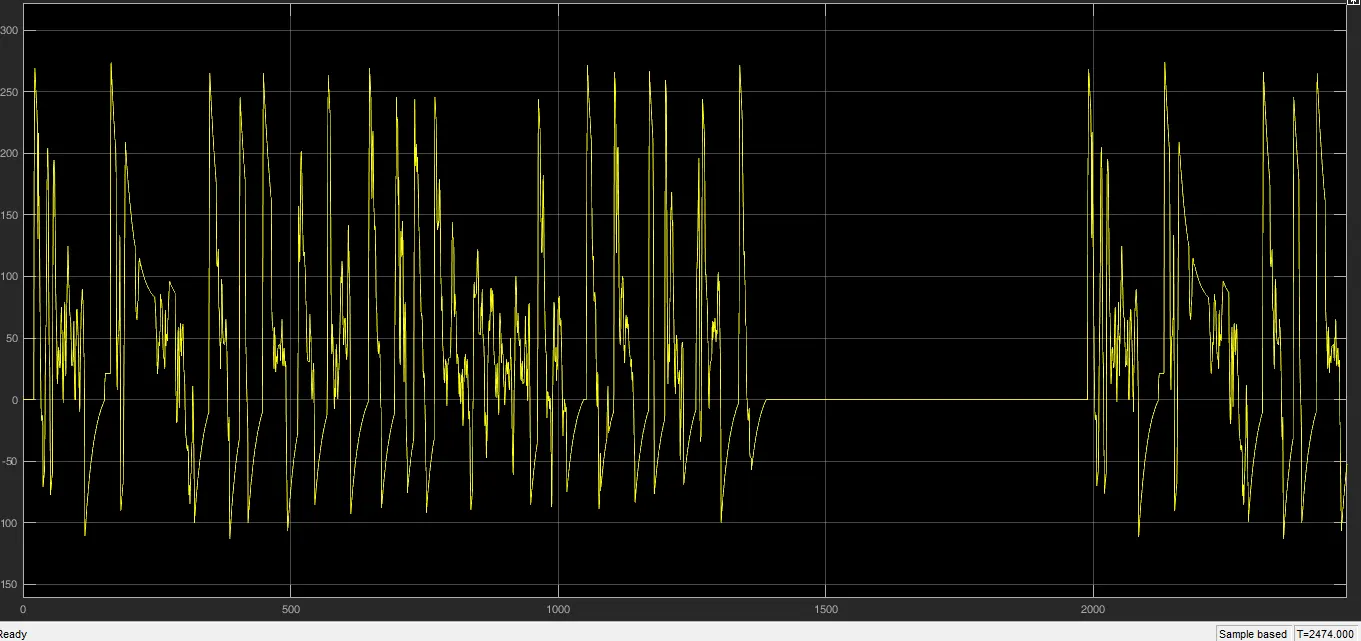
Fig.1.3. Current Curve
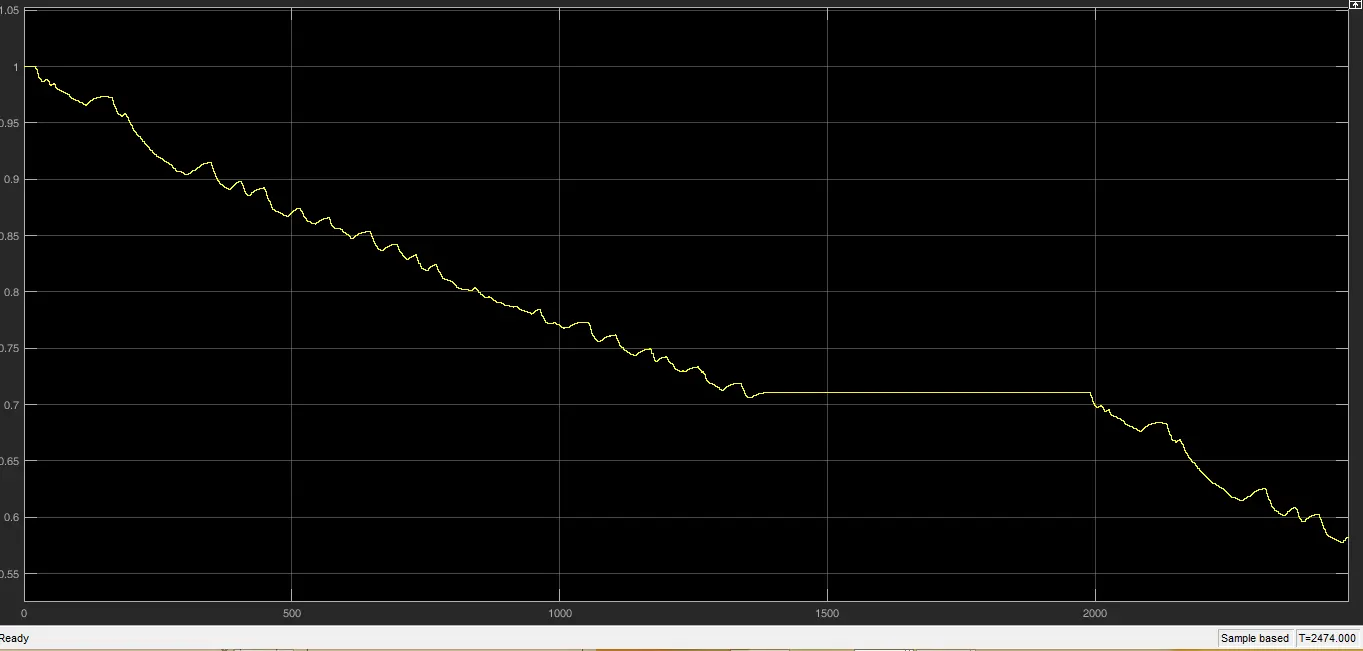
Fig.1.4. SOC of Battery
2) Wide Open Throttle
Simulation time : 60 seconds
Distance Travelled : 0.150 m/s or 0.5 kmph
In WOT Condition we could see in fig.2.3. that the reference speed curve definitely doesn't match with the Vehicle actual speed.
In fig. 2.4. The current curve has reached negative value which indicates that the current is being drawn to charge the battery. The regenerative braking has enabled the battery to get charged similarly,
In fig.2.5. The SOC of the battery has reached 100% - 98% in 20 seconds, but due to regenerative braking the SOC has increased gradually from 98% - 98.7 %
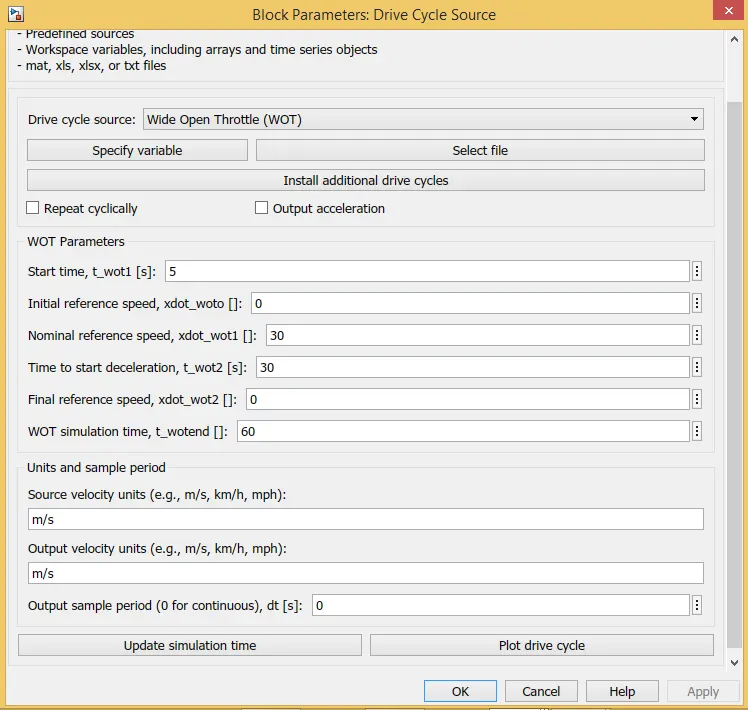
Fig.2.1
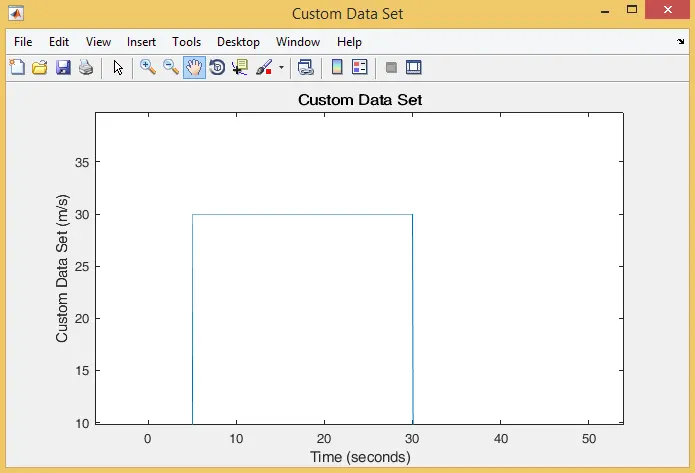
Fig.2.2. Drive cycle Data
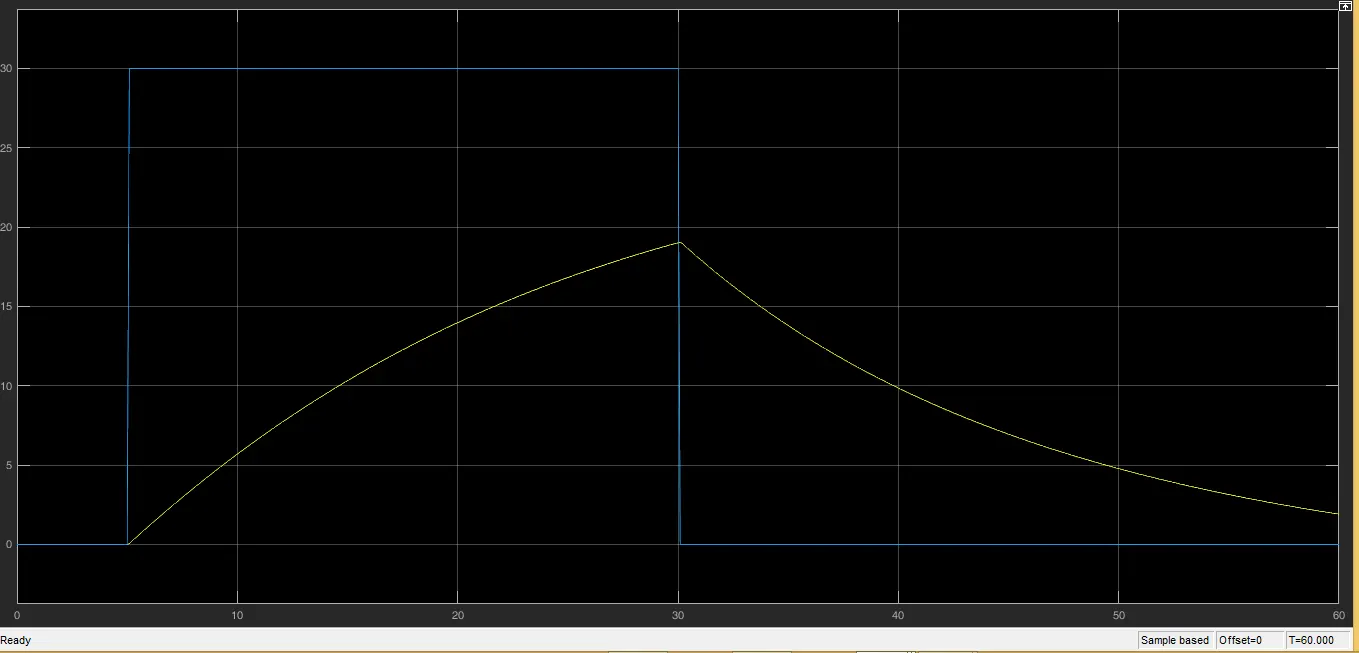
Fig.2.3. Speed Curve
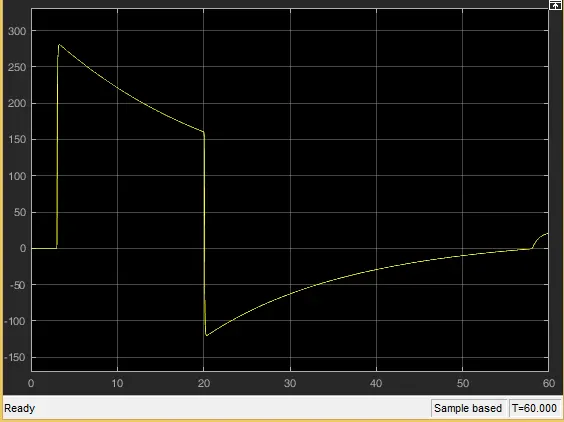
Fig.2.4. Current Curve
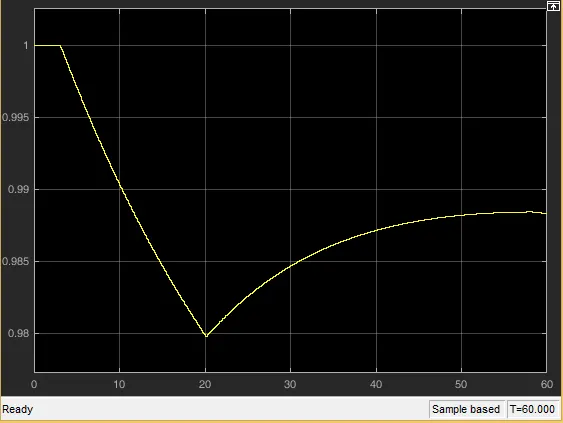
Fig.2.5. SOC of Battery
Conclusion
As per the Motor specification, Type of controller, Vehicle Parameters & Battery used we could see that the reference speed almost matches with the vehicle speed for the drive cycle FTP 75 whereas for WOT condition it doesn't. Hence we have to further change the parameters of the system and try simulating to achieve the results.
The Parameters that can be changed / Improved:
1) Detailed simulation rather than performing averaged mode simulation
2) Optimization of Battery pack for increased mileage and peak performance
3) Optimization in the vehicle parameters such as vehicle mass, Front Area, Drag, Tire design etc
4) Better Motor characteristics or Motor such as BLDC motor, which reduces the losses produced from brushes and better efficiency. Hence Better motor power and Torque can be achieved
5) Use of actual PID Controller system rather than basic PWM signal generator block. This enables us to tune the system accordingly and brings down the error.
- Shikhar SaraswatExcellent project and it's report. Just a small add on if you can summarize or conclude your results in 4 slides instead of writing a very descriptive report. Recruiters will be able to get an easier picture of your capabilities. Good Luck...!!