Effect of velocity and drag co-efficient on drag force
Objective:
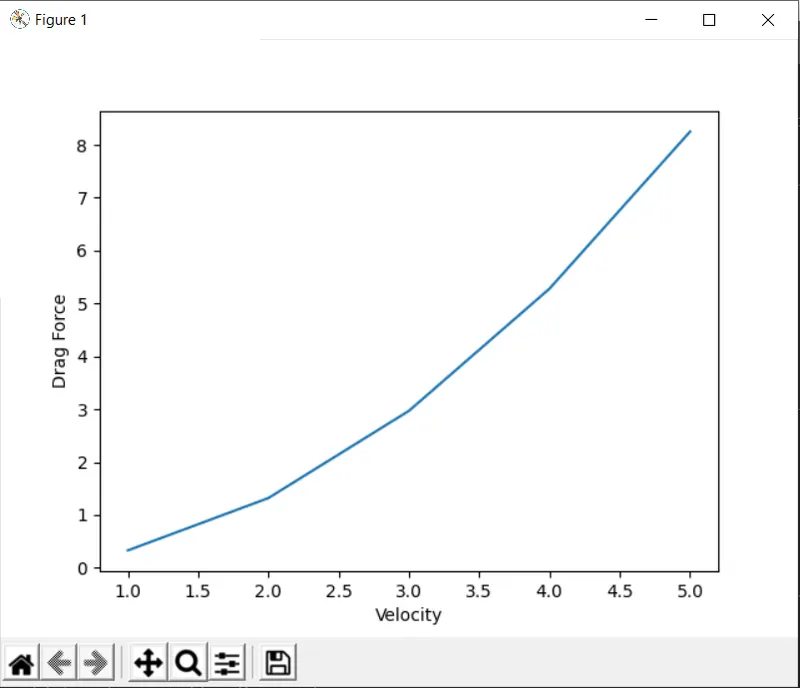
- Write a program to plot Drag force vs Velocity.
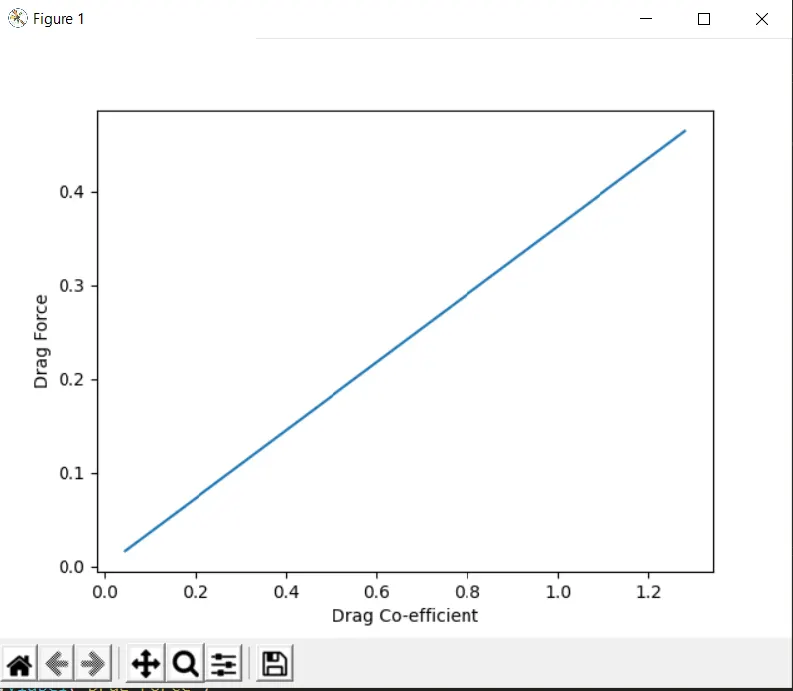
- Write a program to plot Drag force vs Drag Co-efficient
Problem Statement:
- The effect of increasing velocity (Bicycle start to full speed) on the Drag force experienced by the rider
- The effect of Drag Co-efficient (with the same frontal area) on the Drag force experienced by the rider
Solution Procedure:
For Part 1:
A python program has been made with the values of drag coefficient (for upright position), frontal area and air density predefined and keeping them as constant.
We have to calculate the drag forces corresponding to each velocity from start to full speed and hence have defined the velocity as a list with the velocity ranging from 1m/s to 5m/s.
Then, a function has been defined to calculate the drag forces.
As the drag forces has to be calculated based on different values of velocity, I have used a for loop to provide the values of velocity to the function.
After that, the function gives out the list for the drag forces. And finally using the commands from matplotlib module, have plotted the values.
import math
import matplotlib.pyplot as plt

#cycle velocity in m/s
velocity=[1,2,3,4,5]
#Dragfoces in kg.m/s^2 to be calculated corresponding to each value of velocity to be stored in this list
dragforces=[]

#function to calculate dragforces where v is defined as int type to take in the value of v[i] & dragforces as a list
def df_calc(v,dragforces):

	  #density of air in Kg/m^3
	  rho=1.2
	  #Frontal Area for upright position in m^2
	  A=0.5
	  #value of Drag Coefficient (unitless)
	  cd=1.1

	  #calculate dragforce corresponding to every v and store it in dragforces
	  dragforces.append(0.5*rho*A*cd*v*v)

	  return(dragforces)


#a for loop to provide the function every value of velocity
for i in range(0,5):
  #dragforces is used to call the function and store the value of the output of the function
  dragforces=df_calc(velocity[i],dragforces)

#plotting dragforce vs velocity
plt.plot(velocity,dragforces)
plt.xlabel('Velocity')
plt.ylabel('Drag Force')
plt.show()
For Part 2:
A python program has been made with the values of velocity, frontal area and air density predefined and keeping them as constant.
We have to calculate the drag forces corresponding to each drag co-efficient and hence have defined the drag co-efficient as a list with it ranging from 0.045 to 1.28.
Then, a function has been defined to calculate the drag forces.
As the drag forces has to be calculated based on different values of drag co-efficient, I have used a for loop to provide the values of drag co-efficient to the function.
After that, the function gives out the list for the drag forces. And finally using the commands from matplotlib module, have plotted the values.
import math
import matplotlib.pyplot as plt

#value of Drag Coefficient based on different shapes (unitless)
cd=[0.045,0.07,0.3,0.5,1.14,1.28]

#Dragfoces in kg.m/s^2 to be calculated corresponding to each value of velocity to be stored in this list
dragforces=[]

#function to calculate dragforces where v is defined as int type to take in the value of v[i] & dragforces as a list
def df_calc(c,dragforces):

	  #density of air in Kg/m^3
	  rho=1.2
	  #Frontal Area for upright position in m^2
	  A=0.5
	  #cycle velocity in m/s
	  velocity=1.1

	  #calculate dragforce corresponding to every cd and store it in dragforces
	  dragforces.append(0.5*rho*A*c*velocity*velocity)

	  return(dragforces)


#a for loop to provide the function every value of velocity
for i in range(0,6):
  #dragforces is used to call the function and store the value of the output of the function
  dragforces=df_calc(cd[i],dragforces)

#plotting dragforce vs velocity
plt.plot(cd,dragforces)
plt.xlabel('Drag Co-efficient')
plt.ylabel('Drag Force')
plt.show()
Results and Discussion:
For Part a:
As per the graph of drag force vs velocity, it has been found that drag force varies parabolically with respect to velocity.
For Part b:
As per the graph of drag force vs drag co-efficient, it has been found that drag force varies linearly with respect to drag co-efficient.