Data Analysis using Python Programming.
AIM:
Write a program in python to create a data visualizer tool.
COMPATABILITY CHECK:
The code should exit gracefully , if a non-compatible file is provided as an input. It should say "File not recognized" or please provide a valid Convergence File.
Data file : https://drive.google.com/file/d/1YN5M4yaDVEvjUS3z9PElYpbBJkwbIAGy/view?usp=sharing
DATA VISUALIZER:
The script should take column numbers as the input and the plot the respective columns as separate images.Each file should be saved by the name of the column. The plot labels should extracted from the file.
BASIC PERFORMANCE CALCULATION:
1. Calculate the area under the P-V diagram where , P is in column 2 and V is in column 8.
2. Calculate the power output of this engine . Assume that RPM is 1500.
3. The engine consumed 20 micro grams of fuel (per 1 stroke cycle). Calculate its specific fuel consumption.
EXPLANATION OF THE CODE:
1. First we import all the necessary libraries. We are using the math , matplotlib and the numpy module respectively to proceed with the code.
2. For the compatibility check, we are using the try & except method available in python. File opening is done and we are reading the data containing in the file using the 'r' mode. Except command is used in order to check whether the file exist in the python file in the computer.
3. If the data file doesnt exist, it returns a statement "File not recognozed. Please provid a valid CONVERGENCE output file.
4. Here we use a keyword called enumerate as it assigns the values for each line and are stored in the variable 'i'. To read and append the column we used the if statement '#' in line for removing the heading in the data file used. We are providing counter variables i,j and assigning the values as '0' at the beginning. On each loop they are incremented. Using this command, we are reading and storing the values of the file in a variable 'c'.
5. Similarly we are doing the same with variable as 'b' to store the row values of the datafile.
6. Visualizing the data is done by assigning values to variables for the specific row and column required such as x = 1 (crank) , y =8 (Volume). These numbers are then assigned to the array 'c' which contains the data of the file. Variable 'xname' is assigned to array c[x], were x = to the number which is assigned to it.
7. 2 empty arrays are created to append the repective data from 'engine_data .out'. Using the for loop we are reading the file using the read command . We are checking only the numeric data this time. Hence we are using the if statement " if '#' not in line" to take only the numeric values required.
8. Since the values in the data file given are float, we are appending each values of the file into the empty array using the command "xdata.append(float(line.split()[x-1]))". We are using [x-1] since the position of crank in the data file is '0'. Hence we are providing [x-1].
9. For plotting the data, we are using the matplotlib.pyplot module. We are plotting a graph against xdata and ydata that is collected from the file. We are using the command plt.xlabel(c[x]) since it contains the name of the data being plotted here. The same is done for y axis using plt.ylabel(c[y]).
10. According to the problem statement, we are using the trapz function provided in python to calculate area under a particular graph.To calculate area under the pv curve we use : np.trapz(pressure,volume) where trapz is a definite integral as approximated by trapezoidal rule , which is used to calculate area under given x and y locations.
11. We are using the following formulas to calculate the power consumed by the engine and the specific fuel consumed by the engine.
`power = frac{2cdotpicdotareacdot1500cdot1000}{60}`
specific fuel consumption = `frac{fuel}{power}`
SFC = `frac{3600cdot20e-6cdot1500}{60cdotpower}`
We are using the SFC formula to find fuel consumed for 20 micrograms of fuel used.
PYTHON CODE:
""" PROGRAM TO PERFORM DATA ANALYSIS """

import math
import matplotlib.pyplot as plt
import numpy as np


# COMPATABILITY CHECK

try :
	open('engine_data .out','r')
except :                                                    	# if the output displays FileNotFoundError then we print the below
	print('File not recognized. Please provide a valid CONVERGE output file.')


# DATA VISUALIZER
i = 0                                                           # Counter variable is assigned as 'i'
j = 0                                                           # Counter variable is assigned as 'j'

file_name = open('engine_data .out','r')                        # opening and reading the file
for i,line in enumerate(file_name):                             # enumerate keyword stores assigned values in the 'i' variable
     if '#' in line :
     	if i == 2 :                                             # Providing a loop constraint
     		c = line.split()                                    # Storing name of data in variable 'c'


file_name = open('engine_data .out','r')                        # opening and reading the file
for j,line in enumerate(file_name):                             # enumerate keyword stores assigned values in the 'j' variable
	if '#' in line:
		if j == 2:                                              # Providing a loop constraint
			b = line.split()                                    # Storing name of data in variable 'b'


# DATA VISUALIZER

x = 1                                                      		# CRANK
y = 8                                                      		# VOLUME
xname = c[x]                                               		# Storing the name of data in 'xname' in c[x]
yname = c[y]                                               		# Storing the name of data in 'yname' in  c[y]
xdata = []
ydata = []

for line in open('engine_data .out','r'):                   	# feeding data into the file name arrays
      if '#' not in line:
     	 xdata.append(float(line.split()[x-1]))             	# appending the data into the specific file name
     	 ydata.append(float(line.split()[y-1]))


# GRAPH PLOTS FOR CRANK ANGLE AND VOLUME

plt.plot(xdata,ydata,color='blue',linewidth=3)
plt.xlabel(c[x])
plt.ylabel(c[y])
plt.savefig('Crank vs volume')
plt.show()

# INPUTS FOR PV GRAPH

x = 2                                                      		# PRESSURE
y = 8                                                      		# VOLUME
x_name = b[x]                                                   # storing the name of the required data in 'x_name' in 'b[x]'
y_name = b[y]                                                   # storing the name of the required data in 'y_name' in 'b[y]'
x_data = []
y_data = []
for line in open('engine_data .out','r'):                       # opening the file and reading the data in it.
	if '#' not in line:
		x_data.append(float(line.split()[x-1]))                 # appending the assigned values into the empty array.
		y_data.append(float(line.split()[y-1]))

# GRAPH PLOTS FOR PRESSURE AND VOLUME

plt.plot(y_data,x_data,color='red',linewidth=3)                 # Using matplotlib module to plot the data as graph
plt.xlabel(b[x])
plt.ylabel(b[y])
plt.savefig('pressure vs volume ')                               # Using savefig command to save the image.
plt.show()


# BASIC PERFORMANCE CALCULATION

area = np.trapz(x_data,y_data)                                 # Using the trapz function which is a part of numpy module to find area/
print('Area under the PV curve = ',area*pow(10,6),'J')                   # Area of PV curve is in Joules.

power = 2*math.pi*area*1500*1000/(60)                          # Using the power formula to calculate power consumed by the engine.
print('Power = ',power,'KW')
sfc = (3600*20e-6*1500)/(60*power)                             # Using specific fuel consumption formula to find fuel consumed for 20 micrograms.
print('Specific fuel consumption = ',sfc,'gram/KW*hr')
OUTPUT GRAPH OBTAINED:
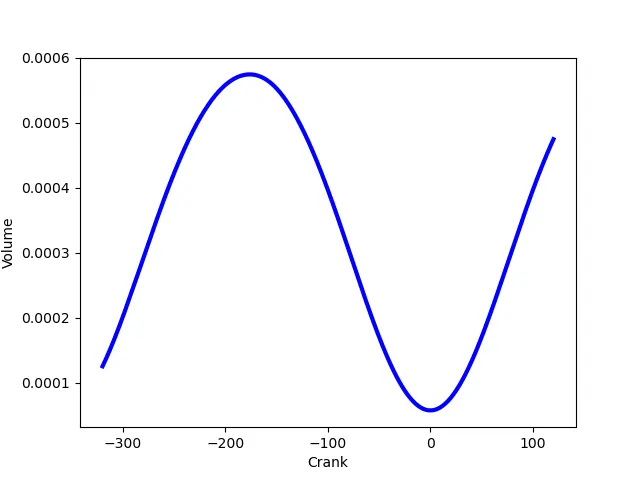
CRANK VS VOLUME
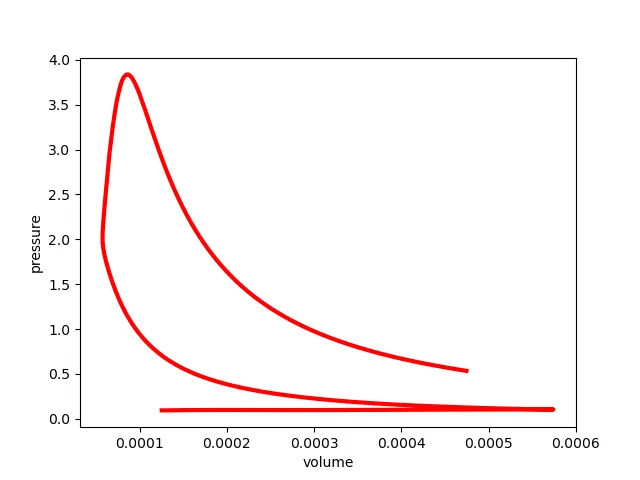
PRESSURE VS VOLUME
OUTPUT RESULT OBTAINED:
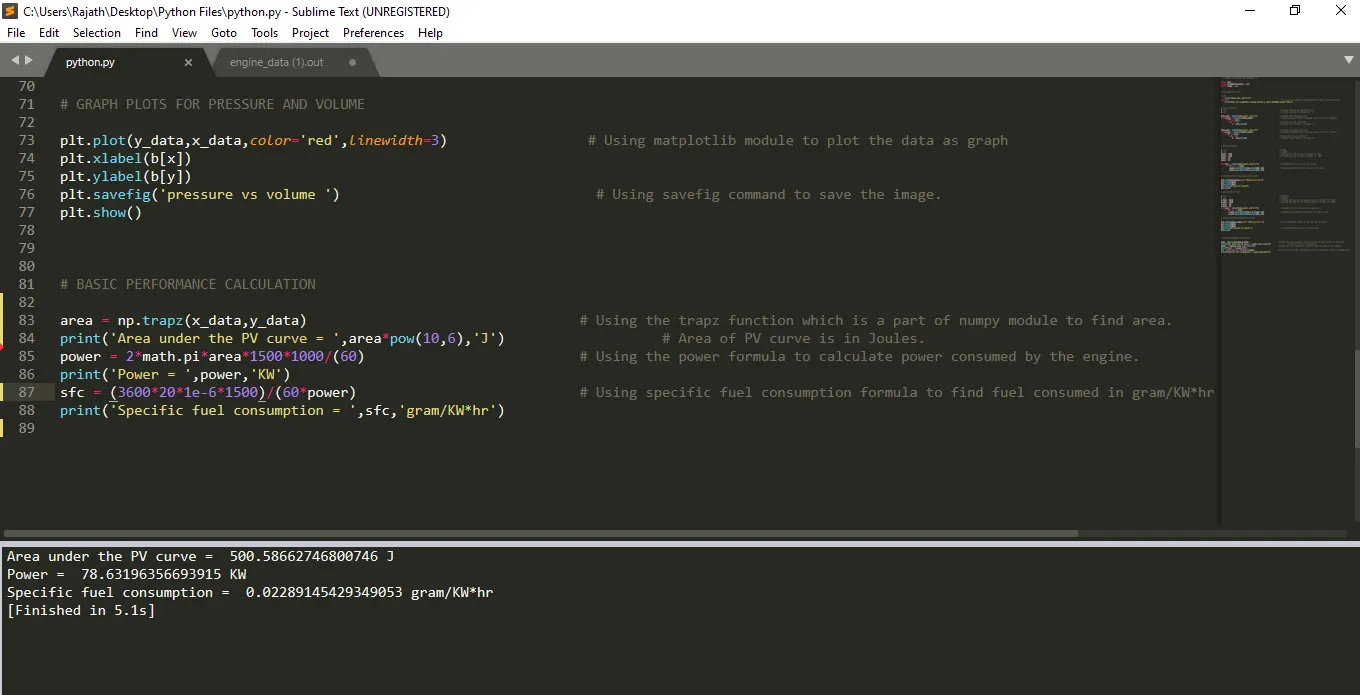
We get Area under the PV curve = 500.5866 J
Power consumed by engine = 78.63 KW
Specific fuel consumption = 0.022891 gram/KW*hr
ERRORS FACED:
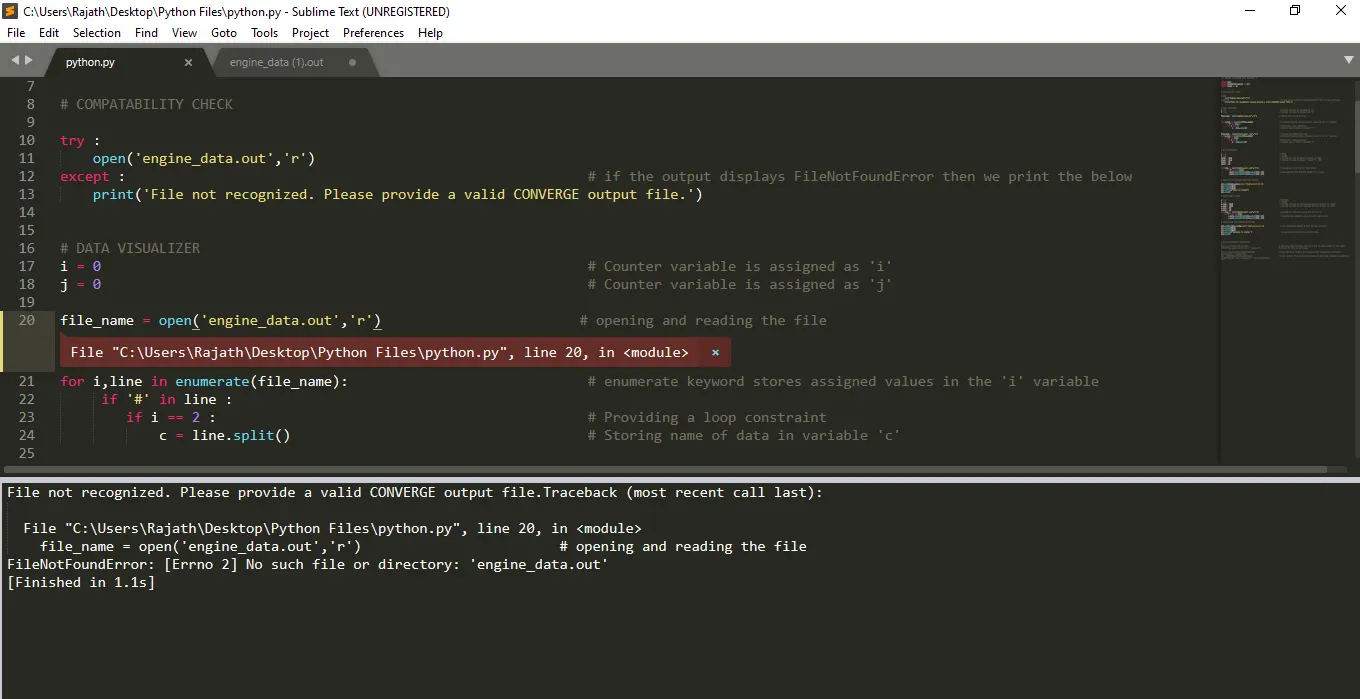
Since the file existing in the python folder is assigned a different name. We are getting this error.
RESULTS & CONCLUSION:
From the above report we can conclude that the area under the PV curve is found , the power at 1500 rpm is calculated and the amount of specific fuel consumed is also calculated.