Data Analysis using Python
Aim:
1) To write a code for Data Analysis using python.
2) Script should take column numbers as the input and plot the respective columns as separate images, each file should be saved by the name of the column and the plot labels should be extracted from the file.
3) Code should exit gracefully, if a non-compatible file is provided as an input. It should say something like "File not recognized. Please provide a valid CONVERGE output file".
4) Calculating the area under the P-V diagram, Calculating the power output of this engine by assuming that RPM is 1500 and engine consumed 20 micro grams of fuel (per 1 stroke cycle) with this calculate its specific fuel consumption.
Theory:
Parsing:
Parsing in computer languages refers to syntactic analysis of the input code into its components parts in order to facilitate the writing of compilers and interpreters. It can be used to describe split or separation. Parsing a file means reading in a data stream of some sort and building an in memory model of the semantic content of that data. This aims at facilitating perfoming some kind of transformation on the data.
Procedure:
Full Code:
# Data Analysis in Python

import numpy as np
import matplotlib.pyplot as plt
import sys

def extract_data(data, column_X, column_Y):
	X = []
	Y = []
	name_X = []
	name_Y = []
	unit_X = []
	unit_Y = []
	ct = 1
	for line in data:
		if '#' not in line:
			X.append(float(line.split()[column_X - 1]))
			Y.append(float(line.split()[column_Y - 1]))
		if ct==3:
			name_X.append(line.split()[column_X])
			name_Y.append(line.split()[column_Y])
		if ct==4:
			unit_X.append(line.split()[column_X])
			unit_Y.append(line.split()[column_Y])

		ct = ct + 1

	return (X, Y, name_X, name_Y, unit_X, unit_Y)

def calculate_the_area(R, S):
	area = 0
	c = 8664
	dx = R[1] - R[0]
	for i in range(0,c):
		area = area + ((S[i+1] + S[i])*dx)/2
	return area

# Compatability check

try:
	data = open('engine_data.out','r')
	print('File opened sucessfully')
except FileNotFoundError:
	print('File is not recognized. Please provide a valid CONVERGE output file')
	sys.exit()

print('Crank ','Pressure ','Max Pressure ','Min Pressure ','Mean Temperature ','Max Temperature ','Min Temperature ','Volume ','Mass ','Density ','Integrated HR ','HR Rate ','C_p ','C_v ','Gamma ','Kin_visc ','Dyn_visc ')
print('Type the corresponding codes to get the particular parameter')
print('Crank = 1 ','Pressure = 2 ','Max Pressure = 3 ','Min Pressure = 4 ','Mean Temperature = 5 ','Max Temperature = 6 ','Min Temperature = 7 ','Volume = 8 ','Mass = 9 ','Density = 10 ','Integrated HR = 11 ','HR Rate = 12 ','C_p = 13 ','C_v = 14 ','Gamma = 15 ','Kin_visc = 16 ','Dyn_visc = 17 ')
a = int(input('Enter the value of X '))
b = int(input('Enter the value of Y '))
X, Y, name_X, name_Y, unit_X, unit_Y = extract_data(data, a, b)

# To Calculate the Area, Output Power and SFC

if name_X[0] == 'Volume':
	if name_Y[0] == 'Pressure':
		area = calculate_the_area(X, Y)
		area = area*(1e+06)                                  #Pressure is in mpa to convert mpa to pa
		print("Area under the curve is :",area,'m^2')
		power = (1500*area)/60000                            #power = area*N/60*1000 (KW) (Given RPM is 1500)
		print("The Output Power is :",power,'KW')
		specific_fuel_consumption = (20*(1e-06))/power       #specific_fuel_consumption = mass of fuel / power output
		print("The Specific Fuel Consumption is :",specific_fuel_consumption,"g/KWh")

plt.plot(X, Y,'r',linewidth = 2)
plt.xlabel(name_X[0] + ' ' + (unit_X[0]))
plt.ylabel(name_Y[0] + ' ' + (unit_Y[0]))
plt.title(name_Y[0] +' '+ 'Vs' +' '+ name_X[0])
plt.savefig(name_Y[0] +' '+ 'Vs' +' '+ name_X[0] + '.png')
plt.show()
1) We first import all libraries required for this coding like numpy, matplotlib and sys.
2) We then extract the data from engine_data.out file using the function and if commands.
3) We then, define a function to calculate the area under the curve.
4) We then, do the compatability check so as to import the correct file name into the system. If the file name isn't correct the system exits.
5) We then, provide input for plotting graphs by providing numbers to the parameters so that we can take input as number and print the output in form of a graph for Xaxis and Yaxis parameters.
6) Then, we calculate the Area, Power and Specific Fuel Consumption of the engine as outputs with the given input parameters like engine speed = 1500 rpm and mass of fuel = 20 micro grams.
7) We, finally plot the graph and save the graphs for the specified inputs given by the user when the program is executed.
Results and Discussion:
1) We first did a compatability check for whether the file name entered by us was correct or wrong. We executed the code and found that the file name was wrong and the system exited the code execution as shown in the image given below.

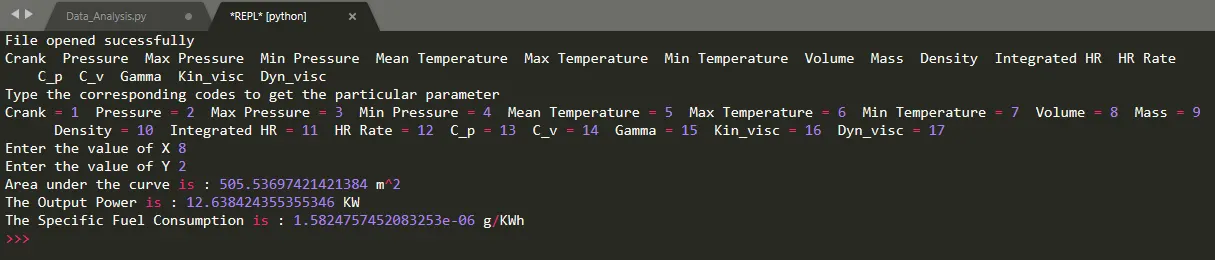
2) We then, corrected that error and executed the code again using the Sublime REPL tool. It executes the output of the code on the new text editor window just like the what command prompt does.
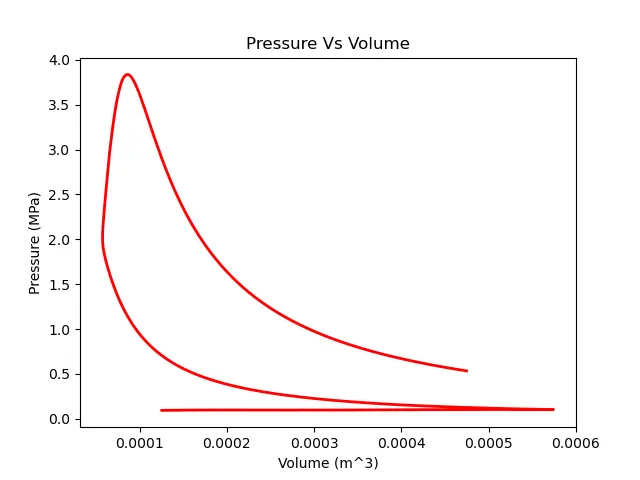
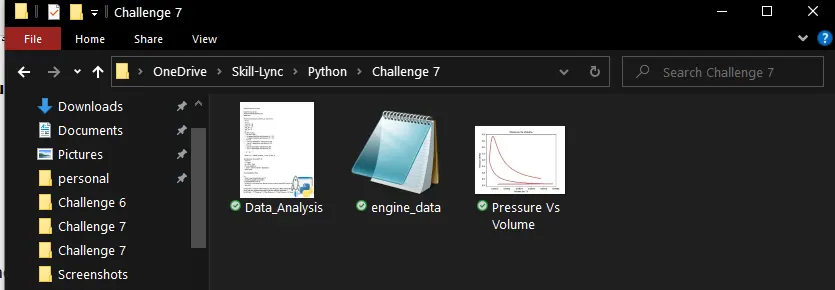
3) The executed code asks user to input the parameter required for both X axis and Y axis. Here, we take volume in x-axis and pressure in y-axis that's why we input no 8 and no 2 as inputs. It automatically calculates the Area, Power and Specific Fuel Consumption of the engine and gives the output. It also automatically plots graph for P-V Diagram and saves it with the name of pressure vs volume image file in the location were our code exists. The images show the executed result of the above code, P-V Diagram and file location were the image file is saved.
Conclusion:
1) We have written a code for Data Analysis in Python.
2) The code is executed with the Sublime REPL tool and the compatability check is done automatically, the user input for parameter selection for plotting graph is taken and automatically the Area, Power and Specific Fuel Consumption of the engine are calculated.
3) Finally, the graph automatically plotted and saved it with the name of the selected parameters as a image file in the location were our code exists.