Curve fitting using python programming
AIM:
To perform curve fitting in Python programming.
THEORY:
Curve fitting is the process of construction of a curve , or a mathematical functions , which possess the closest proximity of the real series of data. By curve fitting, we can mathematically construct the functional relationship between the obsereved dataset and the parameter values , etc. It is highly effective in the mathematical modelling of some natural processes.
PROBLEM STATEMENT:
1. Whate does popt and pcov mean.
2. What does np.array(temperature) do.
3. What does * in *popt mean.
4. Write code to fit a linear and cubic polynomial for the Cp data. Explain if your results are good or bad.
5. What needs to be done in order to make the curve fit perfect.
METHODOLOGY AND ALGORITHM:
1. At first we are defining all the necessary modules , we are using the matplotlib module for printing our output in the form of a graph. We are using the numpy module to create various values for temperature and cp. We are using the scipy module here to perform the curve fitting operation using the cuve_fit function to give us an optimized result.
2. Using the modules mentioned above , we are using these to write a program in python for cuve fitting of a given function.
3. In the program we are defining functions at the beginning which consist of the equation on which we are going to do curve fitting. Then we are defining another function called read_file() function to read the data for the values of temperature and cp from the file provided.
4. While reading the thermodynamic data file , we are defining the read_file() we are creating empty arrays temperature and cp. In order to read the data from the file , we are using a for loop for reading each line in the data . We are opening the data file and we are reading the files using the 'r' command. We are using the line.split() command to separate the data file with commas.
5. Since we separated the data with comma operator . It is separated by comma and is assigned in the form of an array. It is assigned as temperature as 0 index and cp value as 1 index. Python reads the file line by line and splits it where comma operator is encountered giving us as array for the following values of temperature and cp.
6. We are appending the following values in empty arrays of temperature and cp with respective index values . We are temperature.append(float(values[0]) because we are coverting a string into a float value.We are then returning the function to give us values of [temperature,cp].
7. We are then calling the read_file() command to read the values of temperature and cp which is stored into arrays using the function defined. Two parameters are passed called popt,pcov. The popt command is used since it contains the co-efficiencts of the polynomial which is defined and pcov is used since it contains the estimated covariance matrix. We are using calling the scipy module to perform curve_fit for the following(func,temperature,cp).
8. A variable is being passed called fit_cp which contains the function defined in the following order fit_cp = func(np.array(temperature),*popt) . The line defined here represents the function which is defined at the beginning. For the variable 't' , we are allocating the np.array(tempearature) for various values of temperature in the in the graph. The '*' in *popt is used to refer us to the coefficients of the polynomial defined. The fit_cp is used to calculate the values of cp for the function which is defined.
9. We are then plotting two graphs for actual data acquired form the data file and the calculated value for the equation defined at the beginning using the matplotlib module. We are using the legend command to represent each plot obtained with certain colors. We are using the plt.show() to show the output obtained.
PROGRAM FOR LINEAR POLYNOMIAL CURVE FIT:
#Program to do curve fitting using python programming

#Importing necessary modules
import math
import matplotlib.pyplot as plt
import numpy as np
from scipy.optimize import curve_fit

#Curve fit function
def func(t,a,b):
	return a*t + b

#Reading the thermodynamic data file
def read_file():
	temperature = []
	cp = []
	for line in open('data','r'):            #Opening the data file and reading data
		values = line.split(',')             #Splitting the line which is read using comma.
		temperature.append(float(values[0])) #Appending the values of temperature into the temperature array.
		cp.append(float(values[1]))          #Appending the value of cp into the cp array.
	return [temperature,cp]	                 #Returning a value for the function read_file.


#Main program
temperature,cp = read_file()                 #Calling the function read_file and storing the values into temperature and cp.
popt,pcov = curve_fit(func,temperature,cp)   #popt contains coefficients of a & b , pcov contains the estimated covariance of popt.
fit_cp = func(np.array(temperature),*popt)   #We are passing temperature as numpy array.

#Plotting the graphs
plt.plot(temperature,cp,color="red",linewidth=3)
plt.plot(temperature,fit_cp,color="blue",linewidth=3)
plt.legend(['actual data','curve fit data'])
plt.xlabel('Temperature[K]')
plt.ylabel('Cp')
plt.savefig('TEMPERATURE VS CP')
plt.show()
OUTPUT GRAPH OBTAINED:
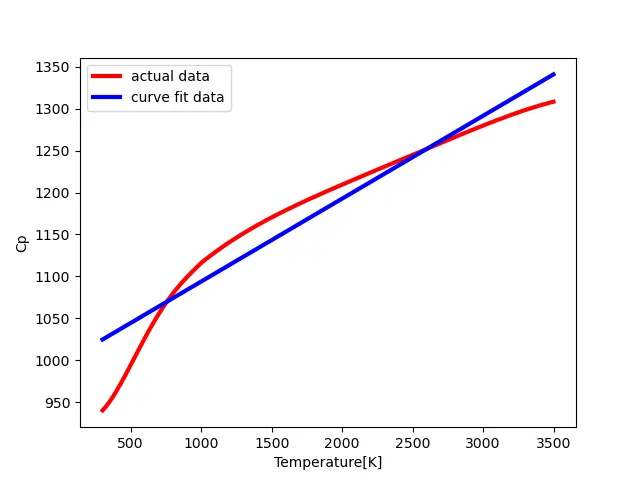
This graph represents the equation a*t +b which is a linear polynomial and curve fitting is represented on this graph. From the graph we can say that curve fitting for a linear polynomial is not good since the actual data and the curve fit data have alot of deviation in the values obtained.
PROGRAM FOR CUBIC POLYNOMIAL CURVE FIT:
#Program to do curve fitting using python programming

#Importing necessary modules
import math
import matplotlib.pyplot as plt
import numpy as np
from scipy.optimize import curve_fit

#Curve fit function
def func(t,a,b,c,d):
	return a*pow(t,3) + b*pow(t,2) + c*t + d

#Reading the thermodynamic data file
def read_file():
	temperature = []
	cp = []
	for line in open('data','r'):            #Opening the data file and reading data
		values = line.split(',')             #Splitting the line which is read using comma.
		temperature.append(float(values[0])) #Appending the values of temperature into the temperature array.
		cp.append(float(values[1]))          #Appending the value of cp into the cp array.
	return [temperature,cp]	                 #Returning a value for the function read_file.


#Main program
temperature,cp = read_file()                 #Calling the function read_file and storing the values into temperature and cp.
popt,pcov = curve_fit(func,temperature,cp)   #popt contains coefficients of a & b , pcov contains the estimated covariance of popt.
fit_cp = func(np.array(temperature),*popt)   #We are passing temperature as numpy array.

#Plotting the graphs
plt.plot(temperature,cp,color="red",linewidth=3)
plt.plot(temperature,fit_cp,color="blue",linewidth=3)
plt.legend(['actual data','curve fit data'])
plt.xlabel('Temperature[K]')
plt.ylabel('Cp')
plt.savefig('CUBIC FUNCTION')
plt.show()
OUTPUT GRAPH OBTAINED:
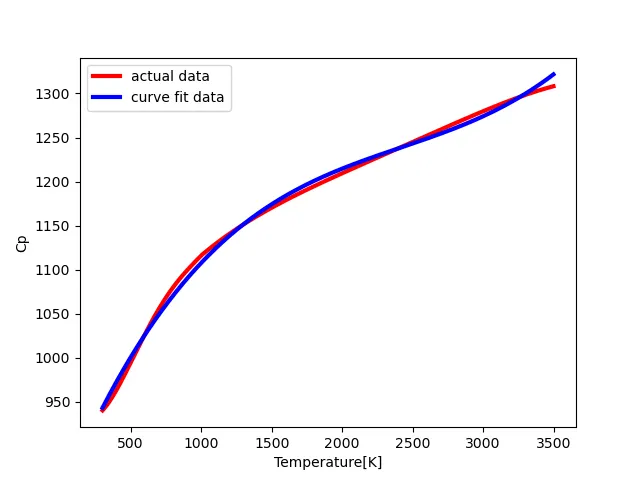
This graph represents the equation `acdott^3+bcdott^2+c cdott+d` which is a cubicpolynomial and curve fitting is represented on this graph. From the graph we can say that curve fitting for a cubic polynomial is good since the actual data and the curve fit data super impose each other in the values obtained and we get a good graph since the both the actual data and curvefit data are in align with each other.
When we perform the same procedure for a quadratic polynomial we get a much better output for the graph since the actual data and curve fit data superimpose each other in an efficient manner. The equation used here is `acdott^4+bcdott^3+c cdott^2+dcdott+e`
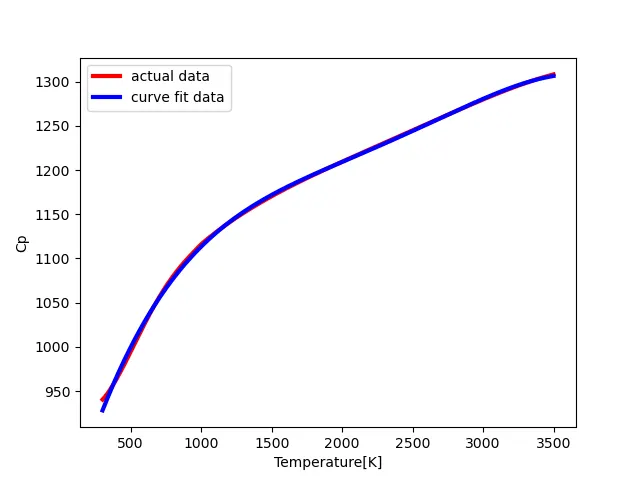
Graph for quadratic polynomial
PROBLEM STATEMENT SOLUTION:
1. Whate does popt and pcov mean?
Ans: The popt contains the coefficients of the function defined and the pcov contains the covariance matrix for the given equation.
2. What does np.array(temperature) do?
Ans: The np.array(temperature) is used for passing values for variable 't' as a numpy array for curve fitting.
3. What does * in *popt mean?
Ans: The '*' in *popt is used for referring us to the coefficients of the functions defined.
4. Write code to fit a linear and cubic polynomial for the Cp data. Explain if your results are good or bad?
Ans: From the output graphs obtained for linear polynomial and cubic polynomial , we can say that the cubic polynomial has a better curve fit compared to linear curve fit since both the actual data and the curve fit data are superimposing with each other in the graph obtained. The result for cubic curve fit is good and the result fot the linear curve fit is bad since there is alot of deviation from actual data and curve fit data.
5. What needs to be done in order to make the curve fit perfect?
Ans: In order to make the curve fit perfect , we can prefer a higher order polynomial which can take each value for the data given and fit in the curve obtained respectively.
RESULTS:
From the above report , we can say that the curve fitting is best done for equations with a higher power since the values when substituted in the equations gives us optimal results for better curve fit as we say for linear , cubic , quadratic polynomial.