Curve fitting in matlab
AIM:
Write code to fit a linear and cubic polynomial for the Cp data.
OBJECTIVE:
- Plot the linear and cubic fit curves along with the raw data points. Title and axes labels are a must, legends could be shown if necessary.
- Write a code to show splitwise method.
- Explain the parameters used to measure the fitness characteristics for both the curves.
CURVE FIT:
Curve fitting is the process of constructing a curve, or mathematical function, that has the best fit to a series of data points, possibly subject to constraints.
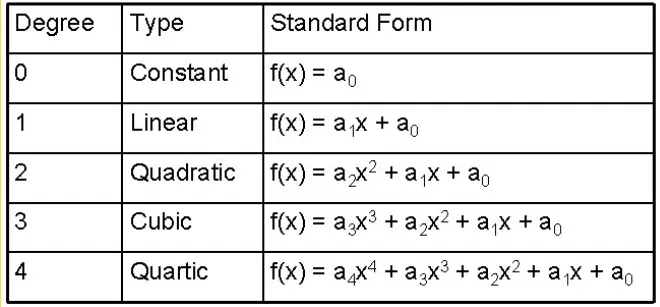
Curve fitting is performed using 2 functions:
- Polyfit is a Matlab function that computes a least-squares polynomial for a given set of data. Polyfit generates the coefficients of the polynomial, which can be used to model a curve to fit the data.
- Polyval evaluates a polynomial for a given set of x values.
CODE OF LINEAR AND CUBIC POLYNOMIAL:
clear all
close all
clc

j=load("data");
tem=j(:,1);
cp=j(:,2);

co_effi1=polyfit(tem,cp,1);
predicted_cp1=polyval(co_effi1,tem)

co_effi3=polyfit(tem,cp,3);
predicted_cp3=polyval(co_effi3,tem)

hold on
plot(tem,cp,'linewidth',2)
plot(tem,predicted_cp1,'linewidth',2)
plot(tem,predicted_cp3,'linewidth',2)
xlabel('TEMPERATURE')
ylabel('SPECIFIC HEAT')
legend('original curve','linear curve','cubic curve')
hold off
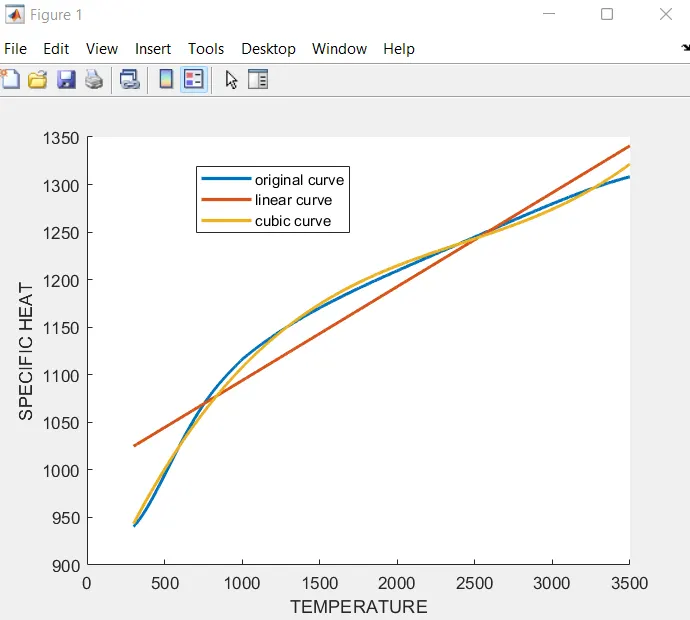
OUTPUT OF LINEAR AND CUBIC POLYNOMIAL:
CODE OF CUBIC POLYNOMIAL:(BY SPLITWISE METHOD)
clear all
close all
clc

file=load("data");
tem=file(:,1);
cp=file(:,2);
tem1=file(1:800,1);
tem2=file(801:1600,1);
tem3=file(1601:2400,1);
tem4=file(2401:3200,1);
cp1=file(1:800,2);
cp2=file(801:1600,2);
cp3=file(1601:2400,2);
cp4=file(2401:3200,2);

%par1
co_effi1=polyfit(tem1,cp1,3);
predicted_cp1=polyval(co_effi1,tem1);

%part2
co_effi2=polyfit(tem2,cp2,3);
predicted_cp2=polyval(co_effi2,tem2);

%part3
co_effi3=polyfit(tem3,cp3,3);
predicted_cp3=polyval(co_effi3,tem3);

%part4
co_effi4=polyfit(tem4,cp4,3);
predicted_cp4=polyval(co_effi4,tem4);

hold on
plot(tem,cp,'linewidth',4)
plot(tem1,predicted_cp1,'linewidth',4)
plot(tem2,predicted_cp2,'LineWidth',4)
plot(tem3,predicted_cp3,'linewidth',4)
plot(tem4,predicted_cp4,'linewidth',4)
xlabel('TEMPERATURE')
ylabel('SPECIFIC HEAT')
legend('original curve','split1','split2','split3','split4')
hold off
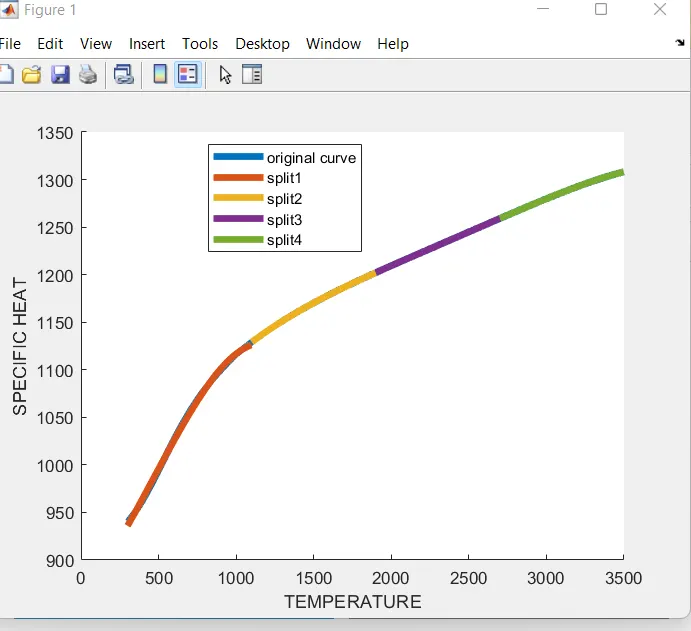
OUTPUT OF CUBIC POLYNOMIAL:(BY SPLITWISE METHOD)
EXPLANATION:
-As usual we need to give clear all,close all and clc for deleting the previous command, plot and workspace.
-we are going to make the curve for given data. The given data is temperature and the specific heat.
-After that, we need to match the curve with help of polynomial. LOAD the given data in matlab and then plot the temperature vs specific heat.
-For linear polynomial, we need to use polyfit for finding the co-efficient value.After finding the co-efficient , we need to use the polyval for finding the predicted cp by substitute the value of temperatue and co-efficient in linear equation.
-For cubic polynomial, we need to use polyfit for finding the co-efficient value.After finding the co-efficient , we need to use the polyval for finding the predicted cp by substitute the value of temperatue and co-efficient in cubic equation.
-plot the temperature and predicted cp values for both linear polynominal and cubic polynominal.
- For splitwise cubic polnomial, we need to split the data into four for best fit of curve.for split purpose , we are going to diving the temperature and specific heat and make different set of polyfit and polyval for different set of temperature and co-efficient as same as above procedure.
-After plotting , label and legend can be added for better understanding.
How to make a curve fit perfectly?
For perfect fit, we need to select the higher level polynomial with help of polyfit and also polyval.This is one of the method to make a fit perfectly.
How to get the best fit?
For best fit , we need to use splitwise method. Splitwise method is defined as spliting the data into 2 or more to get the best fit and then plot the curve.
What could be done to improve the cubic fit?
we need to use splitwise method. Splitwise method is defined as spliting the data into 2 or more to get the best fit and then plot the curve. As i shown in above code for our best understanding.splitwise is done to improve the cubic fit.
Mention the errors faced while programming & Steps taken to overcome those errors.

CONCLUSION:
Finally, we created the plot of linear and cubic curve fit along with the raw data points and also we created the splitwise method for cubic polynomial.For the better result , we are using the splitwise.