Conjugate Heat Transfer Analysis on a graphics card.
#AIM:
* To run a steady state simulation on a model graphics card, with different choice of materials.
* To run the simulation at 3 different velocity of air and hence compute max wall heat transfer coefficient and max temperature at processor.
* To identify potential hotspot in the graphics card setup.
#INTRODUCTION:
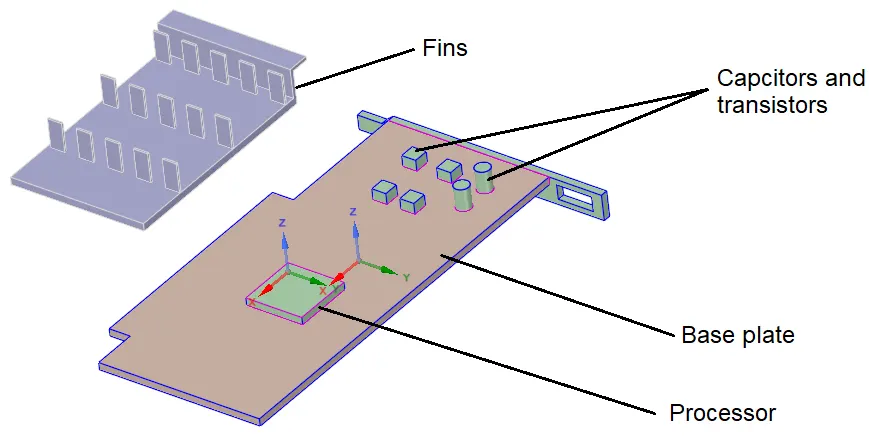
Graphics card more appropriatley Graphics processing unit is a specially designed electronic circuit which rapidly manipulate and alter memory to accelarate the creation of images in a frame buffer intended for output of a display device. GPU's are used in mobile phones, gaming consoles, workstations etc. More efficient parallel structure of the GPU's make them better for image processing and related computations compared to the general purpose processor. Generally in a computer the GPU's will be present inside the video card or sometimes it will be embedded into the CPU. Main part or the computational part of a GPU is its processor where the image processing is done, this processor is usually mounted on a printed circuit board (PCB). Above the processor there will be parallel projections of small plate called fins.
As far as conjugate heat transfer analysis is concerned, processor being the brain of a GPU where computational operations being carried out lot of heat gets generated at the processor which leads to increase in temperature of the same. So it becomes invetible that the heat generated at the processor to be carried away and hence reduce the temperature, so as to accomadate this heat transfer fins are mounted on top of the processor. Heat from the processor gets transffered to the fins through conduction also the heat gets conducted into the PCB on which the processor is mounted, from fins and PCB the heat gets transffered by convection. This process of removal of heat is not much efficient only less heat can be carried away by the air so usually small fans are used which blows air through the GPU and hence this forced convection efficiently removes the heat.
In this simulation a model graphics card is used, the model graphics card used is as shown below,
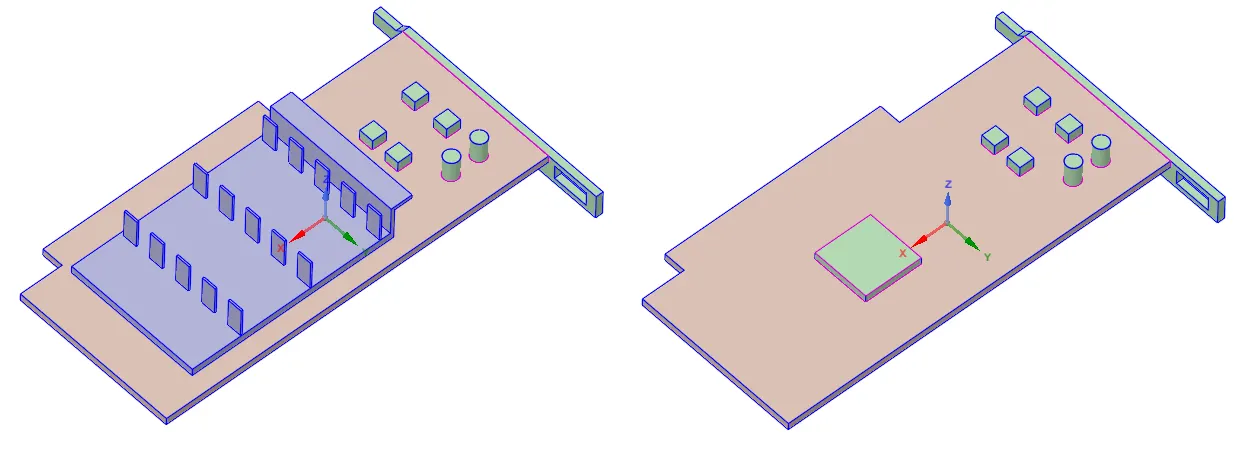
Fins are mounted on top of processor and hence to view the processor fins needs to be removed.
Different parts concerned with the model graphics card is as shown below,
#SIMULATIONS:
* Geomtry:
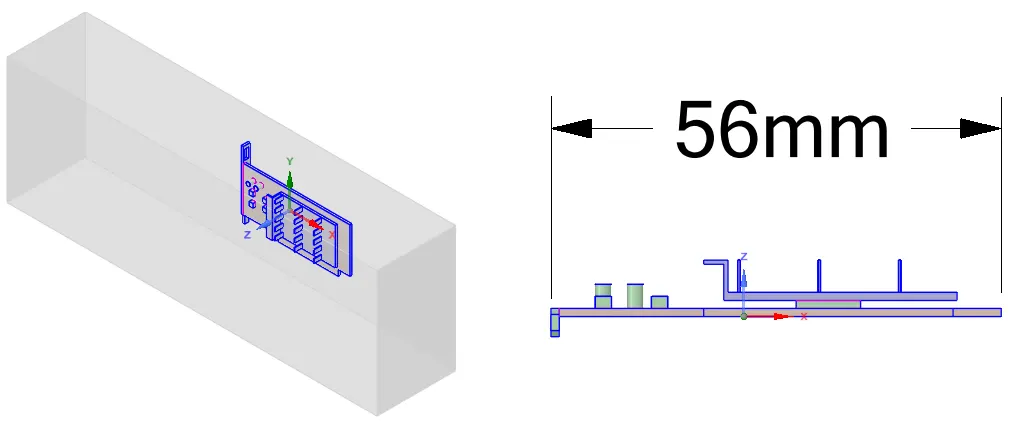
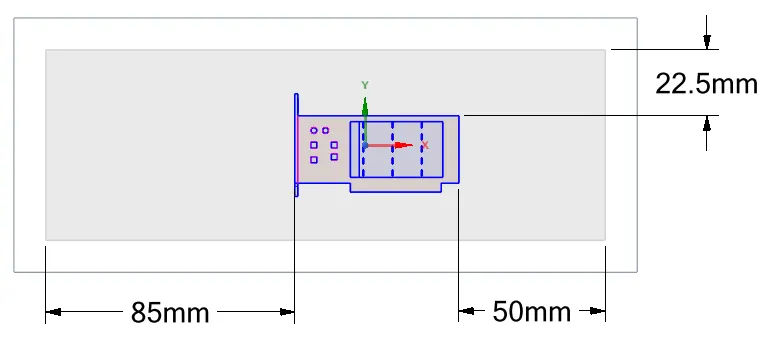
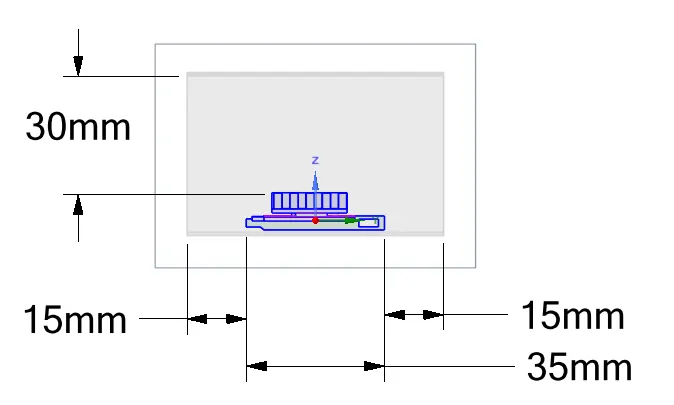
Model graphics card is opened in spaceclaim and an outer enclosure is provided, this outer enclosure acts as small wind tunnel. Dimensions of the graphics card as well as the outer enclosure is as shown below,
* Meshing:
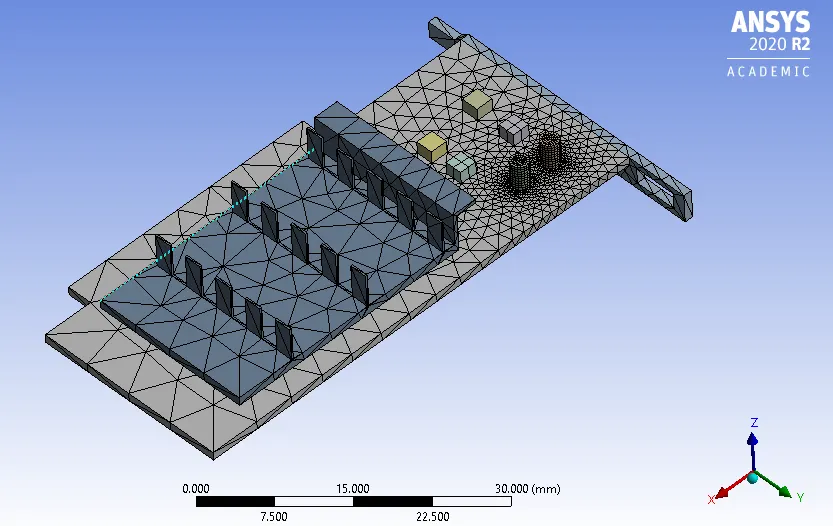
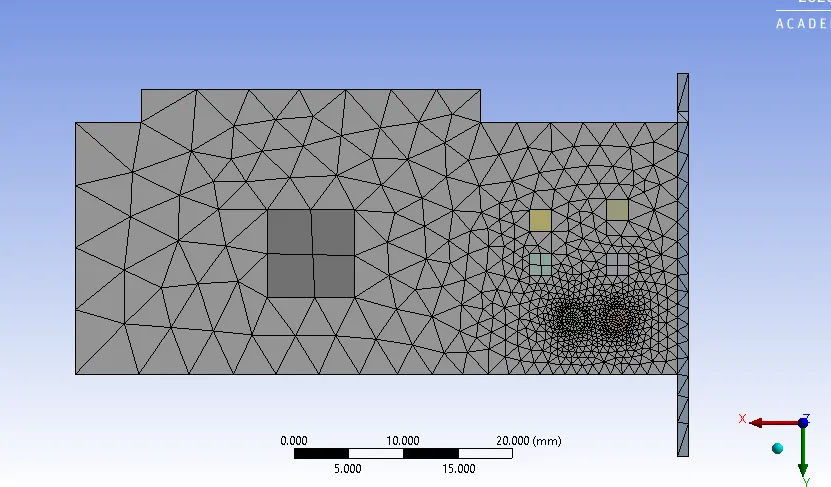
After providing with the enclosure geometry is opened in meshing module. In here different parts of the GPU are named respectivley as shown above. Initially a base line mesh is provided and simulations is run at velocity of air = 1 m/s. When base line mesh is provided the GPU as well as the outer enclosure looks as follow,
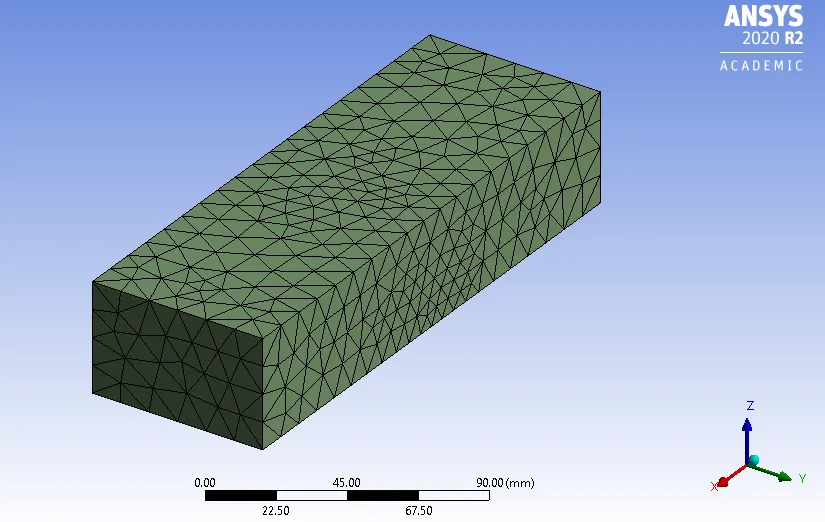
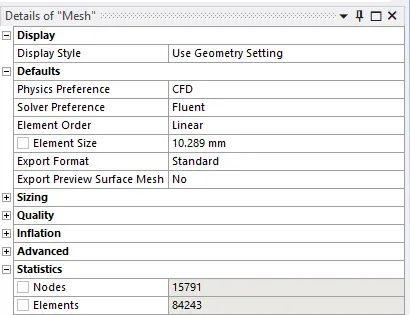
baseline mesh count is as shown below,
Mesh metrics of the base line mesh:
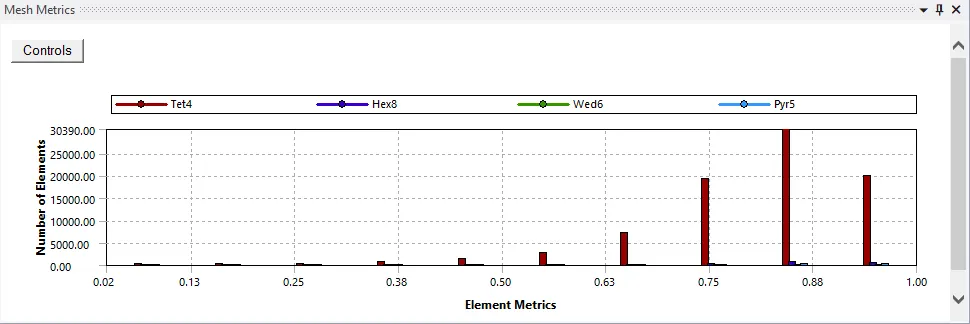
Element metrics is between 13% and 2%, if we take an average we can say that element metrics is around 7.5% and hence mesh quality is ok to proceed further.
* Solver setup:
Steady state simulation is perfomed using a pressure based solver. Energy equation is solved since the point of interest is to study the temperature profile on the GPU. Before setting the viscous model for the simulation Reynolds number is calculated.
Reynolds number, `Re = (U*D)/nu`
`U -` Velocity of air (m/s).
`D -` Characteristic length of the geometry (m).
`nu -`Kinematic viscosity of air (m/s^2).
We have U = 1 m/s, D = 56 mm, `nu =`1.5757e-05 (at 300 K temp. of air)
therfore `Re = (1*56*10^-3)/(1.5757e-05) = 3.55*e03`,
for an external flow Re > 2e05 is considered as turbulent so the Reynolds number obtained is less and hence the flow can be considered as laminar but the objective of the project is to determine the wall heat transfer coefficient at processor, fins and base plate of the GPU and wall HTC being a wall phenomena it can be well captured using the K-Ω SST turbulence model. Hence K-Ω SST viscous model is used.
* Generally in a GPU the processor, fins and the base plate will be made of different materials so for this simulation Silicon is the material used for the processor, Aluminium is being used for fins. Base plate being a PCB FR4 is the material used for base plate. FR4 is a composite material composed of woven fibergalss cloth with epoxy resin binder that is flame resistant.
Properties of the above mentioned materials is shown below:
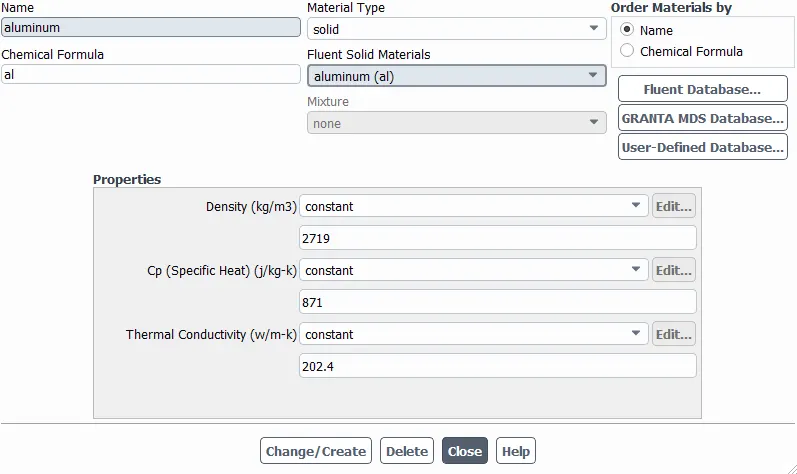
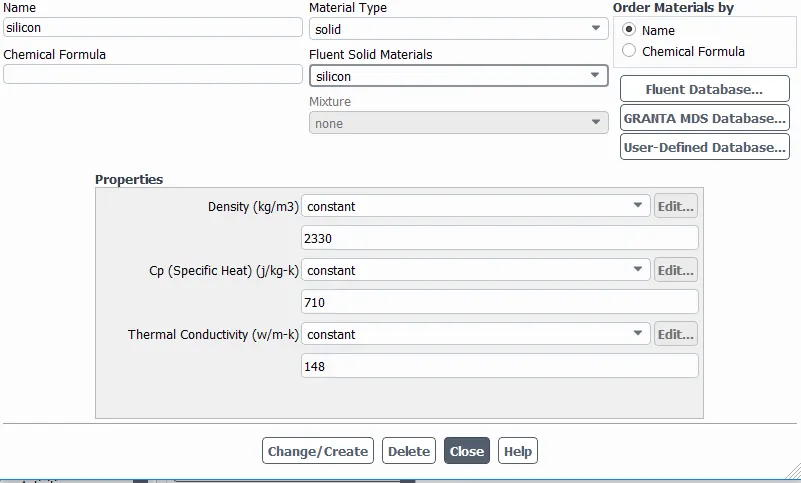
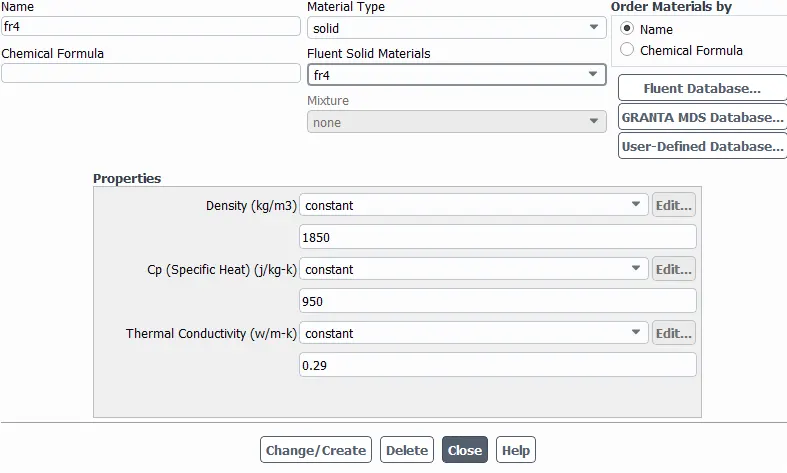
In the above shown material properties Aluminium is the only material available in the fluent database. Silicon as well as FR4 are created.
* Processor being the computational part of the GPU heat is generated at the processor and this heat gets transffered to the fins as well as base plate by conduction. The flow of air past the GPU causes forced convection and hence heat is being carried away from GPU.This is the flow physics involved in the CHT analysis, so as to get accurate result it is essential that we convey the above flow physics to fluent (solver), this can be done by assigning the different cell zones with its material type.
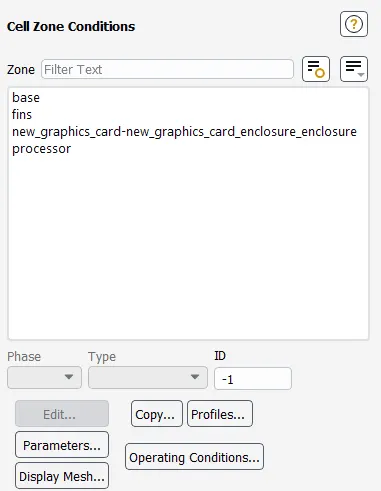
Above is the snip of different cell zones present in the whole geometry. Assigning each cell type with its type either a fluid or solid is very much essential. In the above shown cell zones except the enclosure which is of type fluid all other cell zones are set as type solid and each cell zone is assigned with its respective materials viz Al - for fins, Si - for processor and Fr4 for the base plate.
* Processor being the heat source, for processor in the cell zone is provided with a constant source term which is q (w/m^3). In this simulation it is assumed that 1.5 watt of power is being consumed by the processor and 99.9 % of the power consumed gets converted to heat. Below are the dimensions of the processor,
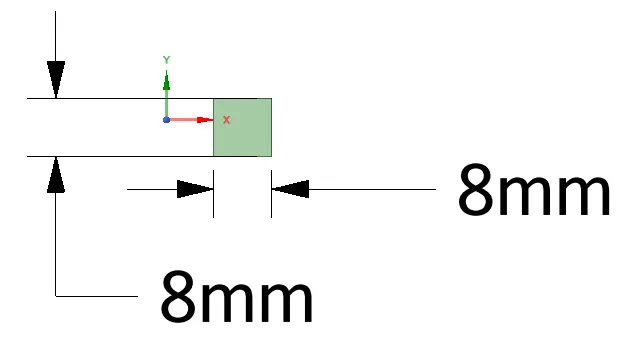
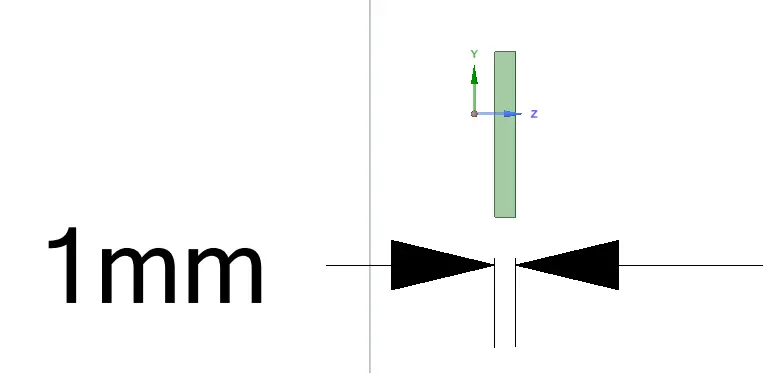
so q = 1.5/(8*10^-3*8*10^-3*1*10^-3) = 2.343*10^7 w/m^3, so this q is provided as the constant source term.
Coupled wall condition is being used and hence there is no need to provide inflation layers. Temperature contour at the GPU is set and simulation is carried for 250 iterations.
For a base line mesh the results obtained for a velocity of 1m/s is as shown below:
* Residual plot:
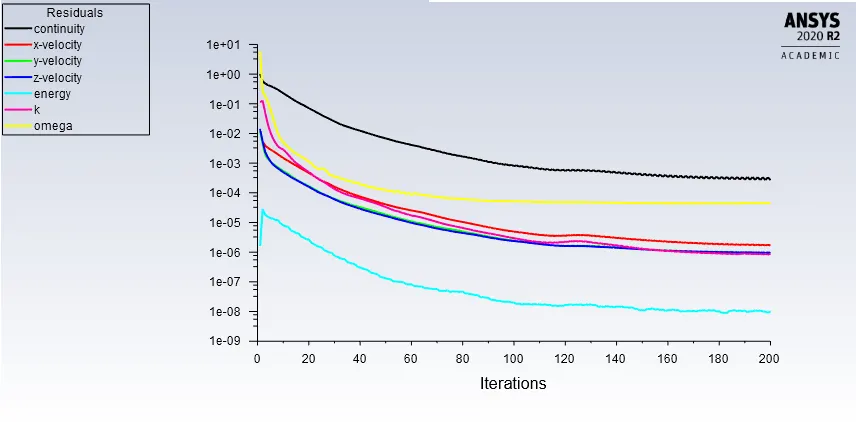
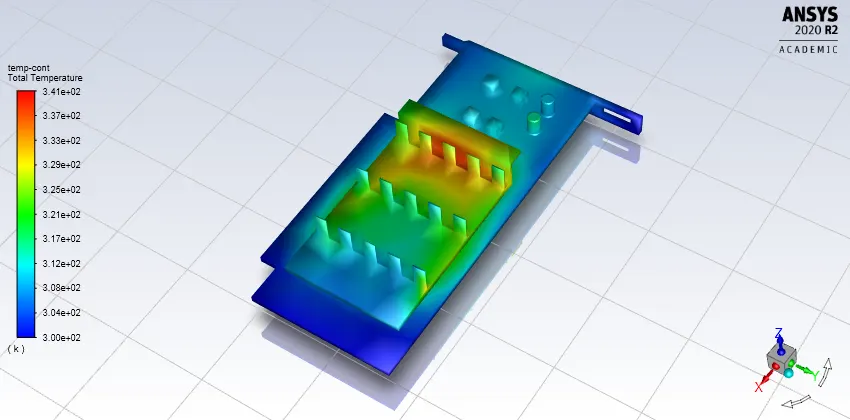
* Temperature conotur:
* Temperature contour of processor:
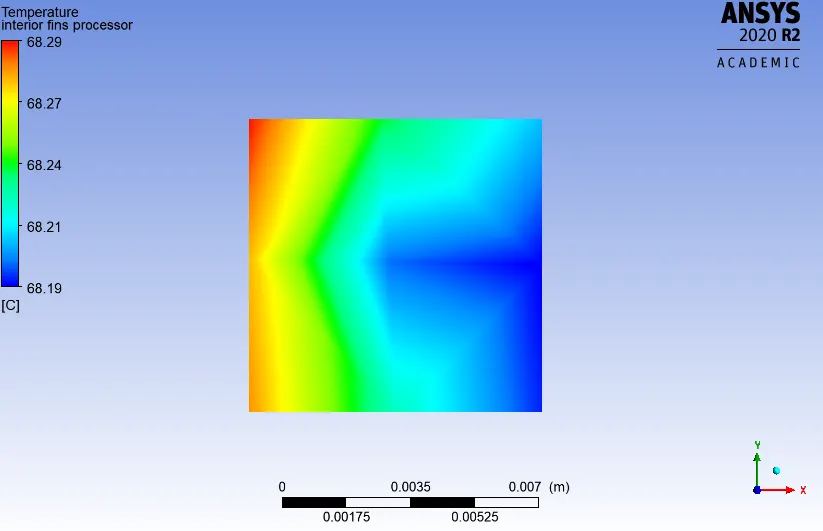
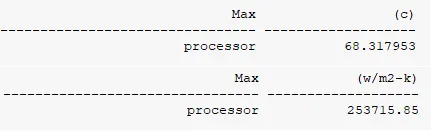
Max Temperature and max wall Heat transfer coefficient at processor is computed using volume report :
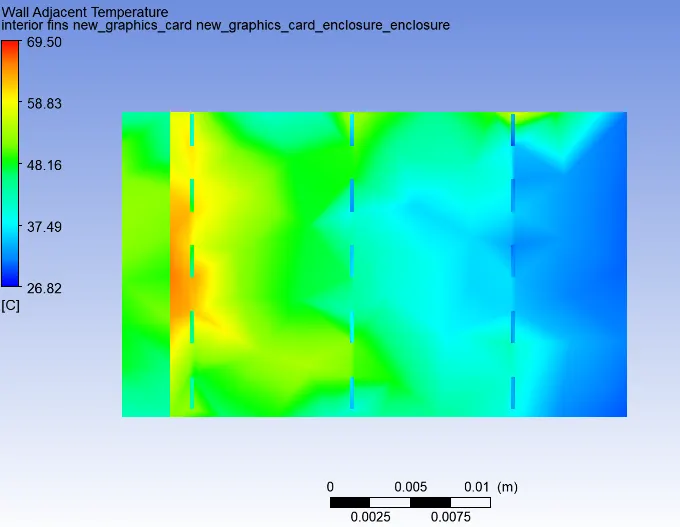
* Temperature contour of fin:
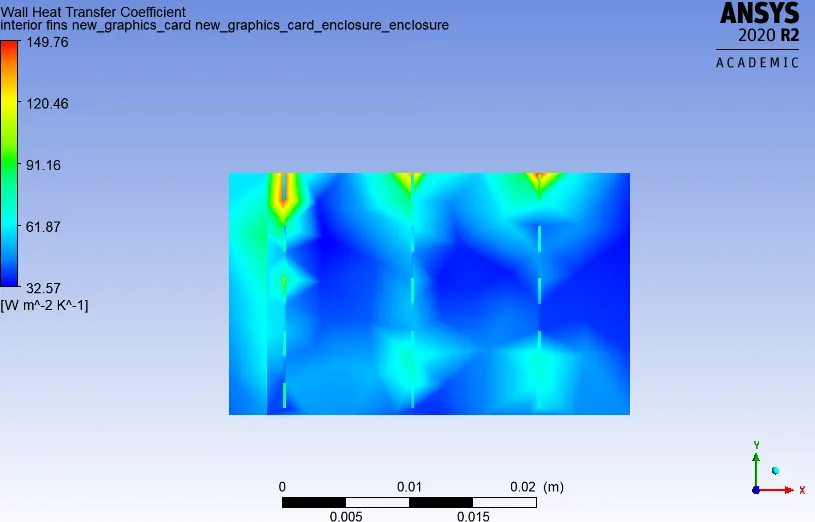
* Wall HTC contour of fin:
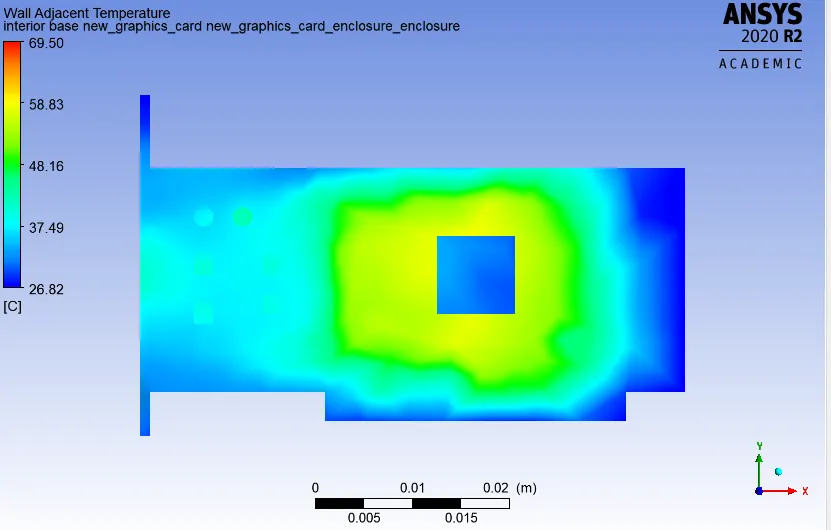
* Temperature contour of base plate:
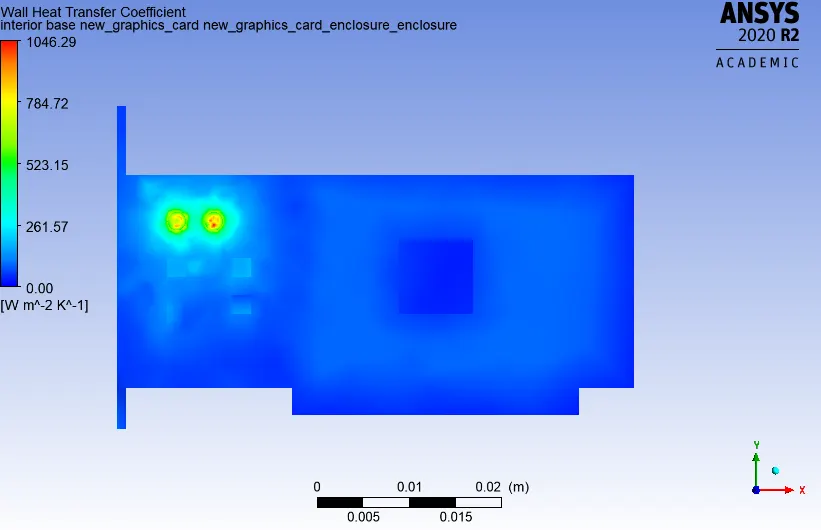
* Wall HTC contour of base plate:
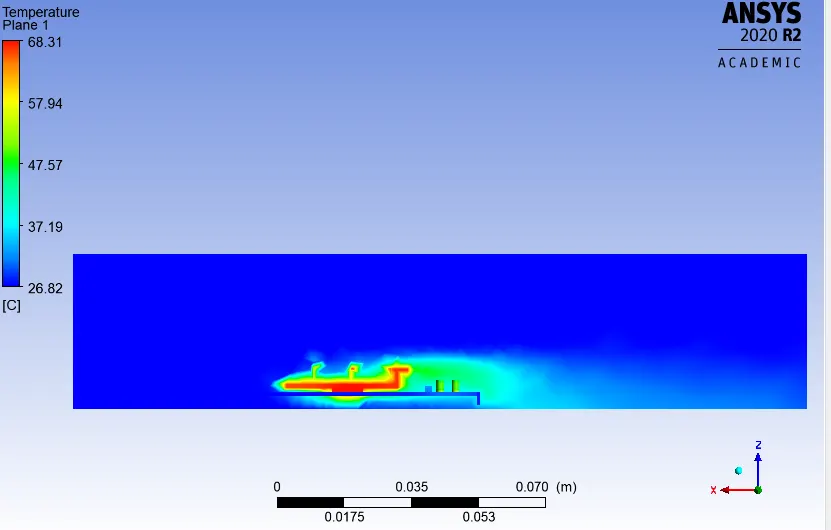
* Temperature profile along the GPU:
* Velocity profile along GPU:
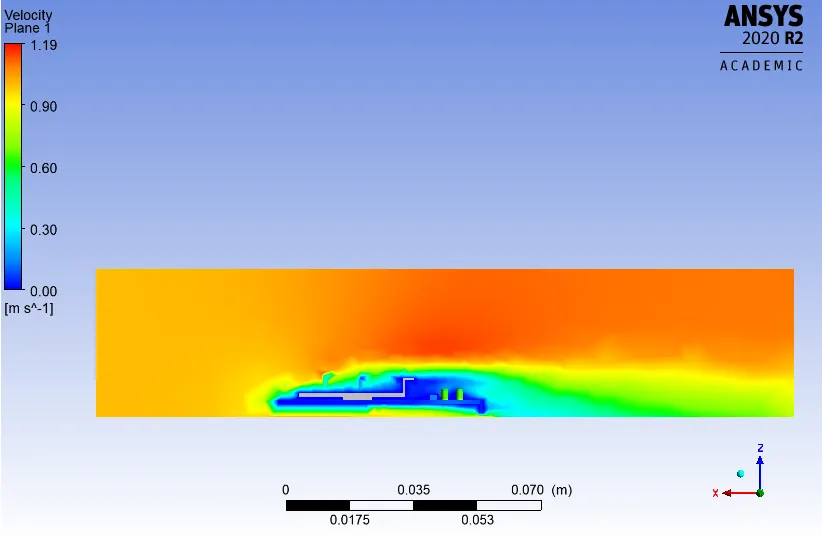
*From the above contour plots it is clear that the temperature distribution is very coarse and hence it is must that we refine the mesh further for better result. If we observe the meshing on the processor (a snip of the same is provided above) it can noted that the number of mesh is just 4, which is too coarse and the same can be validated by observing the temperature contour of the processor.
* Meshing on the GPU can be refined using the local controls.
Body sizing with an element size = 0.2 mm is provided for the processor.
Body sizing with an element size = 0.8 mm is provided for the fins.
Body sizing with an element size = 0.7 mm is provided for the base plate.
Edge sizing with No. of divisions = 20 is provided on the edges of 4 cylindrical capacitors present on top of the base plate.
Body sizing with an element size = 4 mm is provided on the outer enclosure.
After providing the above mentioned local controls, refined mesh looks as follow,
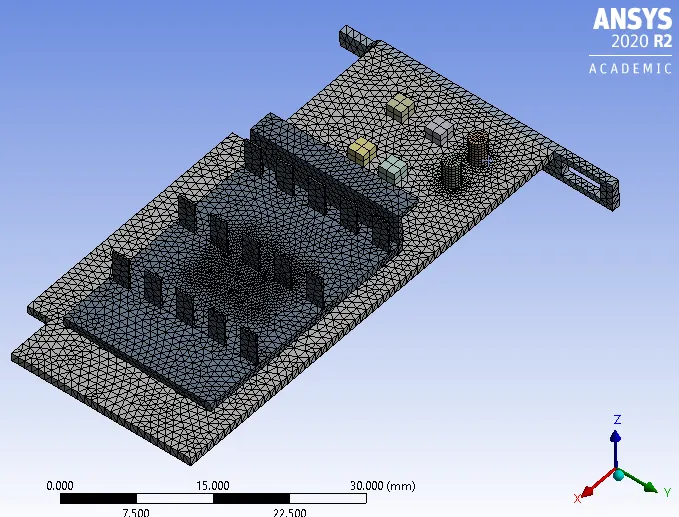
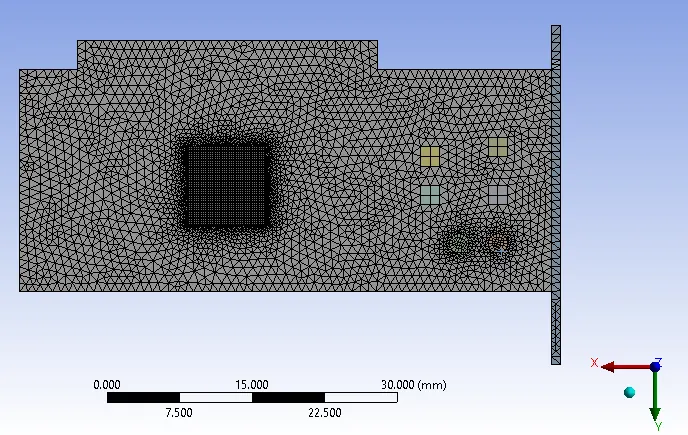
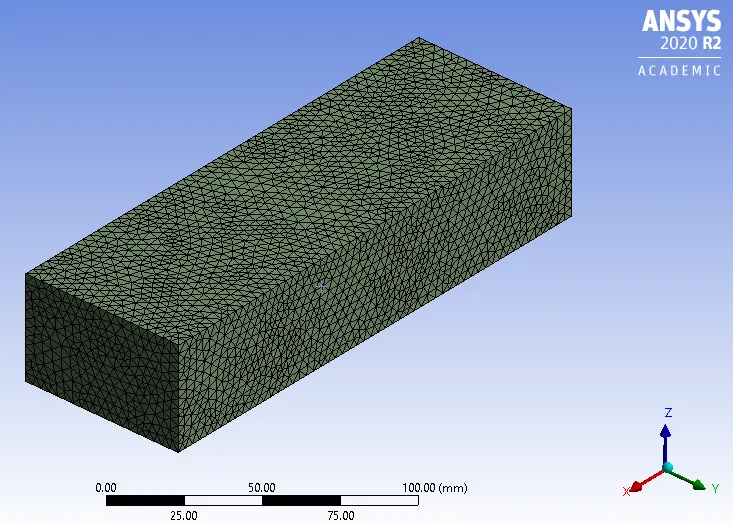
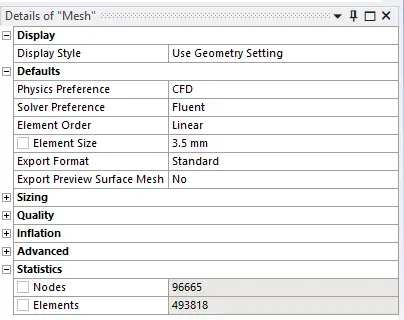
Mesh count of refined mesh:
Mesh metrics of refined mesh:
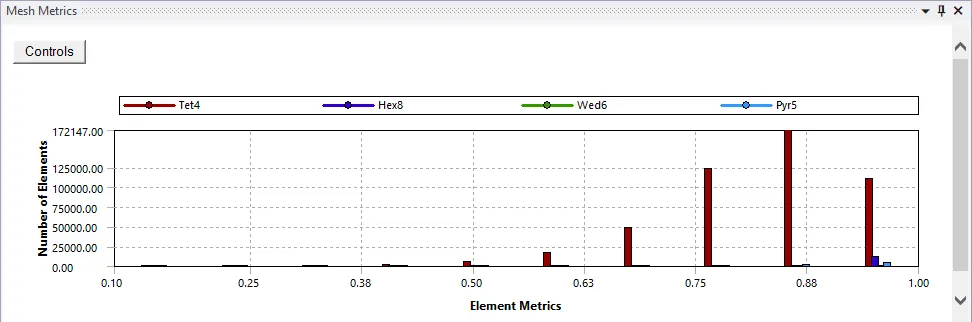
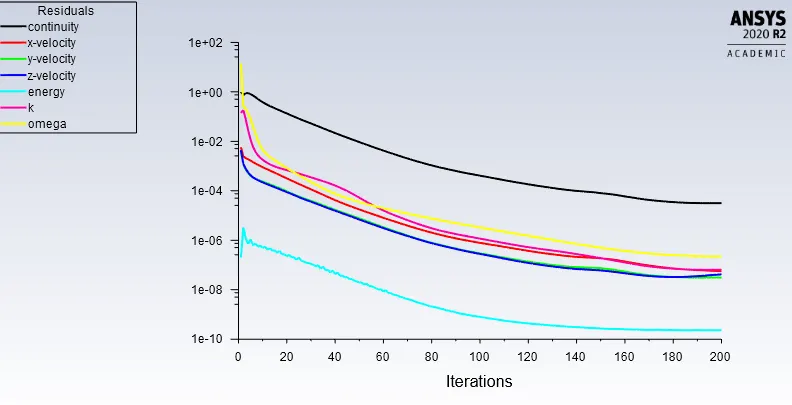
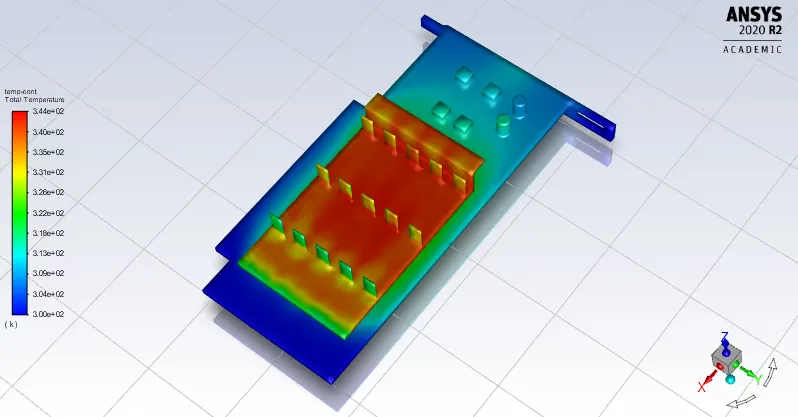
From the above plot of mesh metrics the element metrics is above 10% hence the mesh quality is good enough to proceed further. Simulations are run for 250 iterations and below are the result obtained,
* Residual plot:
* Temperature contour:
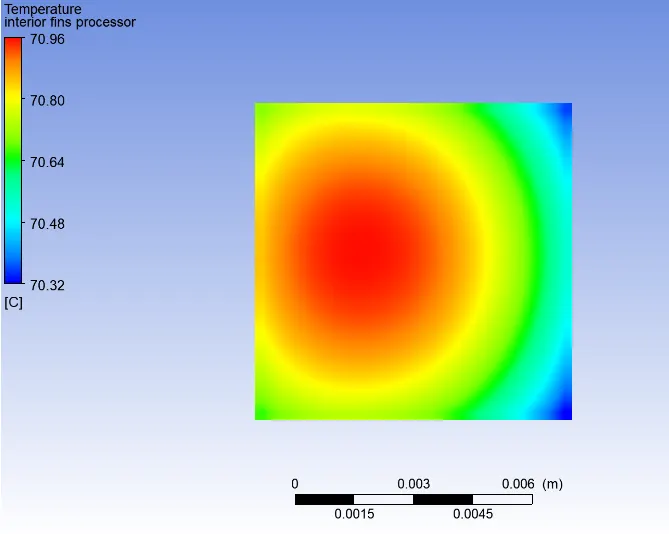
* Temperature contour of processor:
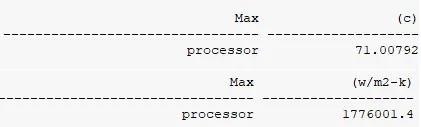
Max temperature and wall HTC at processor are computed using volume definition report,
* Temperature contour of fin:
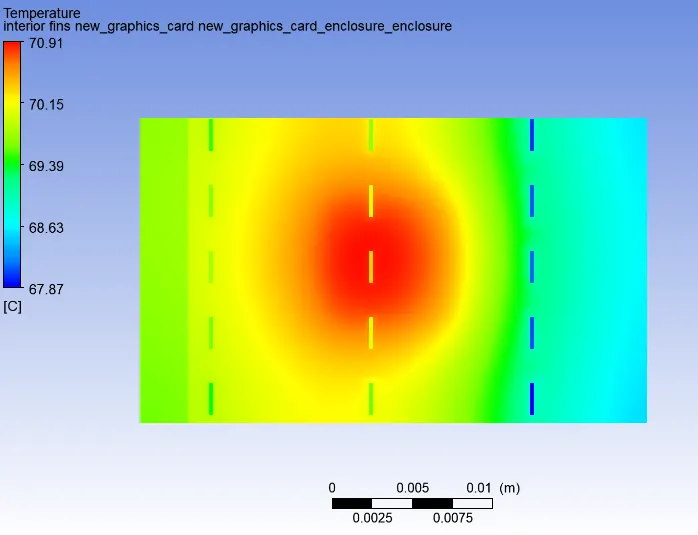
* Wall HTC contour of fin:
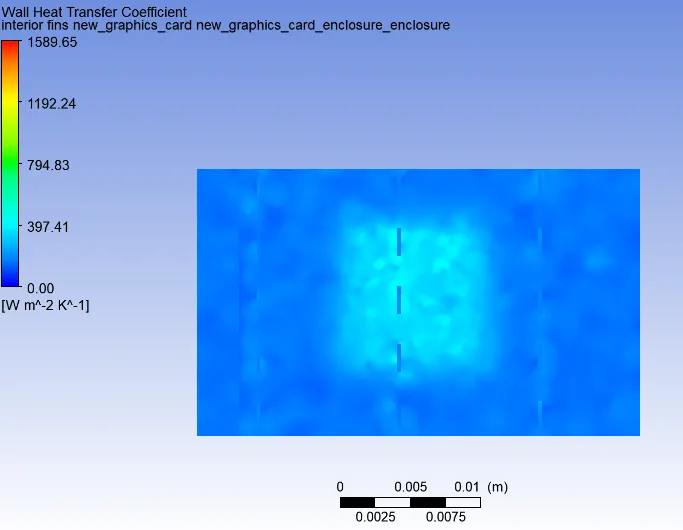
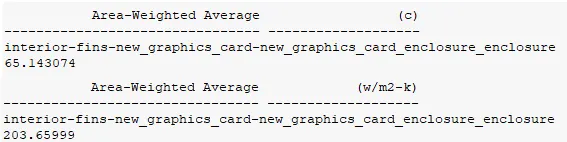
Area weighted average value of temperature and wall HTC is computed,
* Temperature contour of base:
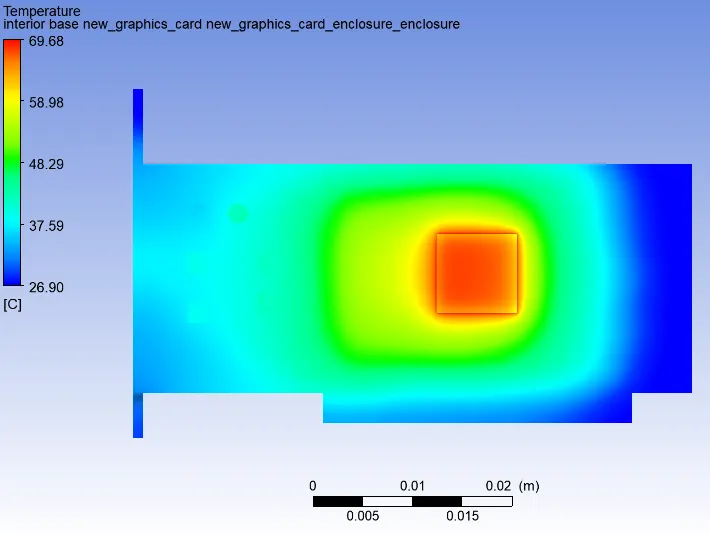
* Wall HTC contour of base:
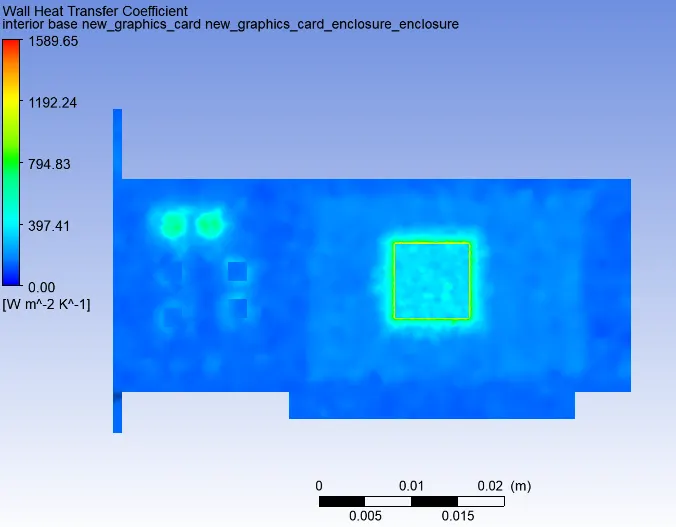
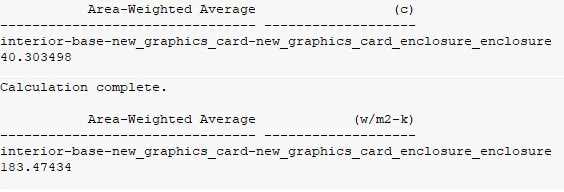
Area weighted average value of temperature and wall HTC is computed,
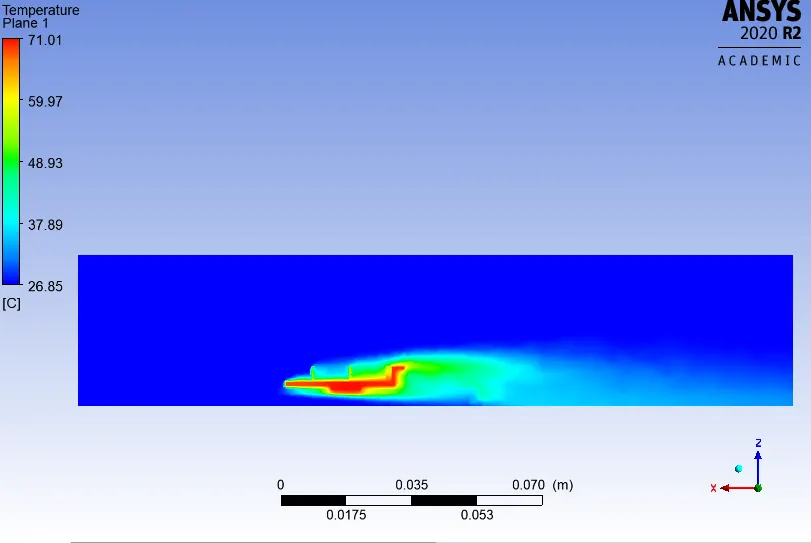
* Temperature profile along the GPU:
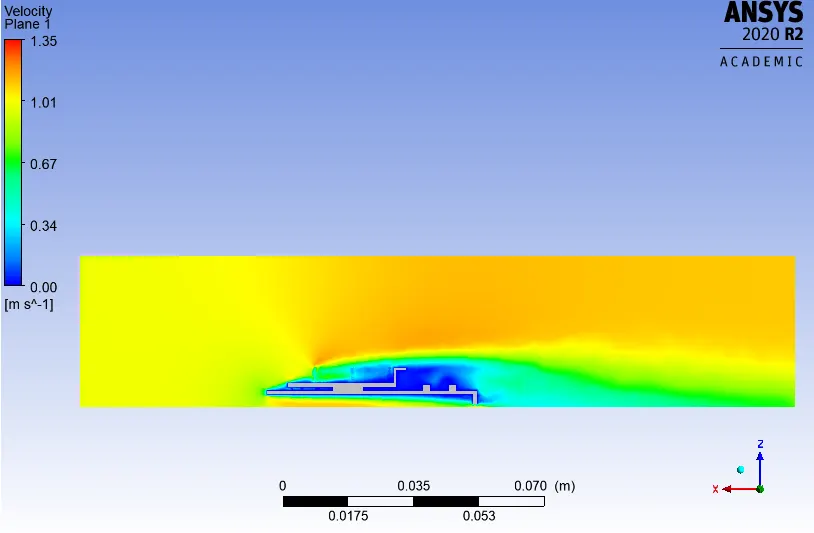
* Velocity profile along GPU:
* Result obtained for refined mesh is much improved from that of result obtained from coarse mesh this can be clearly observed from the temperature contour of the processor where we can see the temperature distribution layer by layer.
* Simulation is further carried for inlet velocity of 3 m/s and 5 m/s for the same refined mesh and result are noted.
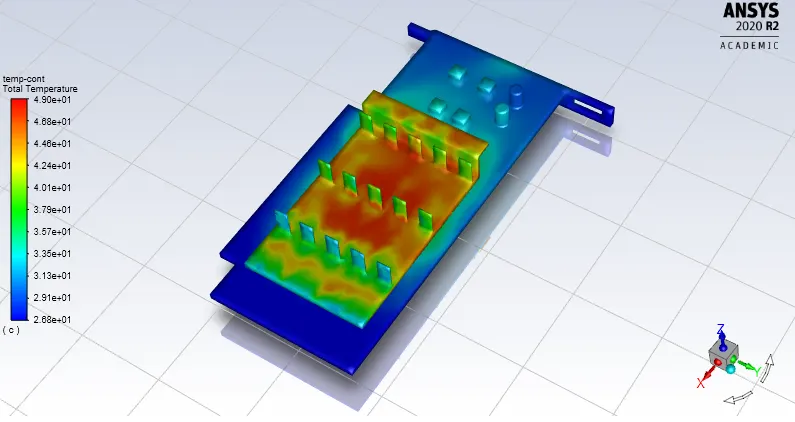
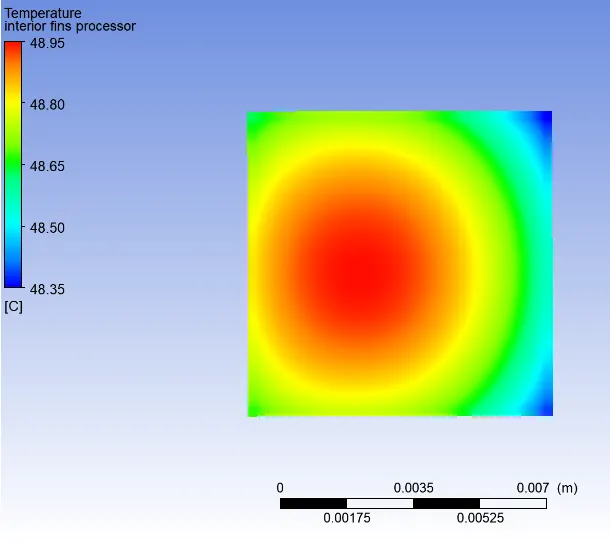
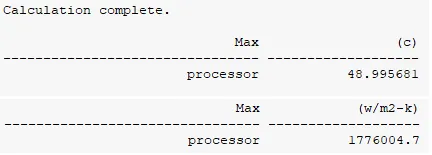
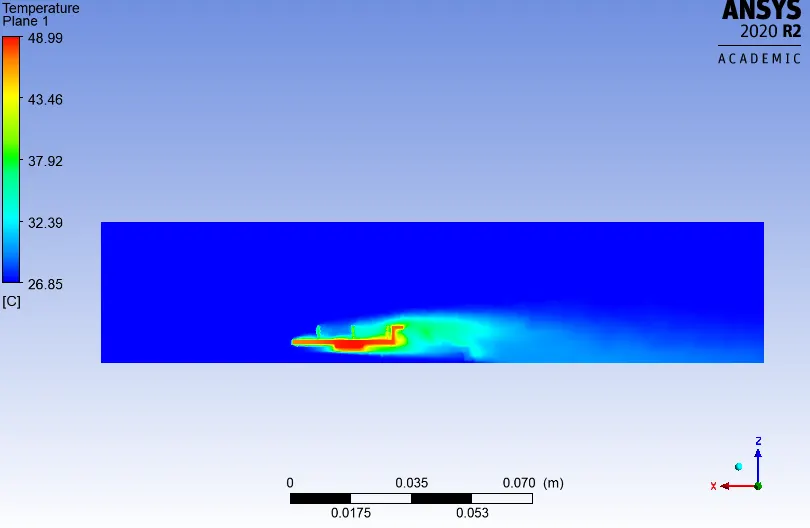
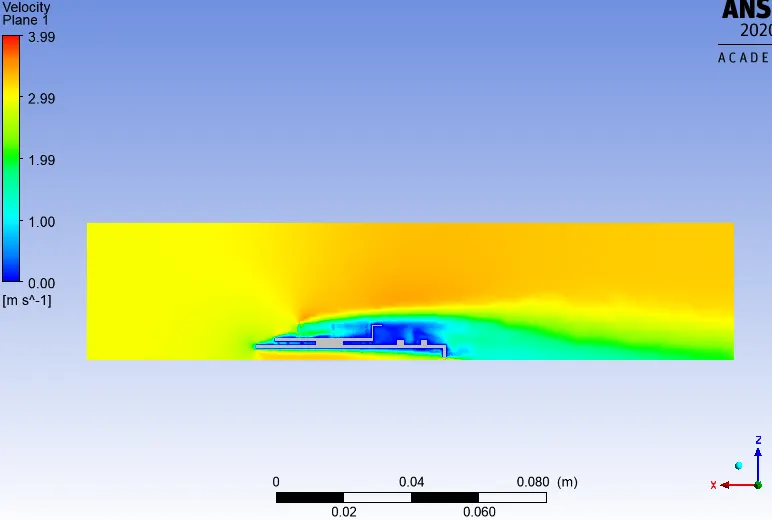
* For velocity of 3 m/s result obtained as follows:
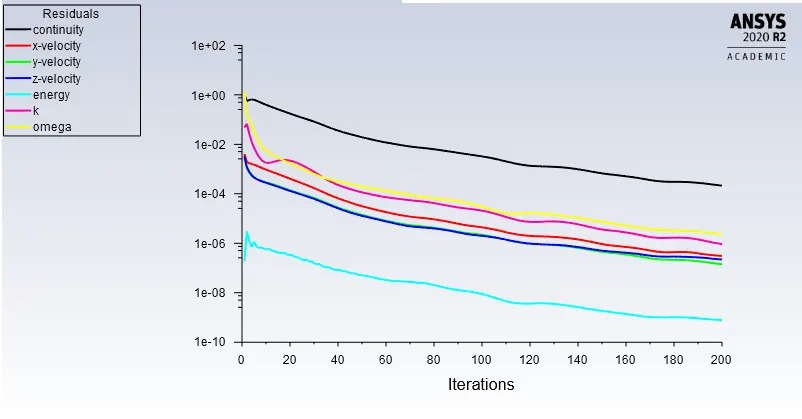
* Residual plot:
* Temperature contour:
* Temperature contour of processor:
Max temperature and max wall HTC is computed,
* Temperature contour of fin:
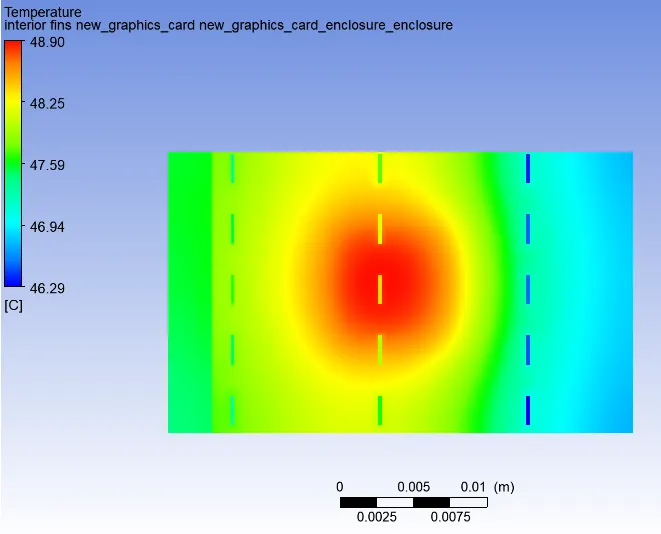
* Wall HTC contour of fin:
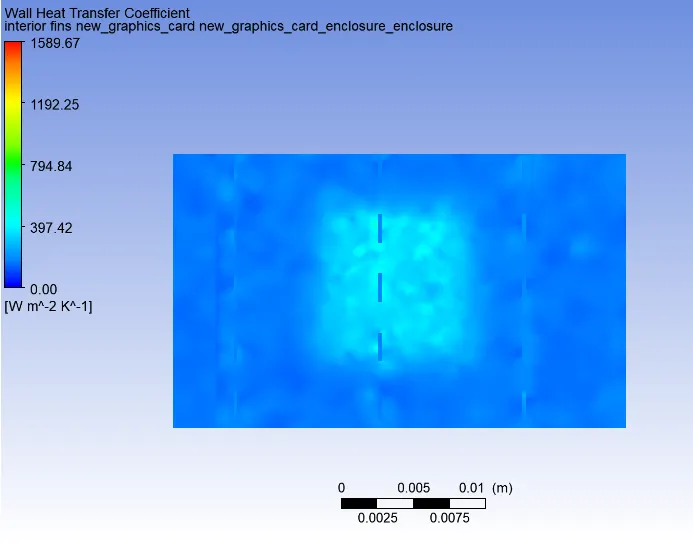
Area weighted average value of temperature and wall HTC is computed,

* Temperature contour of base:
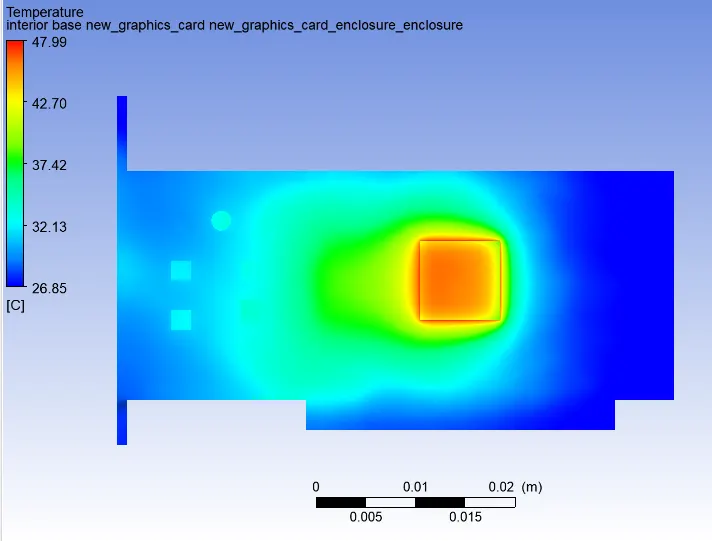
* Wall HTC contour of base:
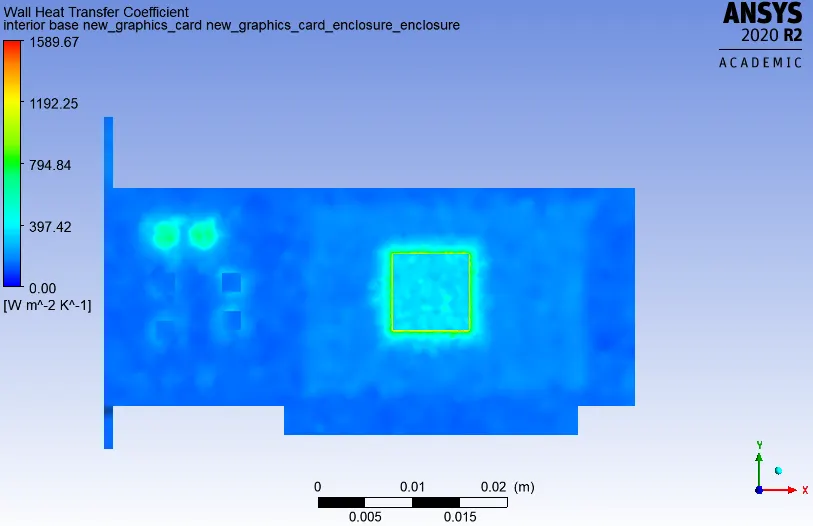
Area weighted average value of temperature and wall HTC is computed,

* Temperature profile along GPU:
* Velocity profile along GPU:
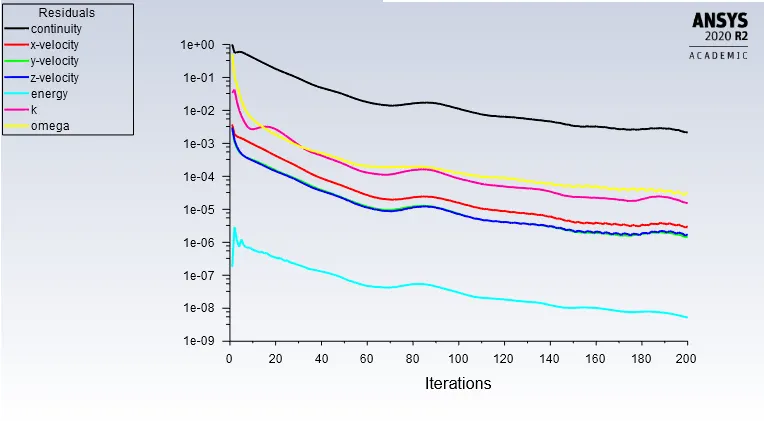
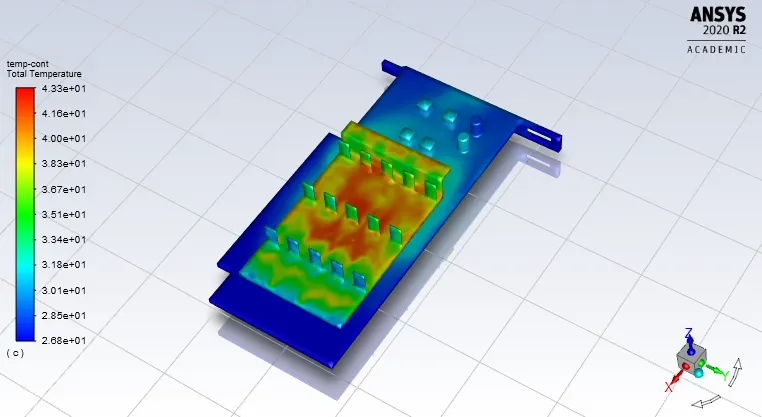
* For velocity of 5 m/s result obtained as follows:
* Residual plot:
* Temperature contour:
* Temperature contour of processor:
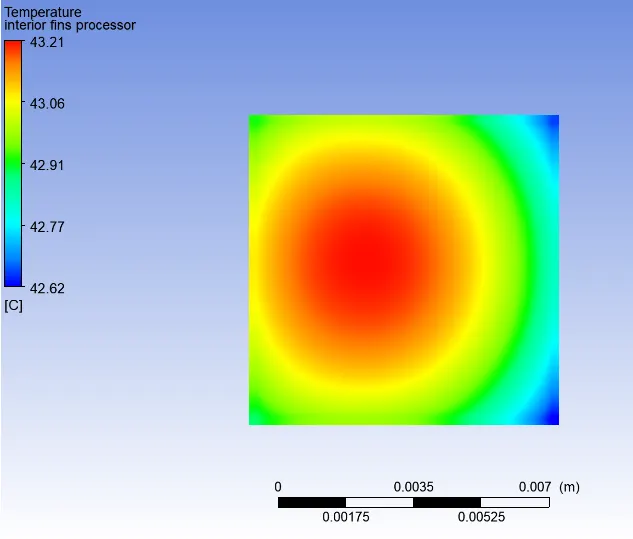
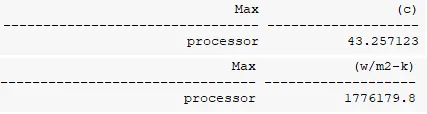
Max temperature and max wall HTC is computed,
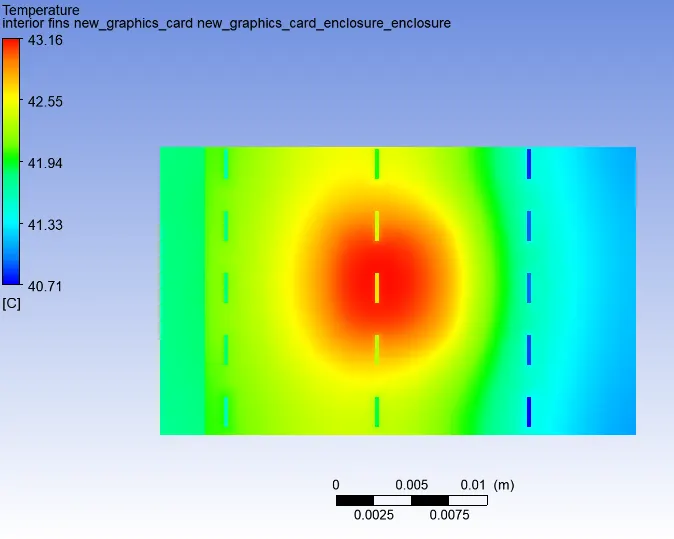
* Temperature contour of fin:
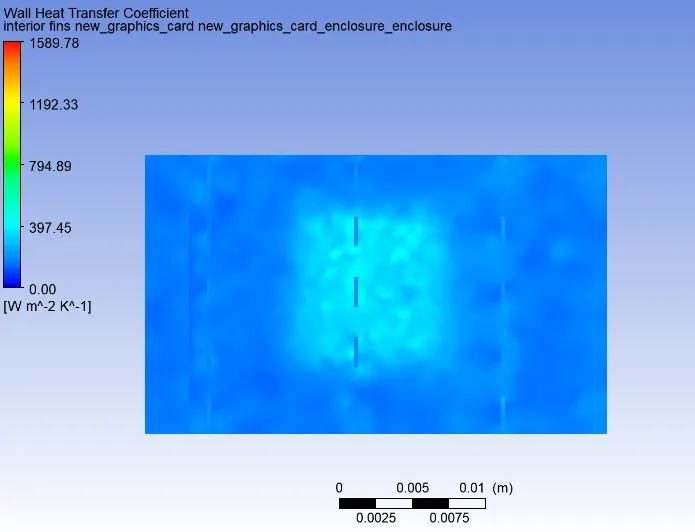
* Wall HTC contour of fin:
Area weighted average value of temperature and wall HTC is computed,

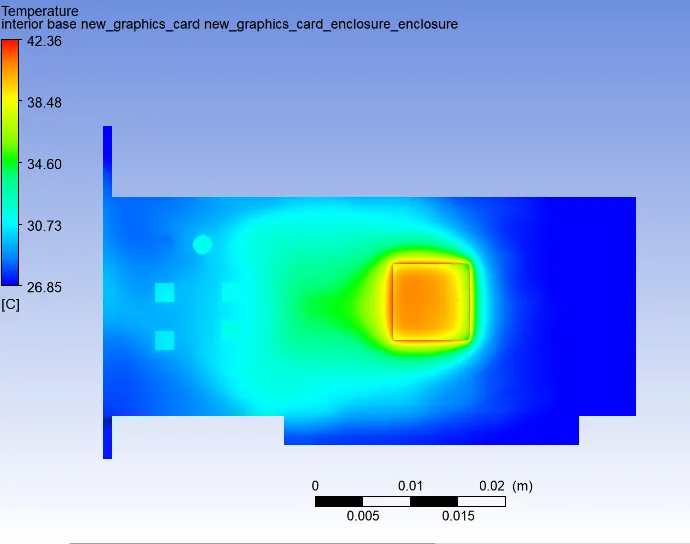
* Temperature contour of base:
* Wall HTC contour of base:
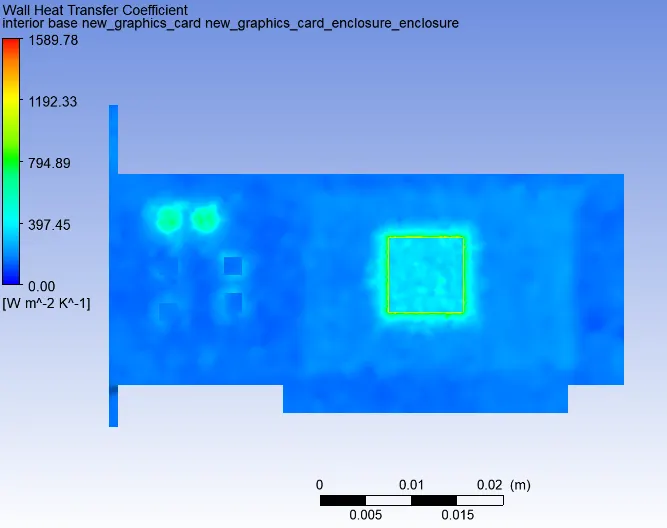
Area weighted average value of temperature and wall HTC is computed,

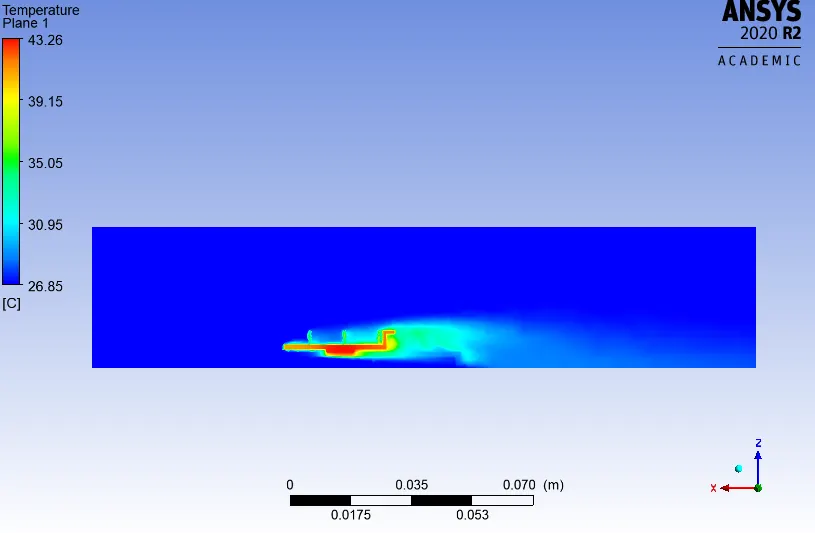
* Temperature profile along GPU:
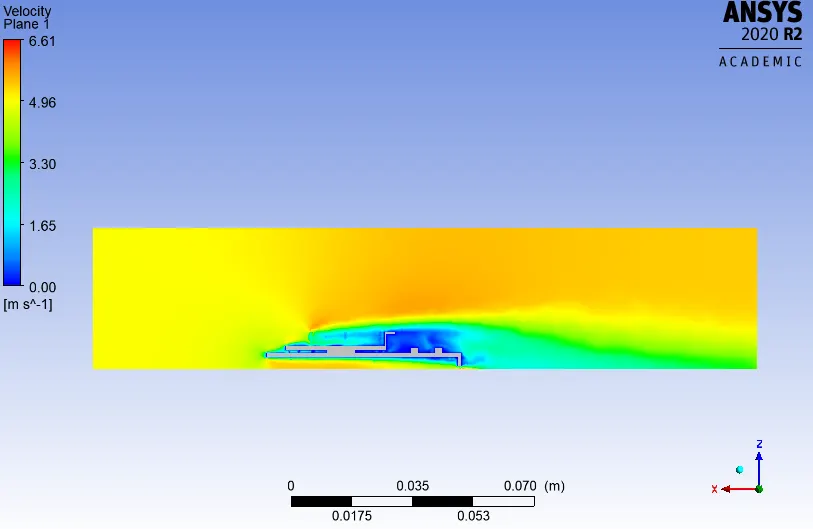
* Velocity profile along GPU:
* Max temperature and max wall HTC computed at processor (using volume definition report) at different velocity is tabulated below:
| Velocity (m/s) | Max temperature (°C) | Max wall HTC (w/m^2*k) |
| 1 | 71 | 1776001.4 |
| 3 | 49 | 1776004.7 |
| 5 | 43.25 | 1776179.8 |
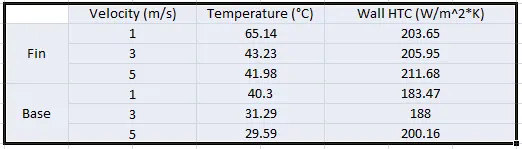
* Area weighted temperature and wall HTC is computed at fin and base plate at different velocities is tabulated below
#OBSERVATIONS:
* From max wall HTC and max temperature tabulation for processor it can be clearly observed that as velocity increases the max temperature is decreasing and max wall coefficient is increasing, this is because as velocity increases forced convection increases as a result more heat is being carried away.
* From area weighted average tabulation for fin and base same trend as that in case of processor is observed, as velocity increases temperature at fin and base is decreasing which is an indication that as we increase velocity forced convection is becoming more effective.
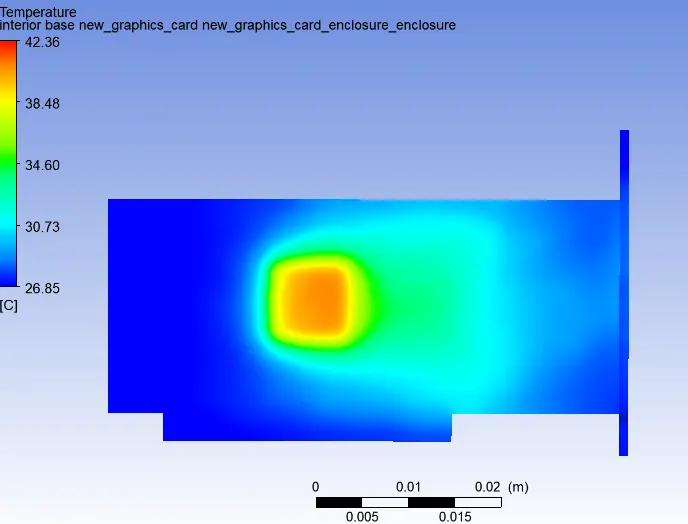
* If we need to point out a point which will be a potential hotspot then it will be underneath the base plate, as shown below