Conjugate Heat Transfer Analysis on a graphics card.
Aim: To perform a CHT analysis on a graphic card.
Introduction:
A CHT (Conjugate Heat Transfer) analysis is useful where there are multiple modes of heat transfer in our computational domain, like conduction and convection. Having such a great number of applications for this type of simulation makes it important to be studied in depth.
Cooling systems in Graphics card:
Computer cooling is required to reduced waste heat produced by the computer components to keep them within the operating limits. Exceeding the operating limits would cause temporary or permanent damage to the components. so it is necessary that the component should be in the permissible limits. Components that are susceptible to temporary malfunction or permanent failure if overheated include integrated circuits such as CPUs, chipsets, graphics cards, and hard disks.
The use of heatsinks cooled by airflow reduces the temperature rise produced by a given amount of heat. Attention to patterns of airflow can prevent the development of hotspots. Computer fans are widely used along with heatsink fans to reduce the temperature by actively exhausting hot air. There are also more exotic cooling techniques, such as liquid cooling. All modern-day processors are designed to cut out or reduce their voltage or clock speed if the internal temperature of the processor exceeds a specified limit.
CHT analysis of Graphics card:
In this simulation, the type of cooling system that was used is the air cooling system. The processor was assumed in the idle rendering state. So the processor power was considered for idle rendering state only.
Objectives:
1) The main objective of this analysis is to determine the maximum temperature attained by the processor and heat transfer coefficients at appropriate areas as well as potential hotspots on the model.
2) Run the simulation by varying the velocity from 1m/sec to 5m/sec for at least 3 velocities and discuss the results.
3) To understand the effect of various meshing concepts and methods.
Modeling and Meshing
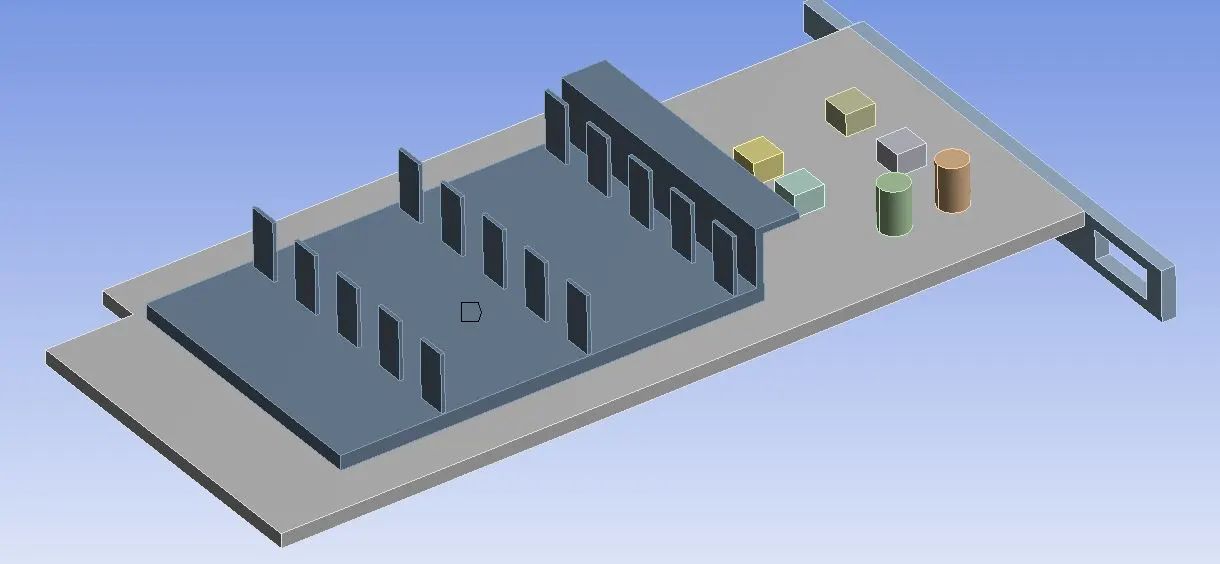
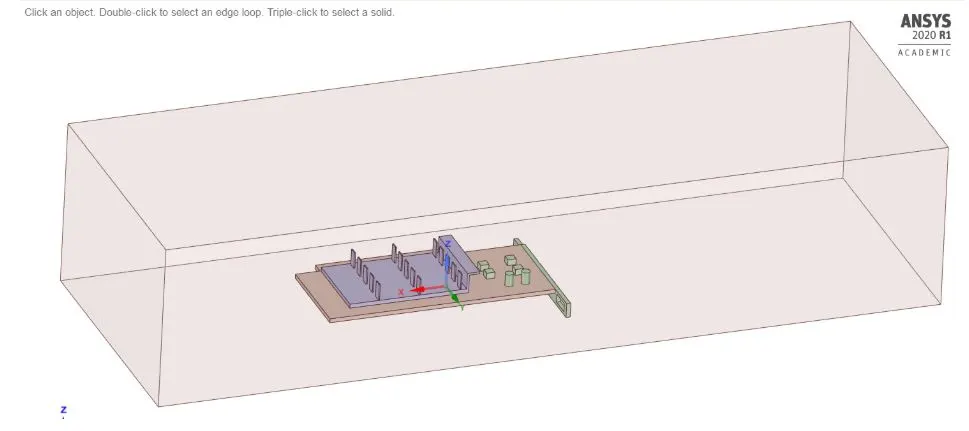
The model of the graphic card used for the simulation can be seen from the figure below. The graphic card consists of four main parts namely Base, Fins, Processor, and components. It is enclosed in the Computational domain for airflow to perform CFD air cooling analysis.
Meshing is done using ANSYS Mesher with sizing given as follows:
For Body and Enclosure: 5mm
For Components : 0.6mm
For Fins and Processor: 0.5mm
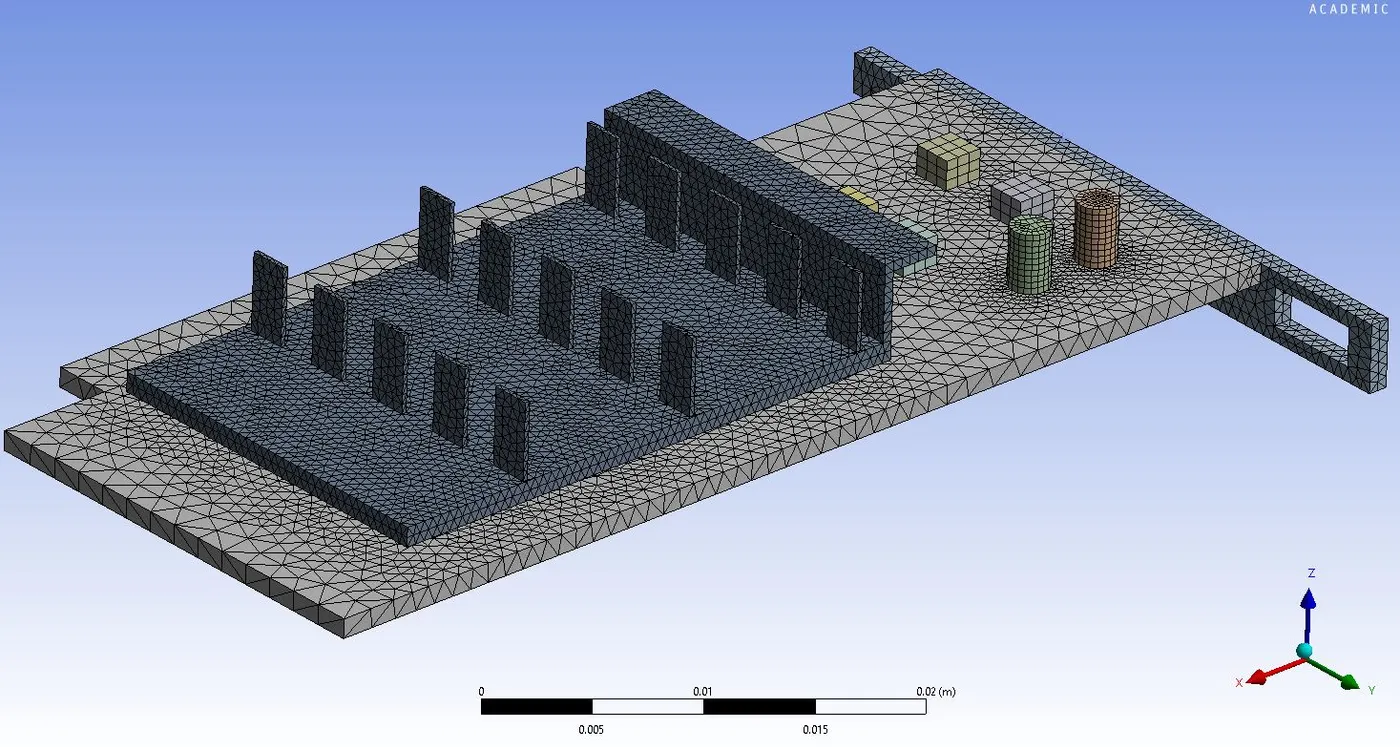
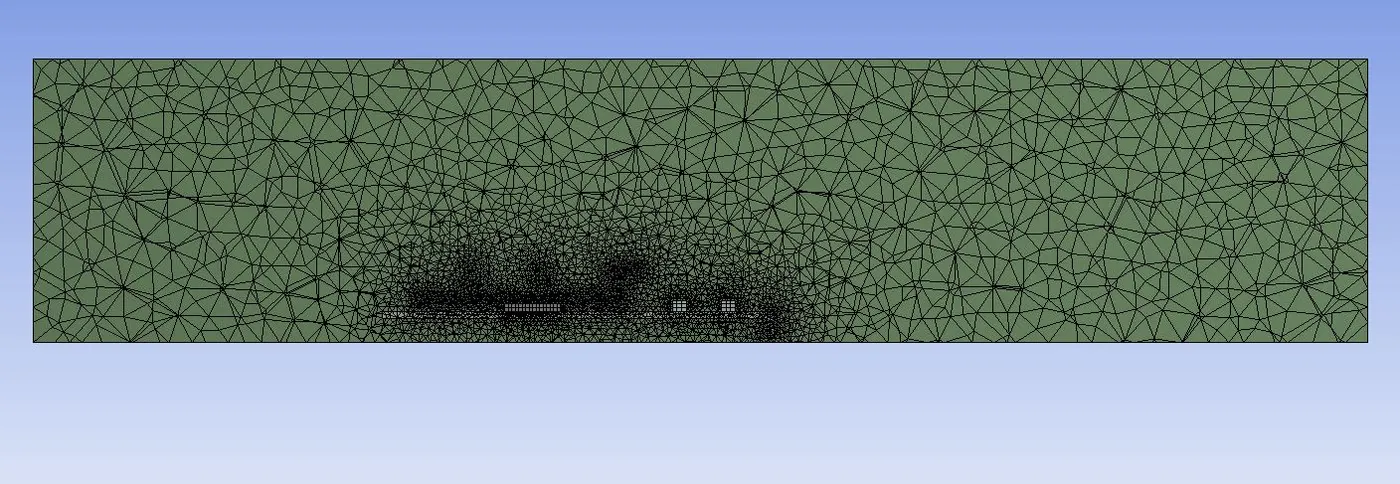
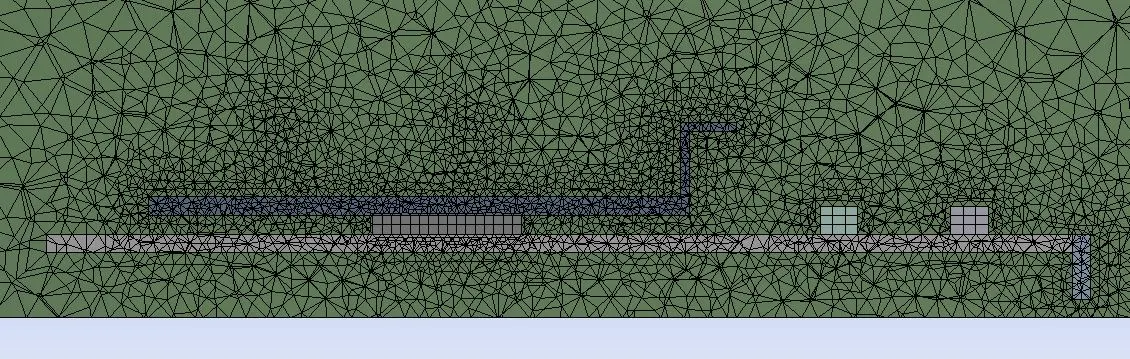
Statistics of mesh-
Number of Nodes: 78642
Number of Elements: 449217
Setup and Simulation
After mesh generation next step in simulation is physical and boundary condition setup which is as listed below.
Simulation type: Steady-state
Solver: Pressure-based
Energy equation: Enabled
Turbulence model: k-Omega SST model
Boundary Condition :
Inlet velocities : 1,3 and 5 m/s
Temperature: 300K
Cell zone conditions :
Fluid as an air medium.
Materials used for different components of the graphics card:
Base - Titanium
Fins - Aluminium
Processor - Gold
set Processor/core as source term as heat is generated by it in the graphic card.
Consider,
Power supplied to Core (P) = 6 w
We have,
The volume of a processor (V) = 64 mm3
- Therefore , Heat generated = P/V = 93750000 w/m3
Results and Post-processing
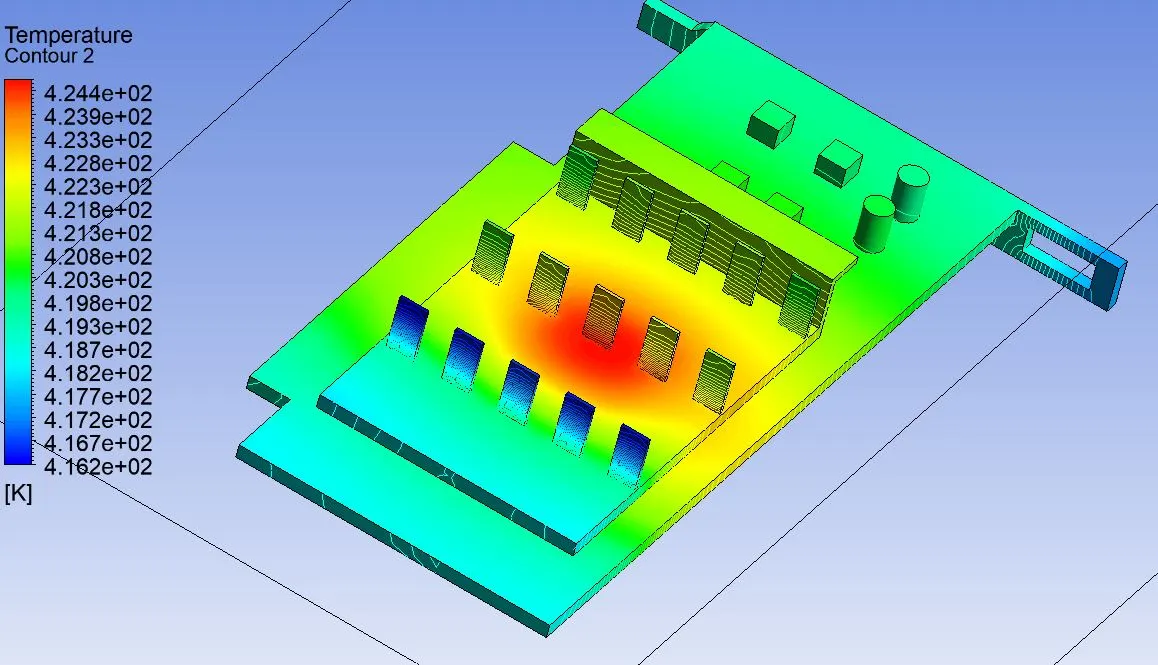
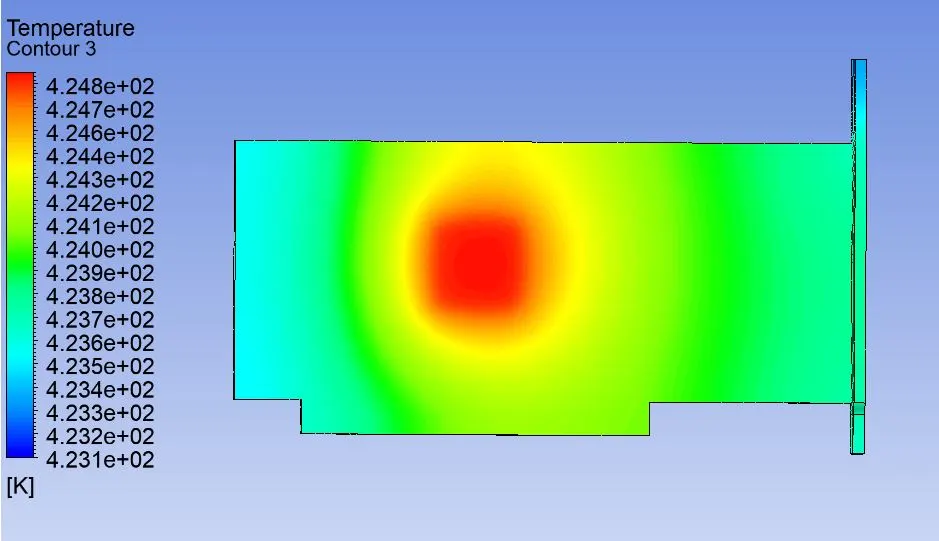
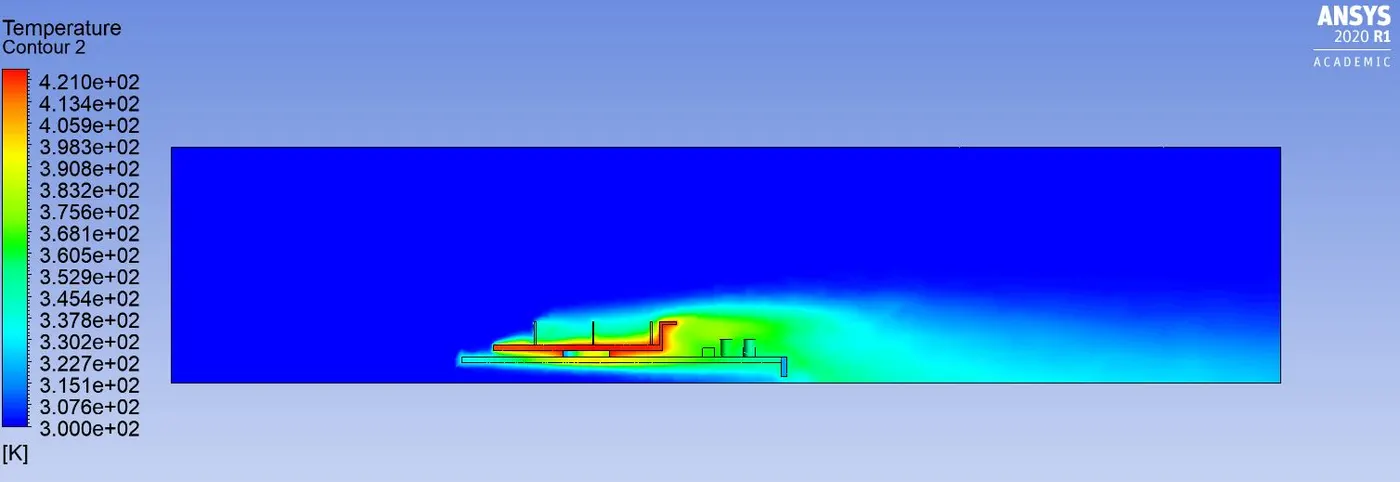
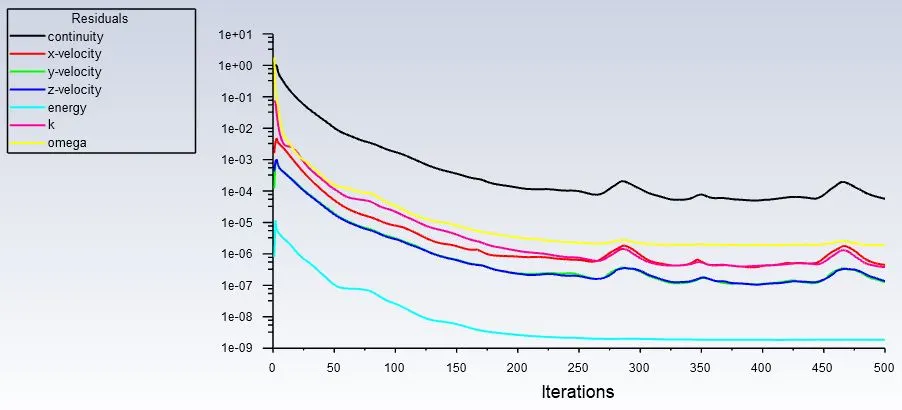
After performing simulations with all 3 cases of velocities, here are the analysis of results and post-processing results for the Air cooling of the graphic card using CHT Simulation.
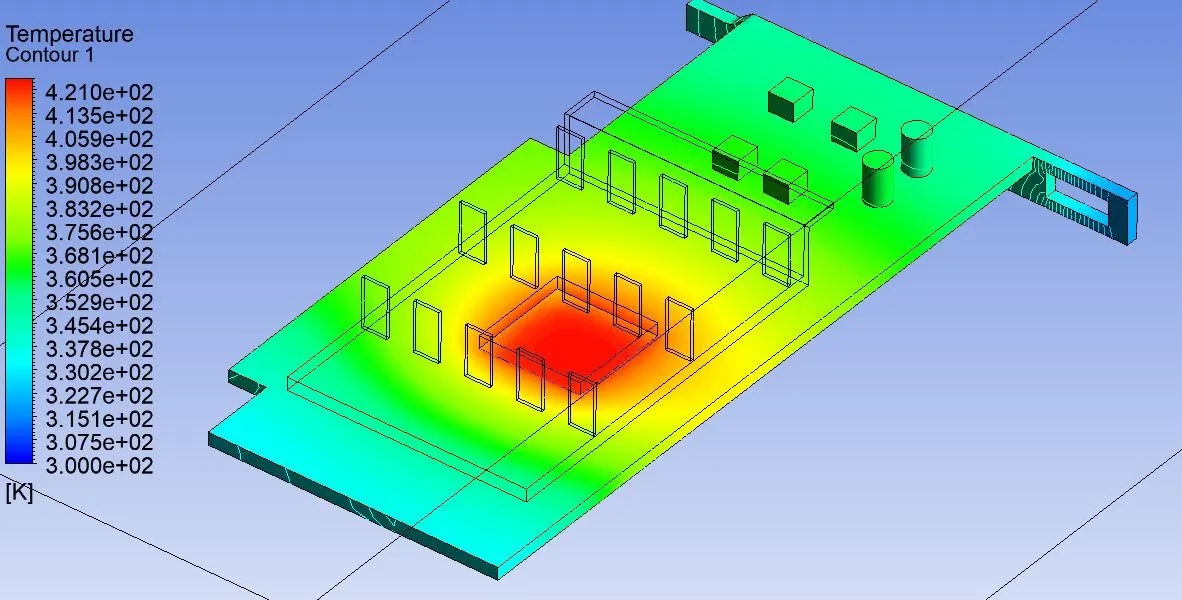
Case 1 : Velocity = 1 m/s
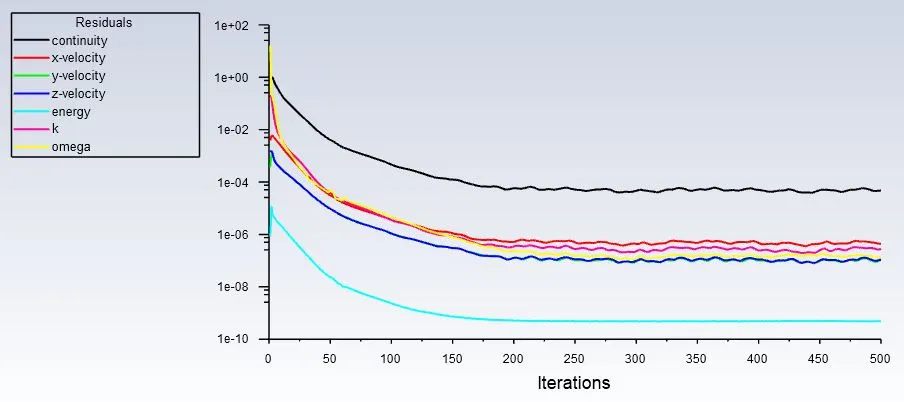
Residual plot of a simulation
Temperature contour around the base Temperature contour around the processor
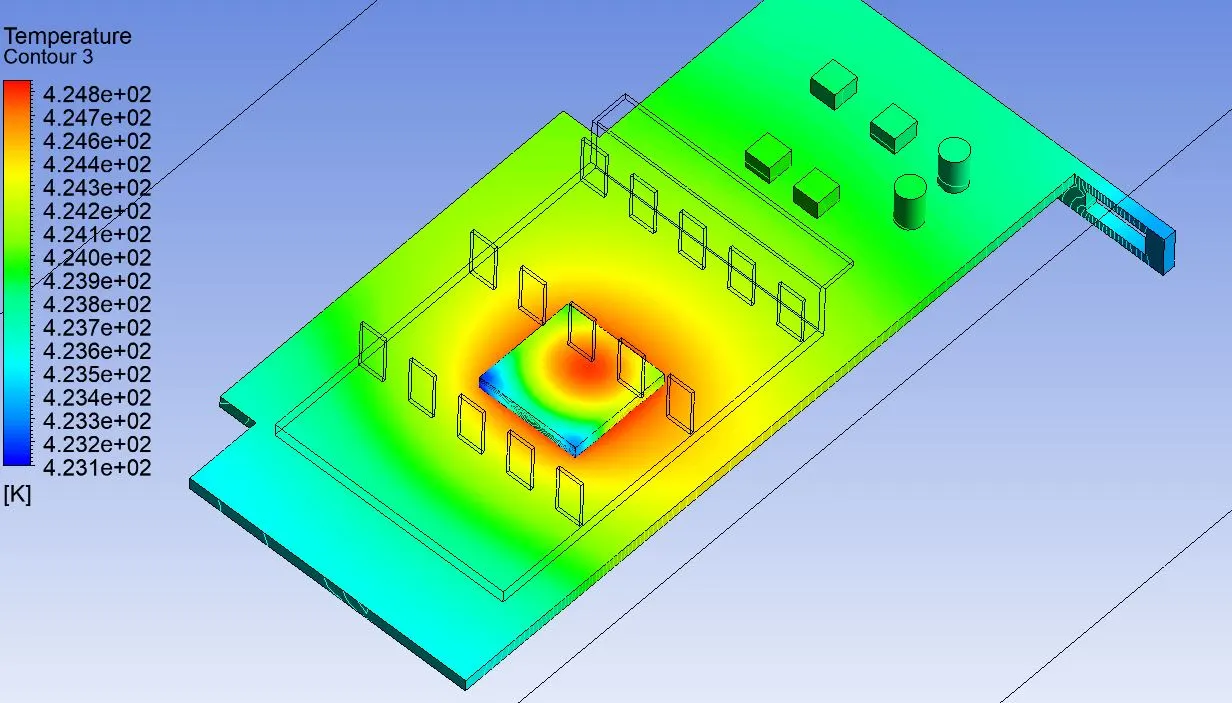
Temperature contour around the fins Temperature contour around the processor on the backside
Temperatur profile on section plane in an enclosure
Case 1 : Velocity = 3 m/s
Residual plot of a simulation
Temperature contour around the base Temperature contour around the processor
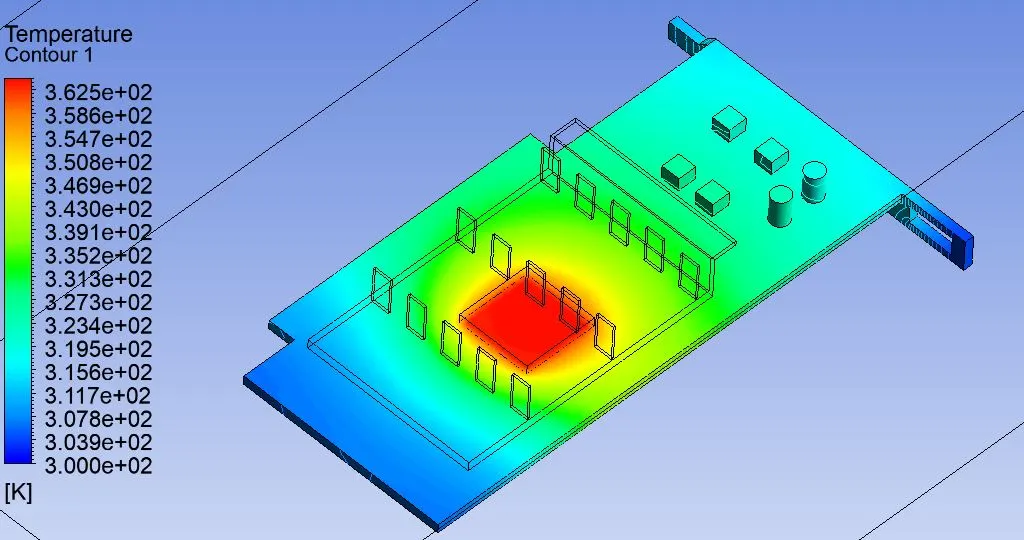
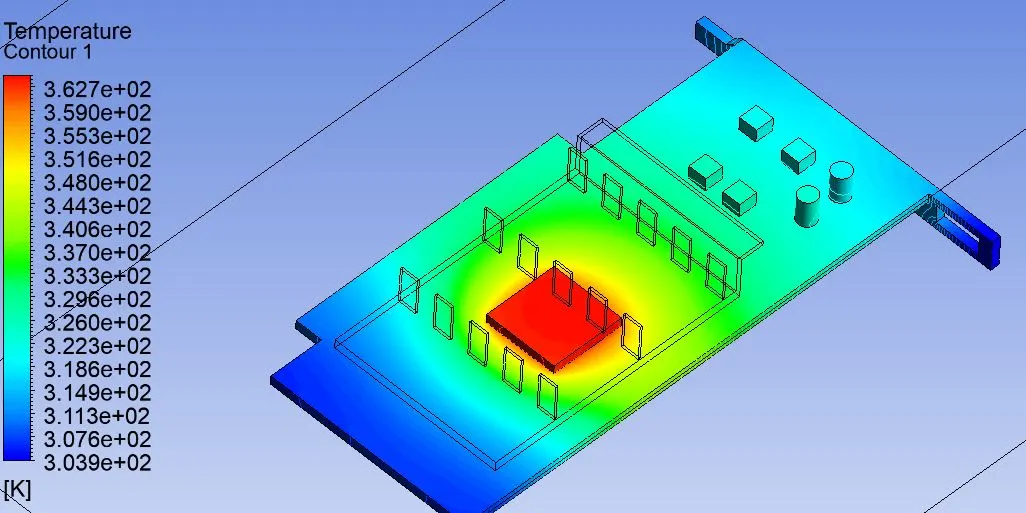
Temperature contour around the fins Temperature contour around the processor on the back side
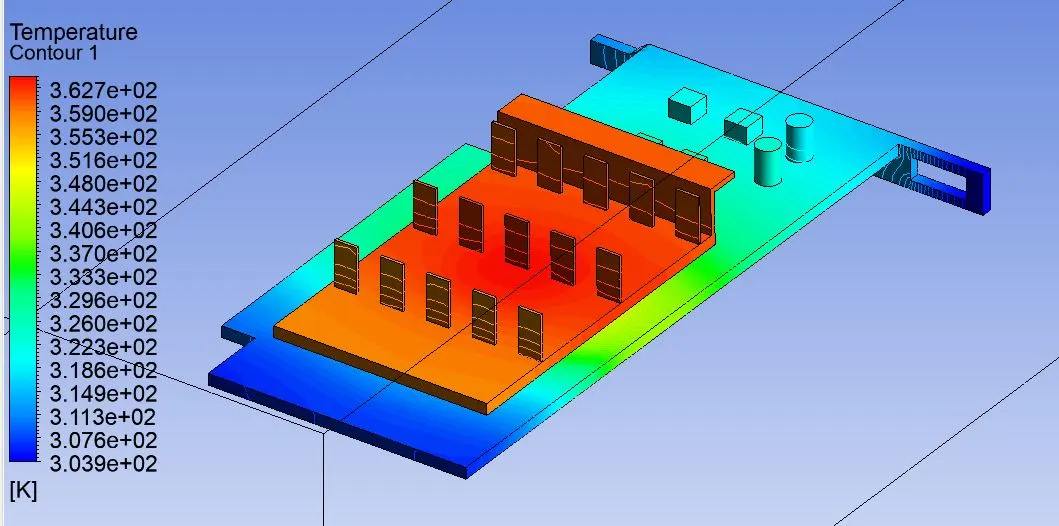
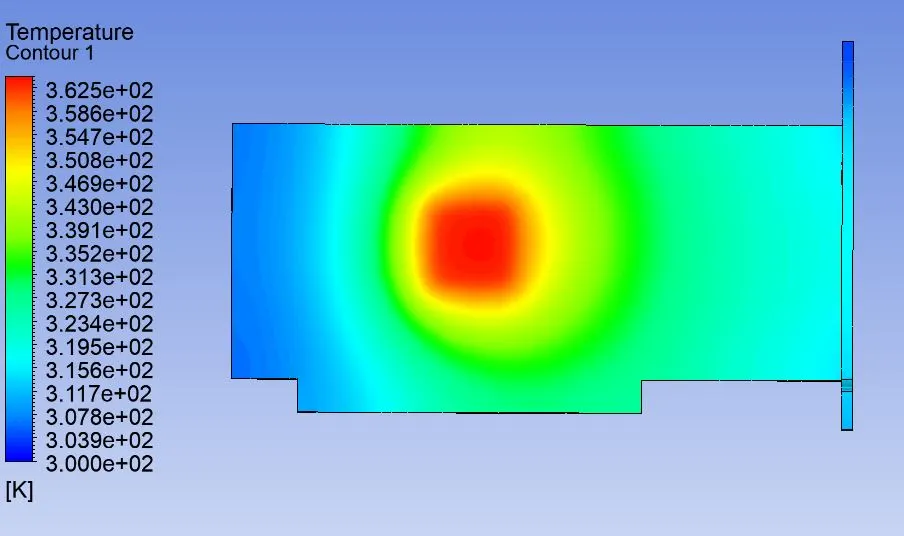
Temperatur profile on section plane in an enclosure
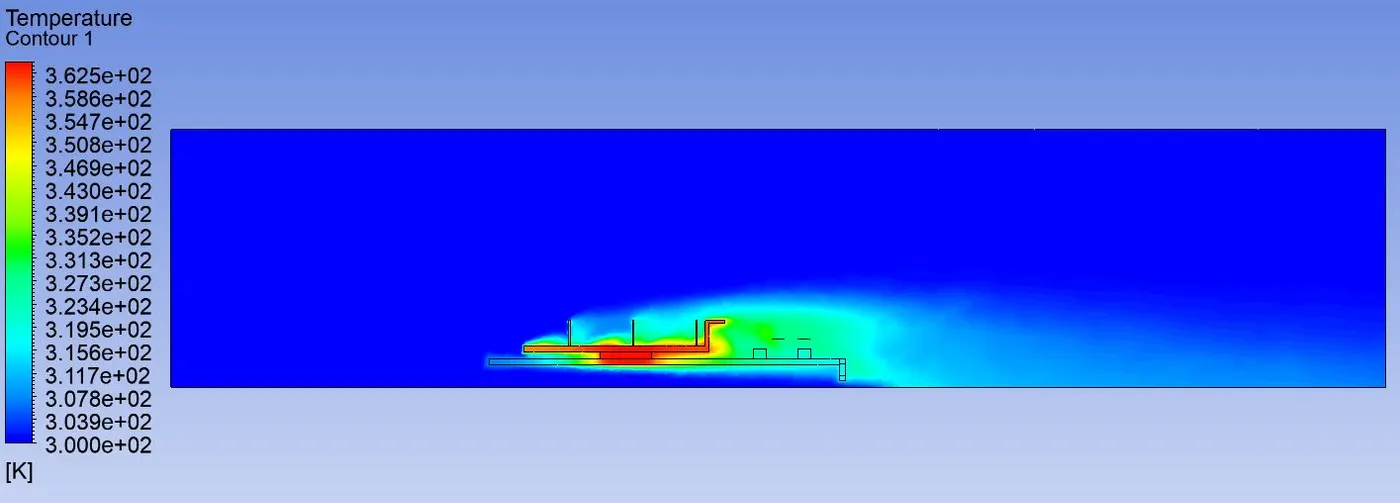
Case 1 : Velocity = 5 m/s
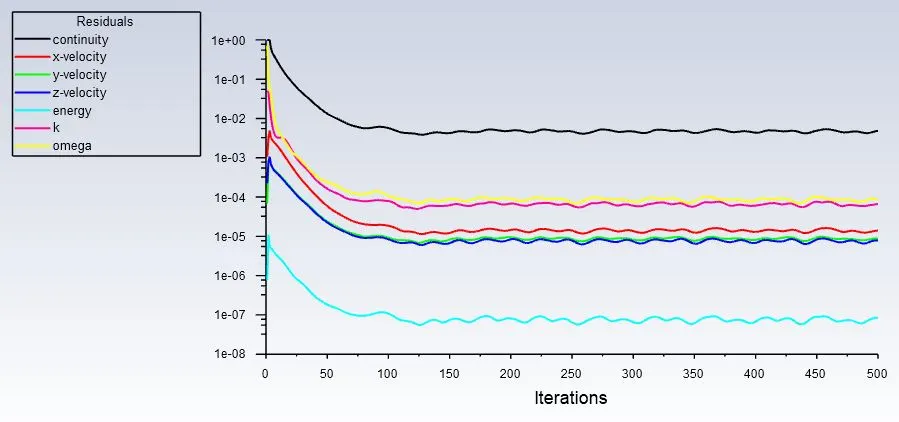
Residual plot of a simulation
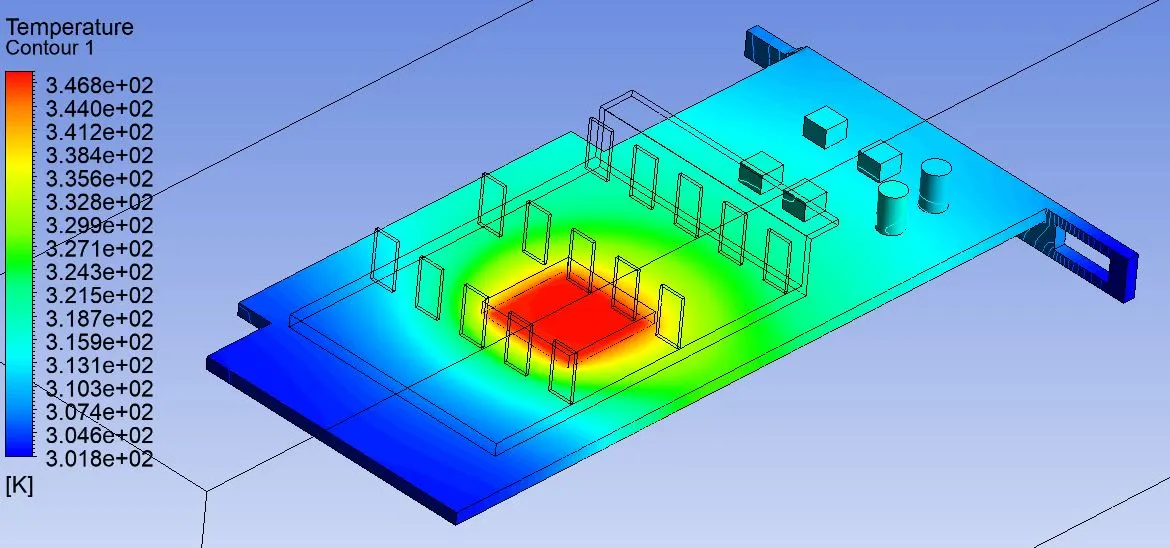
Temperature contour around the base Temperature contour around the processor
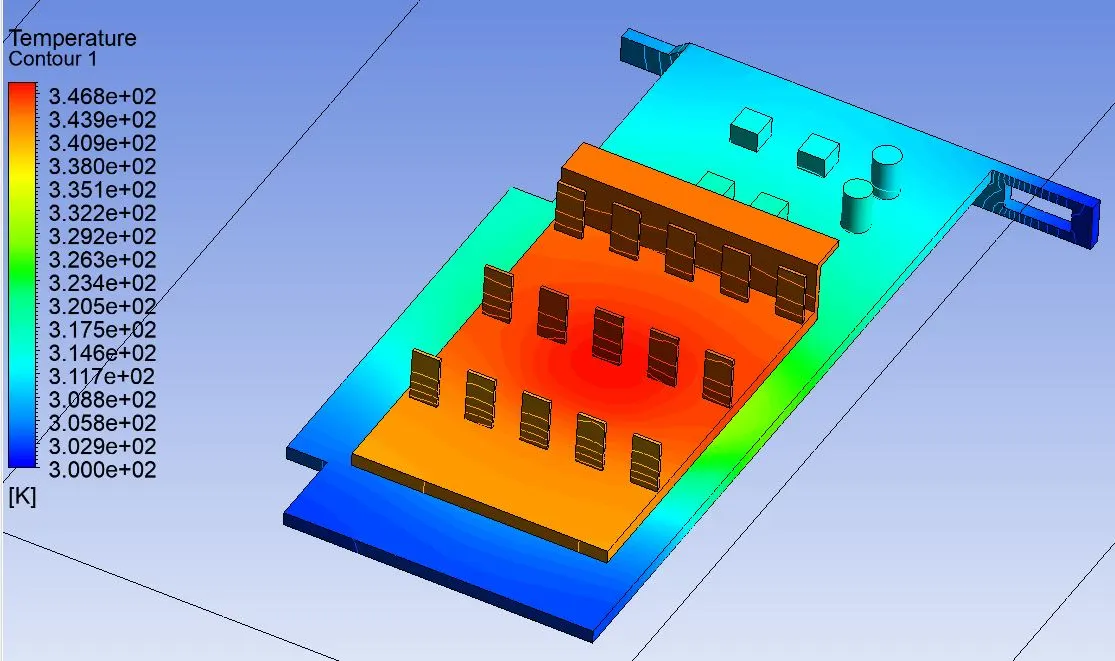
Temperature contour around the fins Temperature contour around the processor on the back side
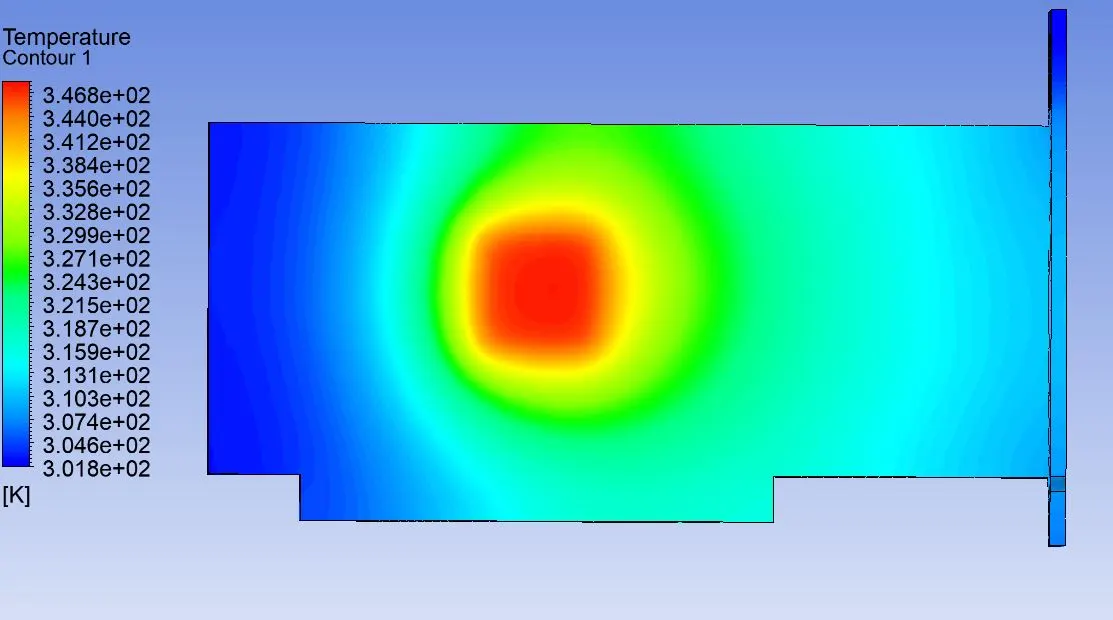
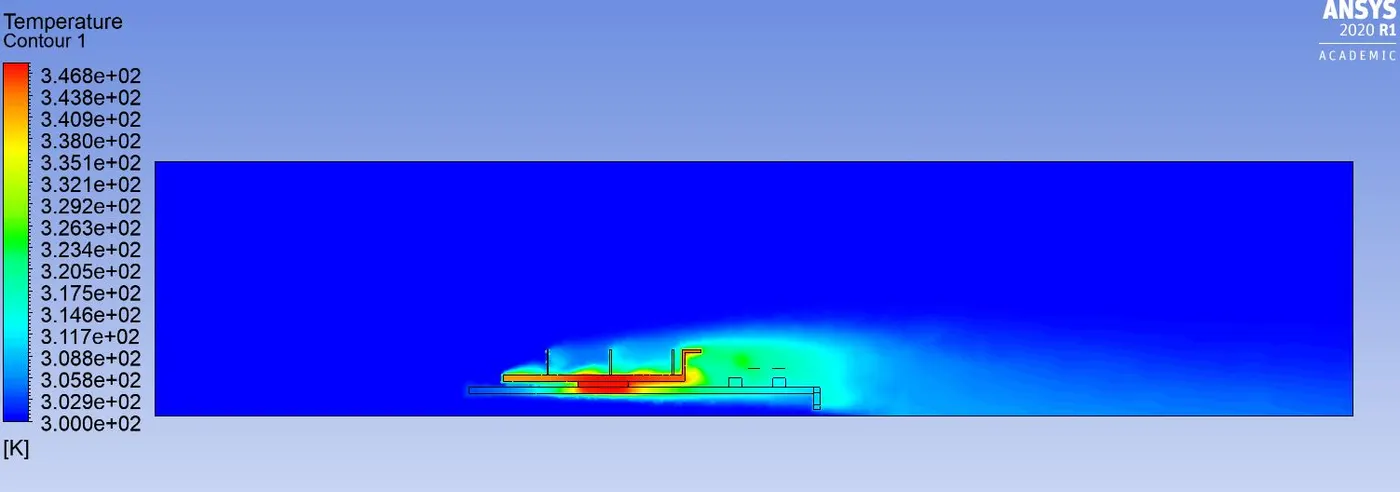
Temperatur profile on section plane in an enclosure
Tabular comparison of Value of Temperature at different Velocities
| Case No. | Inlet Velocity Value | Maximum Temperature attained | Wall heat transfer coefficient |
| 1 | 1 m/s | 421 K | 545.378 |
| 2 | 3 m/s | 362.5 K | 545.380 |
| 3 | 5 m/s | 346.8 K | 545.387 |
Potential hotspots on the model:
When designing the graphic card components special attention needs to be given to the nearby components of the processor, as the processor is a heat generation source and nearby regions in fins and base are hot-pots in graphic card simulation which needs special attention.
Conclusion
From this simulation, it was observed that the heat transfer coefficient increased around the fins in a refined setup. Since fins are extended surface areas for better heat transfer, the temperature at the processor decreased in the refined setup with a high heat transfer coefficient at the fins which are physically correct.
Also as the inlet velocity increases then eventually the overall heat generation rate and hence temperature in nearby regions in a processor decreases. Whereas the wall heat transfer coefficient is independent of the inlet velocity of air, it remains constant for the same mesh setting.